Comprehensive measurement of biopharmaceutical r&d investment
- Select a language for the TTS:
- UK English Female
- UK English Male
- US English Female
- US English Male
- Australian Female
- Australian Male
- Language selected: (auto detect) - EN
Play all audios:

Research and development (R&D) investment in the biopharmaceutical industry drives the discovery of new drugs to address unmet medical needs and improve patient outcomes. Conventional
understanding of the magnitude, intensity and productivity of R&D investment in the biopharmaceutical ecosystem is predominantly based on survey data from large, publicly listed
biopharmaceutical companies (see Related links). Such measures provide an incomplete picture of the funding landscape because they ignore R&D investments made by smaller public
commercial companies, development-stage public companies that have no commercial products and private companies, all of which have become increasingly important to the drug development
ecosystem. A comprehensive and transparent measure of R&D investment is important for policy-making that affects the R&D ecosystem. Here, we present an analysis of global R&D
investment and revenue in 2021 for the full range of companies in the biopharmaceutical ecosystem — public and private companies, at the development stage and commercial stage — using
reported financial statement data and data on capital raises. The methodological strategy we propose could be used in future research to assess trends in R&D investment over time,
activity in various submarkets and the impact of policy decisions. STRATEGY TO MEASURE R&D INVESTMENT We categorized the R&D ecosystem into publicly listed and privately owned
companies, each classified as either in the commercial or development stage, yielding four distinct groups of companies (see Supplementary information for details). Commercial-stage
companies undertake a variety of activities, including the development of new drugs and the commercialization of existing drugs, while development-stage companies have no commercialized
products, and all activities are assumed to be dedicated to the development of new drugs. Furthermore, reporting requirements for public and private companies differ. These differences
influence how we measure R&D investments and revenues. PUBLIC COMPANIES . We identified public companies with a pharmaceutical or biotechnology primary industry code in S&P Global
Market Intelligence (Capital IQ) data. We manually reviewed company descriptions for all companies constituting the top 90% of total R&D expense and excluded those not developing new
drugs (such as generics, contract manufacturing and medical devices companies). We also filtered by sub-industry codes and company description keywords to exclude irrelevant companies and
removed operating subsidiaries to prevent overcounting (see Supplementary Box 1 and Supplementary Tables 1–3). A public company was deemed commercial-stage if it reported over US$1 billion
in 2021 revenue, had keywords indicative of commercial operations or launched an approved product in the last 10 years. All others were labelled development-stage (see Supplementary Box 2
and Supplementary Table 4). PRIVATE COMPANIES . Private commercial-stage companies were gathered using Capital IQ and manual searches, while data on private development-stage companies that
received private funding were obtained from Pitchbook. We used an algorithm of sub-industry codes and company description keywords, aided by manual review of deals over $1 billion to exclude
irrelevant companies and accompanying deals (see Supplementary Box 3 and Supplementary Tables 2, 5, 6). REVENUES . To measure revenue for commercial-stage companies, we used reported net
revenue, after removing non-pharmaceutical revenues for conglomerates. Development-stage companies are assumed to have no sales revenue from commercial products. INVESTMENT . To measure
R&D investment for commercial-stage companies, we used reported R&D expense as defined by the Financial Accounting Standards Board and the International Accounting Standards Board,
which can include in-process R&D (IPR&D) expenses (acquired R&D that is incomplete) and removed non-biopharmaceutical operations (for example, cosmetics) for conglomerates.
Merger and acquisition payments not attributable to IPR&D were not counted as R&D investment. For public development-stage companies, we used reported net loss (income). This is
based on our assumption that development-stage companies’ entire cost structure exists to support R&D activities (given that these companies have no launched or approved products) and
that any revenue from partnership agreements with commercial-stage companies is captured as R&D on the commercial-stage companies’ income statement. For private development-stage
companies, financial statement data is not readily available. We thus estimated R&D investment using a three-year average (2019–2021) of total capital raised through venture capital
(VC), private equity growth and debt funding to account for timing differences between capital raise and deployment (for company counts, we use the gross number of companies that raised
capital during 2019–2021). Detail on the measurement of R&D investment in each population is provided in Supplementary Boxes 4–7. We also conducted sensitivity analyses to assess the
impact of IPR&D expense and alternative measurement approaches for public development-stage companies. ANALYSIS OF R&D INVESTMENT Global biopharmaceutical R&D investment in 2021
was $276 billion across 4,191 companies, with total net revenue of $1,022 billion across 583 companies. This yields a global R&D intensity of 27 percent (R&D investment as a share of
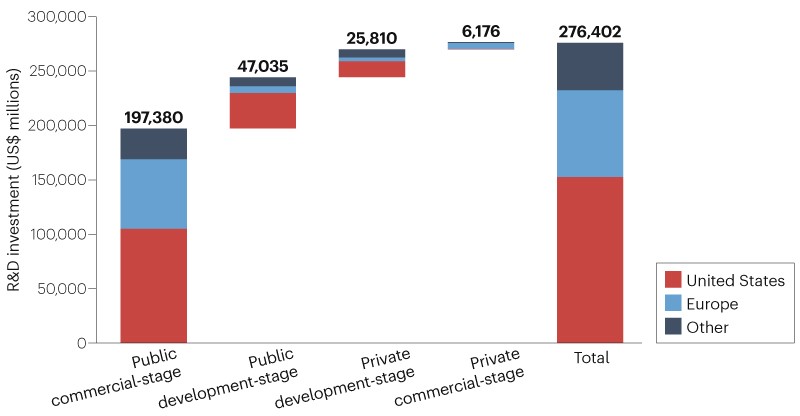
revenue). The top 20 companies by revenue (accounting for 71% of total revenue) contribute 50% of R&D investment. Fig. 1 summarizes each population’s contribution to ecosystem R&D
investment split by location of company headquarters. 583 commercial-stage and 3,608 development-stage companies accounted for $204 billion (74%) and $73 billion (26%) of R&D investment,
respectively. 2,755 private companies contributed $32 billion (12%) of R&D investment. Companies headquartered in the USA, Europe and Asia/Pacific regions contributed 55%, 29% and 15%
of total R&D investment, respectively. Of the three regions, the USA had the highest R&D intensity (34%), followed by Europe and Asia/Pacific (22% and 20%, respectively). Further
detail on geographic breakdown is provided in Supplementary Table 7. We performed sensitivity analyses to assess the impact of changes to our methodology for measuring R&D investment
amongst the public company population. Notwithstanding our rationale for including IPR&D expenses, we performed a sensitivity to remove IPR&D expenses. Aggregate R&D investment
was reduced by $13.4 billion (5%). We also analysed the impact of changing our measurement approach for the public development-stage company population (Supplementary Table 8). DISCUSSION
Our replicable approach to measuring R&D investment is more comprehensive than in previous studies. Consequently, our estimate of over $276 billion R&D investment across the
biopharmaceutical ecosystem globally in 2021 is substantially larger than previous estimates, which frequently measure R&D among the largest public companies only. For example, a survey
based on contributions from PhRMA members produced a commonly cited industry R&D estimate of $102.3 billion in 2021. Separately, Evaluate Pharma estimated $238 billion of 2021 global
R&D using a proprietary model. Our measures of R&D investment intensity have implications for debates on R&D productivity. At 27% globally and 34% in the US, R&D intensity
significantly surpasses previous estimates such as the 21% reported in the PhRMA survey in 2021. Our findings indicate geographical differences in R&D intensity, revealing the
disproportionate contributions of US-headquartered companies. While the changing roles and varied business models within the R&D ecosystem are areas for future research, we offer a
transparent and reproducible measure as a foundation for those discussions. Although most R&D investment occurs at commercial-stage companies, a considerable amount ($73 billion; 26%)
occurred at development-stage companies. We cannot ascertain the economically optimal division of R&D investment between commercial and development-stage companies, but our analysis
indicates that ignoring the share of investment in smaller, non-public companies probably understates contemporary estimates of biopharmaceutical R&D by at least $25 billion. Our
analysis illuminates the scale of biopharmaceutical R&D investment within a multifaceted and interlinked private sector funding ecosystem. However, the amount of R&D capital
allocation does not automatically ensure the optimal distribution of R&D investments to the highest unmet medical need. This is affected by policy and market incentives and reflects what
patients, health systems, and societies value. Further research should clarify the policy levers that can bolster R&D productivity. The complementary role of government funding should
be acknowledged, notably in addressing social good associated with the provision of basic science research. Additional contextualization of our findings are provided in Supplementary Box 9.
As with previous studies in this area, limitations exist. The exigencies of pandemic-related research might have skewed industry R&D patterns in ways not indicative of enduring trends
(such as revenue shifts, the prioritization of COVID-centric projects or fluctuations in government investments). Our estimates have the potential for error if data from Capital IQ and
Pitchbook were incomplete or inaccurate, or if corporate financial disclosures were erroneous. Limitations are described further in Supplementary Box 8. Finally, although our cross-sectional
study does not capture longitudinal shifts in the R&D funding landscape, the methodology lends itself for replication to allow multi-year trend comparisons.