Imaging-based body fat distribution and diabetic retinopathy in general us population with diabetes: an nhanes analysis (2003–2006 and 2011–2018)
- Select a language for the TTS:
- UK English Female
- UK English Male
- US English Female
- US English Male
- Australian Female
- Australian Male
- Language selected: (auto detect) - EN
Play all audios:

ABSTRACT BACKGROUND Limited studies have investigated the correlation between fat distribution and the risk of diabetic retinopathy (DR) in the general population with diabetes. The
relationship between obesity and DR remains inconclusive, possibly due to using simple anthropometric measures to define obesity. This study investigates the relationships between the
android-to-gynoid fat ratio (A/G ratio, measured using dual-energy X-ray absorptiometry) and DR within the US population with diabetes. METHODS The study used a population-based,
cross-sectional approach based on the 2003–2006 and 2011–2018 data of the National Health and Nutrition Examination Survey (NHANES). Multivariable logistic regression analyses were performed
on participants with diabetes to evaluate the contribution of body mass index (BMI), waist-to-height ratio (WHtR), and A/G ratio to the prevalence of DR. RESULTS The prevalence of DR was
22.2, 21.2, and 17.6% among participants with A/G ratios <1.0, 1.0–1.2, and ≥1.2, respectively. After adjusting sex, age, ethnicity, diabetes duration, hemoglobin A1c level, blood
pressure level, and non-high-density lipoprotein cholesterol level, a higher A/G ratio (≥1.2) was independently associated with decreased odds of DR (odds ratio [OR], 0.565; 95% CI:
0.372–0.858) compared with the A/G ratio of 1.0–1.2. Associations between a higher A/G ratio and DR remained statistically significant after adjusting for BMI (OR, 0.567; 95% CI:
0.373–0.861) and WHtR (OR, 0.586; 95% CI: 0.379–0.907). Moreover, these associations remained statistically significant in analyses using the ethnic-specific tertiles for the A/G ratio. In
sex-stratified models, these correlations remained in males. There was a significant inverse association between the A/G ratio and diabetes duration in males, which persisted after
multivariable adjustments (_p_ < 0.05). CONCLUSIONS A novel finding indicates that a higher A/G ratio is associated with a reduced likelihood of DR in males with diabetes. The results
from NHANES underscore the importance of considering imaging-based fat distribution as a critical indicator in clinical practice. SIMILAR CONTENT BEING VIEWED BY OTHERS WAIST-HEIGHT RATIO
AND WAIST ARE THE BEST ESTIMATORS OF VISCERAL FAT IN TYPE 1 DIABETES Article Open access 29 October 2020 PERSPECTIVE FROM NHANES DATA: SYNERGISTIC EFFECTS OF VISCERAL ADIPOSITY INDEX AND
LIPID ACCUMULATION PRODUCTS ON DIABETES RISK Article Open access 02 January 2025 ESTIMATED VISCERAL ADIPOSITY IS ASSOCIATED WITH RISK OF CARDIOMETABOLIC CONDITIONS IN A POPULATION BASED
STUDY Article Open access 27 April 2021 INTRODUCTION The prevalence of diabetes mellitus (DM) is increasing worldwide, with a projected 46% surge by the year 2045 [1]. Diabetic retinopathy
(DR) is a primary microvascular complication of DM and is a leading cause of vision impairment and blindness worldwide [2]. Studies have implicated a prevalence of DR at 37% among newly
diagnosed diabetics [3, 4]. Given the escalating global prevalence of diabetes, the number of individuals with DR is expected to grow, further exacerbating the negative social impact of this
condition. Obesity is a well-recognized risk factor for DM [5]. While obesity has been linked to increased risks of cardiovascular complications and kidney disease in individuals with
diabetes [6], its associations with diabetic retinal complications have yielded inconclusive findings. Various studies have reported mixed results regarding the relationships between body
mass index (BMI) and DR. A study indicated that a higher BMI was associated with DR [7]. The Diabetes Incidence Study in Sweden found a significant association between baseline high BMI and
severe non-proliferative DR and proliferative DR over a 10-year follow-up [8]. The similar associations were reported in the World Health Organization (WHO) study [9] and in the Diabetes
Control and Complications Trial [10]. Conversely, the Singapore Diabetes Management Project [11] and other studies [12,13,14,15] have suggested that a higher BMI may confer a protective
effect against DR. Moreover, the Wisconsin Epidemiologic Study of Diabetic Retinopathy found no significant association between obesity (defined by BMI) and the risk of DR incidence or
progression in type 2 DM (T2DM) [16]. Likewise, the Hoorn Study found no significant association between BMI and DR incidence in T2DM individuals [17]. Similarly, inconsistent results were
observed for the associations between DR and waist-to-hip ratio (WHR) and waist-to-height ratio (WHtR) in some studies [7, 13, 18,19,20]. The discrepancies in the reported association
between BMI, WHR, or WHtR, and DR may be partially attributable to the use of simple anthropometric measures to define obesity, which may not fully reflect body fat accumulation and
associated risk factors. Consequently, further research is necessary to better understand the role of body fat deposits in the development and progression of DR. Substantial evidence
supports causal relationships between excess fat in specific body regions and metabolic and cardiovascular disease [21,22,23,24,25]. The gynoid fat pattern, characterized by preferential fat
deposition in the hip and thigh regions, has demonstrated a protective effect against cardiovascular and diabetes-related mortality and impaired glucose metabolism. Conversely, the android
fat pattern, consisting primarily of adipose tissue around the trunk, is associated with the development of cardiovascular risk factors [26]. Dual-energy X-ray absorptiometry (DXA) is a
well-established, non-invasive method for measuring body composition with minimal radiation exposure. It provides an accurate assessment of regional adipose tissue depots, allowing for the
quantification of fat distribution, including android and gynoid fat masses. Among its clinical utilities, the android-to-gynoid fat ratio (A/G ratio) is reported to be associated with
incident T2DM [27], insulin resistance [28], nonalcoholic fatty liver disease [29], atherosclerosis [30, 31], and atrial fibrillation [32]. Despite the clinical utility of DXA in evaluating
fat distribution and its links to various health conditions, limited studies have investigated the impact of fat distribution on retinopathy in the population with diabetes. Consequently,
the current study aims to fill this gap and determine the contribution of specific regional fat accumulation patterns to DR in individuals with diabetes. The DXA-assessed body composition
data will be used to investigate the independent role of body fat distribution in the prevalence of DR. METHODS DATA SOURCES This study has presented an analysis of data obtained during the
2003–2004, 2005–2006, 2011–2012, 2013–2014, 2015–2016, and 2017–2018 cycles of the National Health and Nutrition Examination Survey (NHANES). NHANES is a complex cross-sectional survey
program conducted in the United States (U.S.) by the National Center for Health Statistics (NCHS) of the Center for Disease Control and Prevention
(https://www.cdc.gov/nchs/nhanes/index.htm). NHANES conducted a complex, multistage, clustered probability sampling design and included a representative sample of the general US population
of all ages. NHANES adhered to the principles of the Declaration of Helsinki, and its research procedures were approved by the NCHS Research Ethics Review Board. Informed consent was
obtained from all survey participants. Ethical approval was not required for this study because the NCHS Research Ethics Review Board approved the NHANES protocols. The investigation was
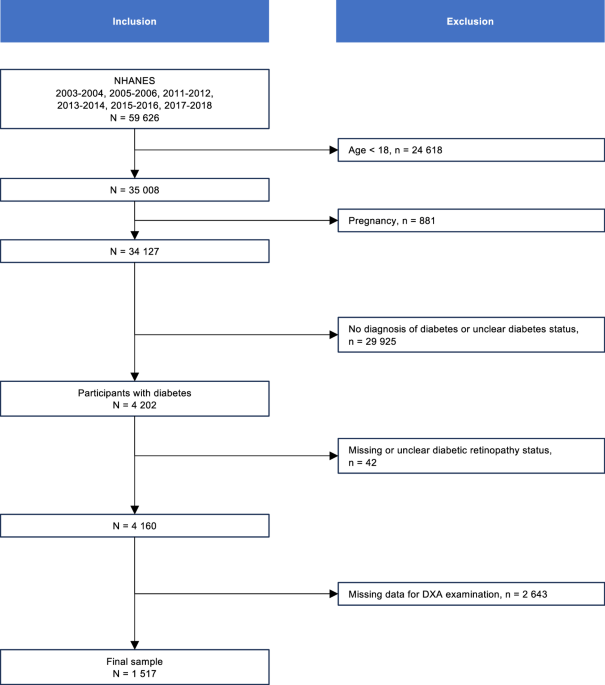
based on secondary analyses of de-identified data. STUDY DESIGN AND ANALYTIC SAMPLE The study included participants in six NHANES cycles, covering 2003–2004, 2005–2006, 2011–2012, 2013–2014,
2015–2016, and 2017–2018. Diabetes was defined as a self-report of diabetes diagnosis by a physician or other health professional [33]. The study population included participants with
diabetes. Pregnant participants, individuals aged <18 years, individuals without information for DR, or those with invalid A/G ratio values were excluded from the analysis, leading to a
final sample of 1517 participants with available data (Fig. 1). STUDY VARIABLES Demographic variables included in this study were age, gender, and race/ethnicity. The duration of diabetes
and diabetic retinopathy were extracted from diabetes questionnaires [33,34,35,36]. Weight, height, waist circumference, and blood pressure readings were collected in mobile examination
centers with standard protocols. BMI was calculated as weight in kilograms divided by height in meters squared and was classified as <25, 25–30, and ≥30 kg/m2, according to the WHO
definition for international BMI classification. The WHtR was determined by dividing the waist circumference by height and was categorized into three tertiles based on the data of the final
sample population: the first tertile (<0.61), the second tertile (0.61–0.69), and the third tertile (≥0.69). The A/G ratio was measured by DXA. Android and gynoid regions were defined by
the Hologic APEX software used in the scan analysis [37]. Tertiles of the data from the final sample population were utilized to classify the A/G ratio into the following: first tertile
(<1.0), second tertile (1.0–1.2), and third tertile (≥1.2). Non-high-density lipoprotein cholesterol (non-HDL-C), a measure of total cholesterol minus high-density lipoprotein
cholesterol, was used as a measure of dyslipidemia in analyses. Non-HDL-C was demonstrated to be a predictor of cardiovascular disease, and individuals with diabetes were recommended to
achieve a non-HDL-C target of <130 mg/dL [38, 39]. Glycemic control was assessed by hemoglobin A1c (HbA1c) and was stratified into well-controlled (HbA1c < 53 mmol/mol [7.0%]) and
poorly controlled (HbA1c ≥ 53 mmol/mol [7.0%]). Controlled hypertension was set as blood pressure less than 140/90 mmHg. Detailed descriptions of blood collection and processing procedures
were provided on the NHANES website. DATA ANALYSIS In sensitivity analyses, the study population was partitioned into tertiles according to ethnic subgroups in consideration of racial and
ethnic variations in BMI, WHtR, and the A/G ratio. BMI was analyzed continuously and categorically (using the international WHO definitions for generalized obesity and tertiles defined
within each ethnic subgroup). WHtR and the A/G ratio were assessed continuously and categorically in tertiles (using both the overall sample population tertiles and ethnic subgroup
tertiles). Meanwhile, the analyses were repeated after stratifying participants by sex. To test the robustness of the findings, possible individuals with type 1 DM (T1DM) were excluded
(defined as those aged <20 years who used only insulin) [34, 40] and sensitivity analyses were performed on a subgroup of participants with T2DM. Additionally, the analyses were repeated
after further adjustment for insulin use in the subgroup of participants with T2DM. Analyses were performed in RStudio for macOS (2022.02.0 + 443) using the R Package Survey (4.1–1). We used
appropriate NHANES weights to account for the complex survey design of NHANES. Baseline characteristics of the participants were expressed as medians with interquartile ranges (M (P25,
P75)) and means with standard deviations (mean (SD)) for continuous variables and as percentages (_n_ (%)) for categorical variables. The Mann–Whitney _U_-test and the Rao-Scott chi-square
test were used for continuous and categorical variables, respectively. Multivariable logistic regression analyses were performed to assess the associations between BMI, WHtR, and the A/G
ratio with the presence of DR, respectively, adjusted for potential confounding factors established in previous research. These variables included age, sex, ethnicity, diabetes duration,
HbA1c level, blood pressure level, and non-high-density lipoprotein cholesterol level. Multivariable linear regression analysis assessed the associations between diabetes duration and the
A/G ratio. A two-sided _P_ value of <0.05 was used to determine statistical significance. RESULTS STUDY POPULATION CHARACTERISTICS The study sample included 1517 participants, and the
estimated population size was 9,019,027 individuals. The study population contained 752 females (49.6%), and the median age (interquartile range) of the study participants was 52 (44, 57)
years. Table 1 reports the demographic and clinical characteristics of the participants stratified by presence/absence of DR. The prevalence of DR was 20.0% among the population with
diabetes included in the study. Compared with participants without DR, participants with DR were likely to have a longer duration of diabetes and a higher HbA1c level (both _P_ < 0.05).
ASSOCIATIONS OF BMI AND WHTR WITH DIABETIC RETINOPATHY WERE NOT EVIDENT Table 2 shows the associations between BMI, WHtR, and DR. BMI was analyzed as a continuous variable or categorical
variable using WHO standards and defined tertiles in ethnic subgroups. The associations between BMI and DR were not evident in multivariable adjustments, including sex, age, ethnicity,
diabetes duration, HbA1c level, blood pressure level, and non-high-density lipoprotein cholesterol level. Sex-stratified analyses found that females in the population with BMI (25.0–30.0
kg/m2) were less likely to have DR compared with females in the population with BMI <25.0 kg/m2 (OR, 0.447; 95% CI: 0.212–0.943). The sex-stratified analysis using the ethnic-specific
tertiles for BMI did not show similar significant results in females. Sex-stratified analyses failed to reveal any significant association between BMI and DR in males. In
multivariable-adjusted and sex-stratified models, continuous or categorical analysis of WHtR failed to reveal any significant associations for DR (all _P_ > 0.05). Analyses conducted on
the population with T2DM produced the same results as those with all diabetes (Table S1). HIGHER A/G RATIO EXERTS A PROTECTIVE EFFECT AGAINST DR For evaluating the contribution of fat
distribution to the risk of DR, the A/G ratio was categorized by tertiles, and multivariable logistic regression was performed (Table 3), adjusting sex, age, ethnicity, diabetes duration,
HbA1c level, blood pressure level, and non-HDL-C level. The prevalence of DR was 22.2, 21.2, and 17.6% among the populations with A/G ratio <1.0, 1.0–1.2, ≥1.2, respectively. The
prevalence of DR was 21.2, 21.6, and 17.8% among the populations in tertile one, tertile two, and tertile three, respectively, when using ethnic-specific tertiles. After adjusting for
several covariates, the population in the highest tertile of A/G ratio (≥1.2) were less likely to have DR (OR, 0.565; 95% CI: 0.372–0.858) compared with those in the middle A/G ratio tertile
(1.0–1.2). After further adjustment for BMI, the association between the A/G ratio and DR was unattenuated (OR, 0.567; 95% CI: 0.373–0.861). Moreover, the test for trend was significant
(_P_ for trend = 0.047). After adjusting WHtR, the association between the A/G ratio and DR persisted (OR, 0.586; 95% CI: 0.379–0.907), and the test for trend was significant (_P_ for trend
= 0.046). The analysis using the ethnic-specific tertiles for the A/G ratio, found that the individuals in the highest tertile of the A/G ratio were less likely to have DR (OR, 0.570; 95%
CI: 0.369–0.880) compared with those in the middle A/G ratio tertile. The associations persisted after further adjustment for BMI (OR, 0.573; 95% CI: 0.372–0.884) and WHtR (OR, 0.594; 95%
CI: 0.377–0.936). Moreover, analyses based on the population with T2DM yielded the same results as those with all diabetes (Table S2). In sex-stratified analyses (Fig. 2), compared to the
middle A/G ratio (1.0–1.2), a higher A/G ratio (≥1.2) was associated with lower odds of DR in males with diabetes (OR, 0.490; 95% CI: 0.291–0.824), but not in females. The associations
persisted after adjustment for BMI (OR, 0.495; 95% CI: 0.290–0.843) in males. Meanwhile, the associations remained after adjusting WHtR (OR, 0.523; 95% CI: 0.303–0.902) in males. The
sex-stratified analysis using the ethnic-specific tertiles for the A/G ratio found that the male individuals in the highest tertile of the A/G ratio were less likely to have DR (OR, 0.485;
95% CI, 0.280–0.840) compared with those in the middle A/G ratio tertile. The associations persisted after further adjustment for BMI (OR, 0.491; 95% CI: 0.281–0.858) and WHtR (OR, 0.520;
95% CI: 0.292–0.928). The sex-stratified analyses failed to reveal any significant associations for DR (all _P_ > 0.05) in female individuals. The studies based on the population with
T2DM found similar effective results as those with all diabetes (Table S3). Additionally, the associations remained significant after further adjustment for insulin use within the population
with T2DM (Table S4). THE A/G RATIO EXHIBITS A NEGATIVE CORRELATION WITH DIABETES DURATION Table 4 depicts the linear associations between fat depots and diabetes duration. After adjustment
for demographic factors, the coefficient for diabetes duration suggested that a per-10-year increase in DM was associated with a 0.018 decrease in the A/G ratio (_p_ = 0.004). Similar
inverse associations were observed after additional adjustments (Table 4; models 2 and 3). In sex-stratified analyses, a per-10-year increase in DM was associated with a 0.026 decrease in
the A/G ratio among the male population (_p_ = 0.005). The inverse relationship persisted after multivariable adjustments (Table 4; models 2 and 3). The association was non-significant in
the female population. DISCUSSION In this population-based cross-sectional study, we investigated the associations between body fat distribution, as assessed by DXA, and the prevalence of
DR. This study has presented new information that the higher A/G ratio is associated with a reduced likelihood of DR presence, independent of BMI and WHtR, although the A/G ratio-DR
association is attenuated in females. The results provided valuable insights by highlighting the associations between imaging-based body fat distribution and DR, even after accounting for
anthropometric obesity indicators, indicating that fat distribution may play an independent role in the pathophysiology of DR in the population with diabetes. The association between obesity
and DR has been a subject of debate for decades, with inconclusive evidence supporting the relationship between obesity indicators and DR. Studies have reported conflicting results, with
some indicating that obesity, measured by higher BMI, is a significant independent risk factor for developing DR [7,8,9,10], while others have reported it to be protective [11,12,13,14,15],
or have found no significant associations [16, 17] with DR. The associations between DR and WHtR were also inconsistent [19, 20]. To shed light on this relationship, the study evaluated the
impact of anthropometric obesity indicators (BMI and WHtR) and body fat distribution evaluated by DXA on the prevalence of DR in the population of 1517 participants with diabetes from the
NHANES. When analyzing BMI according to WHO standards, the results showed that overweight females with diabetes were less likely to have DR compared with females in the population with a BMI
<25 kg/m2 (OR, 0.447; 95% CI: 0.212–0.943). However, no similar result was found in female participants when using the ethnic-specific tertiles for BMI, and no significant association
between BMI and DR was found among males. Moreover, no significant association was found between WHtR and the prevalence of DR. Interestingly, the study revealed that a higher A/G ratio was
associated with lower DR prevalence, although the A/G ratio-DR association was attenuated in female participants. These associations persisted after adjusting for BMI and WHtR, suggesting
that BMI or WHtR may not accurately estimate the risk of DR. The findings presented robust associations in sensitivity analyses using the ethnic-specific tertile for the A/G ratio. The study
highlights the complexity of the relationship between obesity and DR and emphasizes the importance of considering other factors, such as body fat distribution, to better understand this
association. Android fat is the accumulation of adipose tissue around the trunk, while gynoid fat refers to the fat deposited in the subcutaneous depot of hips, thighs, and buttocks [21]. A
higher A/G ratio is typically associated with an android pattern of fat accumulation, characterized by increased visceral adipose tissue (VAT) around the trunk or decreased subcutaneous
adipose tissue (SAT) around the hips. Interestingly, subcutaneous fat, rather than VAT, has been reported to be associated with the site of inflammation onset in the elderly [32, 41].
Additionally, age-related telomere length shortening in SAT, not VAT, leads to an increase in senescent cell burden [41]. Given that individuals with DR are often older and that inflammation
plays a role in the pathogenesis of microvascular complications, it is plausible that gynoid fat may pose a higher risk of DR in the elderly when compared to android fat. However, it is
essential to acknowledge that the relationship between body fat distribution, inflammation, and aging is complex, and research is needed to fully understand their impact on DR risk.
Additionally, the current analyses of the A/G ratio in relation to the duration of DM revealed a significant association, indicating that a prolonged duration of DM was linked to a lower A/G
ratio in males. This finding suggests that diabetes may alter the pattern of fat deposition in males, likely through its impact on sex hormones. In males, lipoprotein lipase activity is
higher in abdominal adipose tissues, and testosterone inhibits its activity in femoral subcutaneous fat, resulting in the android physique typically observed in males. At least 25% of males
with T2DM have subnormal testosterone levels [42, 43], which may contribute to changes in fat distribution. Studies have shown that hypogonadal men have increased fatty acid storage in the
lower body subcutaneous area and higher activity of femoral adipose tissue acyl-CoA synthetase, indicating that chronic testosterone deficiency in males with diabetes may lead to fat
redistribution via adipocyte enzymes [44]. Moreover, previous research demonstrated that males with diabetes tend to have higher estradiol levels than non-diabetic counterparts [45,46,47].
Elevated estradiol and lower testosterone levels may contribute to the gynoid body morphology and decreasing A/G ratio observed in males with diabetes. Further investigations are necessary
to explore the role and mechanisms of hormone-mediated fat redistribution in males with diabetes, as the change in preferential fat accumulation in males may reflect the progression of DM
and be associated with DR. On the other hand, remarkable adipose redistribution following menopause in females might attenuate the association between the A/G ratio and the duration of DM.
Therefore, it is reasonable to understand that males with diabetes who have a higher A/G ratio are less likely to have DR, and direct measurement of regional fat may offer a more accurate
assessment of retinopathy risk. This study presents a groundbreaking finding, showing that the DXA-measured A/G ratio, a comprehensive index of regional body fat distribution, served as an
independent marker for DR. It is argued that relying solely on BMI or WHtR is insufficient to assess or manage the microvascular risk associated with increased adiposity in the population
with diabetes. Current analysis suggests that the fat deposition pattern index, A/G ratio, serves as an independent and superior discriminator compared to anthropometric obesity indices.
Based on the compelling evidence from the NHANES, this study strongly advocates for fat distribution to be considered as a vital sign in clinical practice. This study has several limitations
that should be acknowledged. First, due to the limited proportion of participants with T1DM, the findings primarily apply to the T2DM population. Second, the information on DR was extracted
from diabetes questionnaires. The methodology used in this study was aligned with previous studies [33,34,35,36] to ensure consistency and comparability. Third, being a cross-sectional
study, it is challenging to establish cause-and-effect relationships; nevertheless, the findings provide valuable insights for clinicians in managing diabetic complications. Fourth, it is
important to note that only the 2003–2006 cycles of NHANES administered DXA to participants aged 60 and older. Among 1 517 participants in the study population, 375 were aged 60 and above,
representing a weighted estimate of 1 470 182 individuals. The weighted calculations of the complex sampling strategy and the adjustment for age in multivariable logistic regression analysis
mitigate the impact on the representativity of the findings. On the positive side, a significant strength of this study is its representative sample size. NHANES provides generalizable data
on a multiethnic population that is nationally representative of the U.S. Moreover, the biochemical data and questionnaire responses were homogeneously collected by trained personnel,
enhancing the reliability of the study’s data collection process. CONCLUSION The novel finding of an association between higher A/G ratio and the presence of DR, independent of BMI and WHtR,
underscores the importance of fat distribution as a critical factor in DR. This study highlights that imaging-based fat distribution serves as a more clinically significant marker among
individuals with diabetes. Furthermore, it suggests that considering how fat is distributed in the body could be crucial in assessing the risk of retinopathy in the population with diabetes.
Further research is warranted to gain a deeper understanding of the mechanisms behind this relationship and its implications for diabetes management and risk assessment. DATA AVAILABILITY
Data described in the manuscript and analytic code will be made available upon request pending. REFERENCES * Sun H, Saeedi P, Karuranga S, Pinkepank M, Ogurtsova K, Duncan BB, et al. IDF
Diabetes Atlas: Global, regional and country-level diabetes prevalence estimates for 2021 and projections for 2045. Diabetes Res Clin Pract. 2022;183:109119. * Flaxman SR, Bourne RRA,
Resnikoff S, Ackland P, Braithwaite T, Cicinelli MV, et al. Global causes of blindness and distance vision impairment 1990-2020: a systematic review and meta-analysis. Lancet Glob Heal.
2017;5:e1221–34. Article Google Scholar * Bangal SV, Somasundaram VK, Misra NS. Blindness prevention through screening for diabetic retinopathy and glaucoma in rural population-a novel
approach. Int J Biomed Res. 2012;3:46–51. Article Google Scholar * Lascar N, Brown J, Pattison H, Barnett AH, Bailey CJ, Bellary S. Type 2 diabetes in adolescents and young adults. Lancet
Diabetes Endocrinol. 2018;6:69–80. Article PubMed Google Scholar * Stokes A, Collins JM, Grant BF, Scamuffa RF, Hsiao CW, Johnston SS, et al. Obesity progression between young adulthood
and midlife and incident diabetes: a retrospective cohort study of U.S. Adults. Diabetes Care. 2018;41:1025–31. Article PubMed PubMed Central Google Scholar * Maric-Bilkan C. Obesity and
diabetic kidney disease. Med Clin North Am. 2013;97:59–74. Article PubMed Google Scholar * Van Leiden HA, Dekker JM, Moll AC, Nijpels G, Heine RJ, Bouter LM, et al. Blood pressure,
lipids, and obesity are associated with retinopathy: the Hoorn Study. Diabetes Care. 2002;25:1320–5. Article PubMed Google Scholar * Henricsson M, Nyström L, Blohmé G, Östman J, Kullberg
C, Svensson M, et al. The incidence of retinopathy 10 years after diagnosis in young adult people with diabetes: results from the nationwide population-based Diabetes Incidence Study in
Sweden (DISS). Diabetes Care. 2003;26:349–54. Article PubMed Google Scholar * Lee ET, Keen H, Bennett PH, Fuller JH, Lu M. The appearance of retinopathy and progression to proliferative
retinopathy: the WHO multinational study of vascular disease in diabetes. Diabetologia. 2001;44:S22–30. * Zhang L, Krzentowski G, Albert A, Lefebvre PJ. Risk of developing retinopathy in
diabetes control and complications trial type 1 diabetic patients with good or poor metabolic control. Diabetes Care. 2001;24:1275–9. Article CAS PubMed Google Scholar * Man REK,
Sabanayagam C, Chiang PPC, Li LJ, Noonan JE, Wang JJ, et al. Differential association of generalized and abdominal obesity with diabetic retinopathy in Asian patients with type 2 diabetes.
JAMA Ophthalmol. 2016;134:251–7. Article PubMed Google Scholar * Tryggestad JB, Kelsey MM, Drews KL, Chernausek SD, Escaname EN, Isganaitis E, et al. Development and progression of
diabetic retinopathy in adolescents and young adults with type 2 diabetes: results From the TODAY study. Diabetes Care. 2021;45:1049–55. Google Scholar * Dowse GK, Humphrey ARG, Collins VR,
Plehwe W, Gareeboo H, Fareed D, et al. Prevalence and risk factors for diabetic retinopathy in the multiethnic population of Mauritius. Am J Epidemiol. 1998;147:448–57. Article CAS PubMed
Google Scholar * Chan JCY, Chee ML, Tan NYQ, Cheng CY, Wong TY, Sabanayagam C. Differential effect of body mass index on the incidence of diabetes and diabetic retinopathy in two Asian
populations. Nutr Diabetes. 2018;8:16. * Lim LS, Shyong Tai E, Mitchell P, Wang JJ, Tay WT, Lamoureux E, et al. C-reactive protein, body mass index, and diabetic retinopathy. Invest
Ophthalmol Vis Sci. 2010;51:4458–63. Article PubMed Google Scholar * Klein R, Klein BE, Moss SE. Is obesity related to microvascular and macrovascular complications in diabetes? The
Wisconsin Epidemiologic Study of Diabetic Retinopathy. Arch Intern Med. 1997;157:650–6. Article CAS PubMed Google Scholar * Van Leiden HA, Dekker JM, Moll AC, Nijpels G, Heine RJ, Bouter
LM, et al. Risk factors for incident retinopathy in a diabetic and nondiabetic population: the Hoorn study. Arch Ophthalmol. 2003;121:245–51. Article PubMed Google Scholar * Wong TY,
Klein R, Islam FMA, Cotch MF, Folsom AR, Klein BEK, et al. Diabetic retinopathy in a multi-ethnic cohort in the United States. Am J Ophthalmol. 2006;141:446–55. Article PubMed PubMed
Central Google Scholar * Jensen ET, Rigdon J, Rezaei KA, Saaddine J, Lundeen EA, Dabelea D, et al. Prevalence, progression, and modifiable risk factors for diabetic retinopathy in youth
and young adults with youth-onset type 1 and type 2 diabetes: the SEARCH for diabetes in youth study. Diabetes Care. 2023;46:1252–60. Article PubMed PubMed Central Google Scholar * Zhong
P, Tan S, Zhu Z, Zhu Z, Liang Y, Huang W, et al. Normal‐weight central obesity and risk of cardiovascular and microvascular events in adults with prediabetes or diabetes: Chinese and
British cohorts. Diabetes Metab Res Rev. 2023;39:e3707. * Palmer BF, Clegg DJ. The sexual dimorphism of obesity. Mol Cell Endocrinol 2015;402:113–9. Article CAS PubMed Google Scholar *
Després J-P. Body fat distribution and risk of cardiovascular disease: an update. Circulation 2012;126:1301–13. Article PubMed Google Scholar * Snijder MB, Visser M, Dekker JM, Goodpaster
BH, Harris TB, Kritchevsky SB, et al. Low subcutaneous thigh fat is a risk factor for unfavourable glucose and lipid levels, independently of high abdominal fat. The Health ABC Study.
Diabetologia. 2005;48:301–8. Article CAS PubMed Google Scholar * Wander PL, Boyko EJ, Leonetti DL, McNeely MJ, Kahn SE, Fujimoto WY. Change in visceral adiposity independently predicts a
greater risk of developing type 2 diabetes over 10 years in Japanese Americans. Diabetes Care. 2013;36:289–93. Article PubMed PubMed Central Google Scholar * Okosun IS, Seale JP, Lyn R.
Commingling effect of gynoid and android fat patterns on cardiometabolic dysregulation in normal weight American adults. Nutr Diabetes 2015;5:e155–e155. Article CAS PubMed PubMed Central
Google Scholar * Abraham TM, Pedley A, Massaro JM, Hoffmann U, Fox CS. Association between visceral and subcutaneous adipose depots and incident cardiovascular disease risk factors.
Circulation. 2015;132:1639. Article CAS PubMed PubMed Central Google Scholar * Brahimaj A, Rivadeneira F, Muka T, Sijbrands EJG, Franco OH, Dehghan A, et al. Novel metabolic indices and
incident type 2 diabetes among women and men: the Rotterdam Study. Diabetologia. 2019;62:1581–90. Article CAS PubMed PubMed Central Google Scholar * Aucouturier J, Meyer M, Thivel D,
Taillardat M, Duché P. Effect of android to gynoid fat ratio on insulin resistance in obese youth. Arch Pediatr Adolesc Med. 2009;163:826–31. Article PubMed Google Scholar * Ciardullo S,
Oltolini A, Cannistraci R, Muraca E, Perseghin G. Sex-related association of nonalcoholic fatty liver disease and liver fibrosis with body fat distribution in the general US population. Am J
Clin Nutr. 2022;115:1528–34. Article PubMed Google Scholar * Bouchi R, Nakano Y, Ohara N, Takeuchi T, Murakami M, Asakawa M, et al. Clinical relevance of dual-energy X-ray absorptiometry
(DXA) as a simultaneous evaluation of fatty liver disease and atherosclerosis in patients with type 2 diabetes. Cardiovasc Diabetol. 2016;15:64. Article PubMed PubMed Central Google
Scholar * Fukuda T, Bouchi R, Takeuchi T, Tsujimoto K, Minami I, Yoshimoto T, et al. Sarcopenic obesity assessed using dual energy X-ray absorptiometry (DXA) can predict cardiovascular
disease in patients with type 2 diabetes: a retrospective observational study. Cardiovasc Diabetol. 2018;17:1–12. Article Google Scholar * Lu Z, Tilly MJ, Aribas E, Bos D, Geurts S,
Stricker BH, et al. Imaging-based body fat depots and new-onset atrial fibrillation in general population: a prospective cohort study. BMC Med.
2022;20:317.https://pubmed.ncbi.nlm.nih.gov/36117169/ * Wang L, Li X, Wang Z, Bancks MP, Carnethon MR, Greenland P, et al. Trends in prevalence of diabetes and control of risk factors in
diabetes among US adults, 1999-2018. JAMA. 2021;326:704–16. Article Google Scholar * Wang S, Wang Y, Wan X, Guo J, Zhang Y, Tian M, et al. Cobalamin intake and related biomarkers:
examining associations with mortality risk among adults with type 2 diabetes in NHANES. Diabetes Care. 2022;45:276–84. Article CAS PubMed Google Scholar * Jiang W, Zhang J, Yang R, Sun
X, Wu H, Zhang J, et al. Association of urinary nitrate with diabetes complication and disease-specific mortality among adults with hyperglycemia. J Clin Endocrinol Metab. 2023;108:1318.
Article PubMed Google Scholar * Sun X-J, Zhang G-H, Guo C-M, Zhou Z-Y, Niu Y-L, Wang L, et al. Associations between psycho-behavioral risk factors and diabetic retinopathy: NHANES
(2005-2018). Front Public Health. 2022;10:966714. Article PubMed PubMed Central Google Scholar * Shepherd JA, Fan B, Lu Y, Wu XP, Wacker WK, Ergun DL, et al. A multinational study to
develop universal standardization of whole-body bone density and composition using GE healthcare lunar and hologic DXA systems. J Bone Min Res. 2012;27:2208–16. Article Google Scholar * Lu
W, Resnick HE, Jablonski KA, Jones KL, Jain AK, Howard WMJ, et al. Non-HDL cholesterol as a predictor of cardiovascular disease in type 2 diabetes: the strong heart study. Diabetes Care.
2003;26:16–23. Article PubMed Google Scholar * Peters AL. Clinical relevance of non-HDL cholesterol in patients with diabetes. Clin Diabetes. 2008;26:3–7. Article Google Scholar * Le P,
Chaitoff A, Misra-Hebert AD, Ye W, Herman WH, Rothberg MB. Use of antihyperglycemic medications in U.S. adults: an analysis of the National Health and Nutrition Examination Survey. Diabetes
Care. 2020;43:1227–33. Article PubMed Google Scholar * Palmer AK, Kirkland JL. Aging and adipose tissue: potential interventions for diabetes and regenerative medicine. Exp Gerontol.
2016;86:97. Article CAS PubMed PubMed Central Google Scholar * Dandona P, Dhindsa S. Update: hypogonadotropic hypogonadism in type 2 diabetes and obesity. J Clin Endocrinol Metab.
2011;96:2643–51. Article CAS PubMed PubMed Central Google Scholar * Malipatil NS, Yadegarfar G, Lunt M, Keevil B, Siddals K, Livingston M, et al. Male hypogonadism: 14‐year prospective
outcome in 550 men with type 2 diabetes. Endocrinol Diabetes Metab. 2019;2:e00064. * Santosa S, Jensen MD. Effects of male hypogonadism on regional adipose tissue fatty acid storage and
lipogenic proteins. PLoS ONE. 2012;7:e31473. Article CAS PubMed PubMed Central Google Scholar * Ding EL, Song Y, Malik VS, Liu S. Sex differences of endogenous sex hormones and risk of
type 2 diabetes. JAMA. 2006;295:1288. Article CAS PubMed Google Scholar * Colangelo LA, Ouyang P, Liu K, Kopp P, Golden SH, Dobs AS, et al. Association of endogenous sex hormones with
diabetes and impaired fasting glucose in men. Diabetes Care. 2009;32:1049–51. Article CAS PubMed PubMed Central Google Scholar * Vikan T, Schirmer H, Njølstad I, Svartberg J. Low
testosterone and sex hormone-binding globulin levels and high estradiol levels are independent predictors of type 2 diabetes in men. Eur J Endocrinol. 2010;162:747–54. Article CAS PubMed
Google Scholar Download references FUNDING Funding This study was supported by grants from the National Natural Science Foundation of China (Nos. 82271111, received by Zhi Zheng). The
sponsor or funding organization had no role in the design or conduct of this research. AUTHOR INFORMATION Author notes * These authors contributed equally: Chenxin Li, Yili Zhang, Yujie
Wang. AUTHORS AND AFFILIATIONS * Department of Ophthalmology, Shanghai General Hospital, Shanghai Jiao Tong University School of Medicine, National Clinical Research Center for Eye Diseases,
Shanghai Clinical Research Center for Eye Diseases, Shanghai Key Clinical Specialty, Shanghai Key Laboratory of Ocular Fundus Diseases, Shanghai Engineering Center for Visual Science and
Photomedicine, Shanghai Engineering Center for Precise Diagnosis and Treatment of Eye Diseases, Shanghai, 200080, China Chenxin Li, Yujie Wang, Chufeng Gu, Bo Li, Mingming Ma, Xiaoyin Xu
& Zhi Zheng * Department of Ophthalmology, Shanghai General Hospital, Shanghai, 200080, China Yili Zhang * Centre for Eye Research Australia, Royal Victorian Eye and Ear Hospital,
Melbourne, Australia Yujie Wang * Ophthalmology, Department of Surgery, University of Melbourne, Melbourne, Australia Yujie Wang * Department of Ophthalmology, Renji Hospital, Shanghai Jiao
Tong University School of Medicine, Shanghai, 200127, China Yongdong Chen * Ningde Municipal Hospital, Ningde Normal University, Ningde, China Zhi Zheng * Fujian Medical University, Fuzhou,
China Zhi Zheng Authors * Chenxin Li View author publications You can also search for this author inPubMed Google Scholar * Yili Zhang View author publications You can also search for this
author inPubMed Google Scholar * Yujie Wang View author publications You can also search for this author inPubMed Google Scholar * Chufeng Gu View author publications You can also search for
this author inPubMed Google Scholar * Bo Li View author publications You can also search for this author inPubMed Google Scholar * Mingming Ma View author publications You can also search
for this author inPubMed Google Scholar * Xiaoyin Xu View author publications You can also search for this author inPubMed Google Scholar * Yongdong Chen View author publications You can
also search for this author inPubMed Google Scholar * Zhi Zheng View author publications You can also search for this author inPubMed Google Scholar CONTRIBUTIONS ZZ and YC designed
research; CL, YZ, CG, and MM conducted research; CL, YW, and BL analyzed data; CL wrote the paper; CL and XX revised the manuscript. ZZ had primary responsibility for final content. All
authors read and approved the final manuscript. CORRESPONDING AUTHORS Correspondence to Xiaoyin Xu, Yongdong Chen or Zhi Zheng. ETHICS DECLARATIONS COMPETING INTERESTS The authors declare no
competing interests. ADDITIONAL INFORMATION PUBLISHER’S NOTE Springer Nature remains neutral with regard to jurisdictional claims in published maps and institutional affiliations.
SUPPLEMENTARY INFORMATION TABLE S1 TABLE S2 TABLE S3 TABLE S4 RIGHTS AND PERMISSIONS OPEN ACCESS This article is licensed under a Creative Commons Attribution 4.0 International License,
which permits use, sharing, adaptation, distribution and reproduction in any medium or format, as long as you give appropriate credit to the original author(s) and the source, provide a link
to the Creative Commons licence, and indicate if changes were made. The images or other third party material in this article are included in the article’s Creative Commons licence, unless
indicated otherwise in a credit line to the material. If material is not included in the article’s Creative Commons licence and your intended use is not permitted by statutory regulation or
exceeds the permitted use, you will need to obtain permission directly from the copyright holder. To view a copy of this licence, visit http://creativecommons.org/licenses/by/4.0/. Reprints
and permissions ABOUT THIS ARTICLE CITE THIS ARTICLE Li, C., Zhang, Y., Wang, Y. _et al._ Imaging-based body fat distribution and diabetic retinopathy in general US population with diabetes:
an NHANES analysis (2003–2006 and 2011–2018). _Nutr. Diabetes_ 14, 53 (2024). https://doi.org/10.1038/s41387-024-00308-z Download citation * Received: 02 November 2023 * Revised: 18 June
2024 * Accepted: 20 June 2024 * Published: 14 July 2024 * DOI: https://doi.org/10.1038/s41387-024-00308-z SHARE THIS ARTICLE Anyone you share the following link with will be able to read
this content: Get shareable link Sorry, a shareable link is not currently available for this article. Copy to clipboard Provided by the Springer Nature SharedIt content-sharing initiative