Hif-1 inactivation empowers hif-2 to drive hypoxia adaptation in aggressive forms of medulloblastoma
- Select a language for the TTS:
- UK English Female
- UK English Male
- US English Female
- US English Male
- Australian Female
- Australian Male
- Language selected: (auto detect) - EN
Play all audios:

ABSTRACT Medulloblastoma (MB) is the most prevalent brain cancer in children. Four subgroups of MB have been identified; of these, Group 3 is the most metastatic. Its genetics and biology
remain less clear than the other groups, and it has a poor prognosis and few effective treatments available. Tumor hypoxia and the resulting metabolism are known to be important in the
growth and survival of tumors but, to date, have been only minimally explored in MB. Here we show that Group 3 MB tumors do not depend on the canonical transcription factor hypoxia-inducible
factor-1α (HIF-1α) to mount an adaptive response to hypoxia. We discovered that HIF-1α is rendered inactive either through post-translational methylation, preventing its nuclear
localization specifically in Group 3 MB, or by a low expression that prevents modulation of HIF-target genes. Strikingly, we found that HIF-2 takes over the role of HIF-1 in the nucleus and
promotes the activation of hypoxia-dependent anabolic pathways. The exclusion of HIF-1 from the nucleus in Group 3 MB cells enhances the reliance on HIF-2’s transcriptional role, making it a
viable target for potential anticancer strategies. By combining pharmacological inhibition of HIF-2α with the use of metformin, a mitochondrial complex I inhibitor to block respiration, we
effectively induced Group 3 MB cell death, surpassing the effectiveness observed in Non-Group 3 MB cells. Overall, the unique dependence of MB cells, but not normal cells, on HIF-2-mediated
anabolic metabolism presents an appealing therapeutic opportunity for treating Group 3 MB patients with minimal toxicity. SIMILAR CONTENT BEING VIEWED BY OTHERS THE MITOCHONDRIAL NADH
SHUTTLE SYSTEM IS A TARGETABLE VULNERABILITY FOR GROUP 3 MEDULLOBLASTOMA IN A HYPOXIC MICROENVIRONMENT Article Open access 30 November 2023 THE HIF1Α/HIF2Α-MIR210-3P NETWORK REGULATES
GLIOBLASTOMA CELL PROLIFERATION, DEDIFFERENTIATION AND CHEMORESISTANCE THROUGH EGF UNDER HYPOXIC CONDITIONS Article Open access 18 November 2020 NDUFA4L2 PROMOTES GLIOBLASTOMA PROGRESSION,
IS ASSOCIATED WITH POOR SURVIVAL, AND CAN BE EFFECTIVELY TARGETED BY APATINIB Article Open access 07 April 2021 INTRODUCTION Medulloblastoma (MB) is a highly malignant brain tumor
predominantly affecting children and, to a lesser extent, adults [1]. It arises in the cerebellum, a vital region of the brain responsible for motor coordination and balance. MB accounts for
~20% of all pediatric brain tumors and is characterized by its aggressive nature and propensity for metastasis. One of the major breakthroughs in MB research was the classification of the
disease into four main molecular subgroups: WNT, SHH, Group 3, and Group 4. Each subgroup is characterized by specific genetic alterations, gene expression patterns, and signaling pathway
dysregulations, which influence tumor development, progression, and response to therapy [2,3,4,5]. Group 3 MB represents a significant subset with unique biological features and clinical
implications. Group 3 MB typically occurs in older children and has a higher propensity for metastasis and relapse compared to other subgroups. It poses a significant challenge in terms of
treatment and prognosis. Tumor hypoxia, a condition characterized by insufficient oxygen supply within the tumor microenvironment, is a hallmark feature of solid tumors [6, 7]. It arises due
to the rapid growth of tumors outpacing their blood supply, leading to regions of low oxygen tension. Hypoxia poses a significant challenge in cancer therapy as it fuels tumor
aggressiveness, therapeutic resistance, and poor clinical outcomes. Therefore, understanding the molecular mechanisms underlying tumor hypoxia has garnered considerable interest in cancer
research. Central to the cellular response to hypoxia are the hypoxia-inducible factors, HIF-1 and HIF-2, which act as master regulators of the hypoxic response [8]. HIF-1 and HIF-2 are
heterodimeric transcription factors composed of an oxygen-sensitive α-subunit and a constitutively expressed β-subunit. Under normoxic conditions, HIF-α subunits are hydroxylated by prolyl
hydroxylase enzymes, leading to their recognition by the von Hippel-Lindau tumor suppressor protein, subsequent ubiquitination, and proteasomal degradation. However, under hypoxic
conditions, the hydroxylation reaction is impaired, resulting in the stabilization and nuclear translocation of HIF-α subunits. HIF-α subunits then form a complex with HIF-β, bind to
hypoxia-responsive elements, and initiate the transcription of target genes involved in various aspects of tumorigenesis. While HIF-1 and HIF-2 share structural similarities and some common
target genes, emerging evidence suggests distinct roles and functions for each isoform in tumor biology [9]. HIF-1 is generally considered a master regulator of glycolytic metabolism,
angiogenesis, and survival pathways, promoting tumor adaptation to hypoxic conditions. On the other hand, HIF-2 exhibits a more tissue-specific expression pattern and has been implicated in
stemness maintenance, epithelial-mesenchymal transition, and metastasis. While the list of cancers associated with poor prognosis involving HIF-1 (hepatocellular carcinoma [10], breast [11,
12], cervical [13], colorectal [14], gastric [15], oropharyngeal [16], ovarian [17] and pancreatic [18] cancer) or HIF-1/HIF-2 (head and neck squamous carcinoma [19], colorectal [20, 21],
and lung [22] cancer) is extensive the array of cancers with poor prognostic implications primarily linked to HIF-2 alone is comparatively shorter. The best characterized are clear cell
renal cell carcinoma [23], neuroblastoma [24], and glioma [25]. MBs, like most solid cancers, are subject to continual oxygen variations and have had to develop numerous responses to survive
the hypoxic microenvironment [6, 26]. However, the relationship between MB and hypoxia is poorly known. As the four different subgroups of medulloblastomas are not similarly located in the
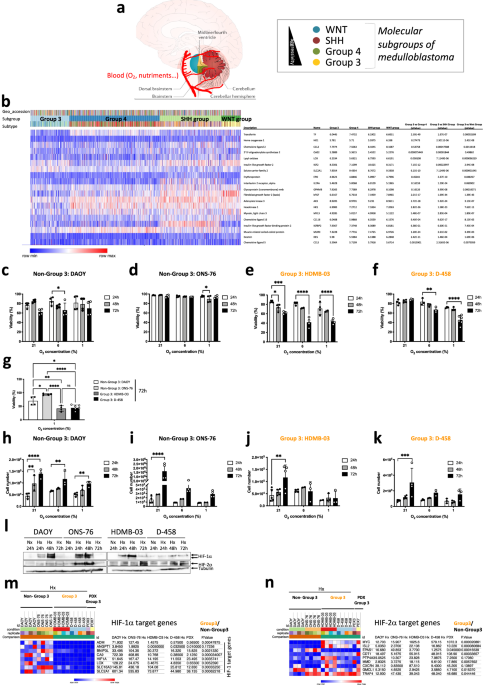
cerebellum and access to oxygen is different between the four groups of MB (Fig. 1a), the aim of the present study was to determine which was the main driver of the hypoxic response, HIF-1
or HIF-2. Here we show that Group 3 MB tumors do not depend on the canonical transcription factor hypoxia-inducible factor-1α (HIF-1α) to mount an adaptive response to hypoxia. We discovered
that HIF-1α is rendered inactive either through post-translational methylation, preventing its nuclear localization specifically in Group 3 MB, or by a low expression that prevents
modulation of HIF-target genes. The exclusion of HIF-1 from the nucleus in Group 3 MB cells enhances the reliance on HIF-2’s transcriptional role, making it a viable target for potential
anticancer strategies. Given the importance of HIFs in cancer biology, targeting HIF signaling pathways has rapidly emerged as a promising therapeutic strategy. Several classes of HIF
inhibitors have been investigated, including small molecules, peptides, and biologics [27,28,29]. To date, no specific HIF-1 inhibitor has been adopted for clinical use as these compounds
were too toxics. However, two compounds, PT2385 and PT2399 (belzutifan), have been characterized as potent and selective small-molecule inhibitors of HIF-2α and have shown promising results
in a phase III trial [30]. By combining pharmacological inhibition of HIF-2α with metformin, an inhibitor of complex I of the mitochondrial electron transport chain, we selectively disrupted
the metabolic pathways essential for cancer cell survival and proliferation in Group 3 MB. RESULTS GROUP 3 MB ARE SENSITIVE TO OXYGEN VARIATIONS AND DO NOT EXPRESS HIF-1 TARGET GENES
Medulloblastomas (MBs), like most solid cancers, are subject to continual oxygen variations and have had to develop numerous responses to survive the hypoxic microenvironment [6, 26]. The
relationship between MB and hypoxia is poorly known. The four different subgroups [2,3,4,5] of medulloblastomas are not similarly located in the cerebellum and access to oxygen is different
between the four groups of MB (Fig. 1a). To assess the impact that this oxygen heterogeneity might have on the different MB groups, we analyzed the expression of 19 HIF-1 target genes (_Tf,
Ho1_, _Ccl2_, _Oas2_, _Lox_, _Igf2_, _Slc2a1_, _Epo_, _Il2ra_, _Gpnmb_, _bFgf_, _Ak3_, _Hk1_, _Myl3_, _Cxcl16_, _Igfbp2_, _Murc_, _Des_ and _Ccl5_) from the Affymetrix Human Gene 1.1 ST
array profiling of 763 primary medulloblastoma samples (GSE85217) [31]. Group 4, SHH Group and Wnt Group MBs express these genes most strongly compared to Group 3 MB (Fig. 1b). From these
data and in order to understand the molecular mechanisms that govern these differences, we focused on the Group 3 MB, the group with a very poor prognosis, using HDMB-03 and D-458 cell
lines, and the Non-Group 3 MB, with an intermediate prognosis, using DAOY and ONS-76 cell lines. We cultured these cells in three different oxygen concentrations: 21% O2 (normoxia - Nx), in
which cells are regularly cultured, 6% O2 (physioxia - Phx), the conditions close to physiological conditions of the cerebellum, and 1% O2 (hypoxia - Hx), the conditions found in the tumor
microenvironment. We observed that Group 3 MB cells were more sensitive to low oxygen conditions, resulting in higher mortality and subsequently lower proliferation than Non-Group 3 MB cells
(Fig. 1c-k). However, all four cell lines expressed HIF-1α and HIF-2α in different profiles, proportions and kinetics (Fig. 1l). Analysis of the different target genes of HIF-1 (_Ca9_ and
_Mct4/SLC16A3_), HIF-1/HIF-2 (_Ca12_, _Glut1/SLC2A1_, _Ldha_), and HIF-2 (_Oct4/Pou5f1_), and non-target genes of HIFs (_Ldhb_ and _MCT1/SLC16A1_) showed that none of the target genes of
HIF-1 alone were expressed in Group 3 MB (Suppl. Fig. 1a–h). RNAseq analysis of the four cell lines in Nx _versus_ Hx and compared with two Group 3 PDX models, PDX3 and PDX7, confirmed that
these models were hierarchically close to the Group 3 cell lines (HDMB-03 and D-458) (Suppl. Fig. 1i). Analysis of genes specific to HIF-1α, HIF-2α and those that could be regulated by
either HIF-1α or HIF-2α showed very clearly that Non-Group 3 could induce HIF-1α-specific genes such as _Adm, Angpt1_, _Bnip3l_, _Ca9_, _Lox_, _Slc16a3_, and _Slc2a1_ while Group 3 MB as
well as the two PDX models representative of Group 3 were unable to (Fig. 1m). In contrast, we observed that HIF-2 specific genes (_MYC_, _Isl2_, _Cdt1_, _PTP4A3_, _MMD_, _Myc_, _Cxcr4_,
_GMCL1_ and _TRAF4_) were more regulated for in Group 3 MB or model (Fig. 1n). Similar results were found using the R2: Genomics analysis and visualization platform; significantly lower
expressions of _Angpt1_ and _EPO_ were detected in Group 3 MB cells than in Group 4 and/or SHH Group cells (Suppl. Fig. 2). In addition, HIF-2 target genes were shown to have higher
expression in Group 3 MB. Similarly, single cell meta data analysis (https://singlecell.broadinstitute.org/) by Manoranjan et al. [32] using primary patient-derived MB brain tumor-initiating
cell (BTIC) lines showed low expression of _Ca9_, _Lox, SLC16A3, ADM_ and _Angpt1_ in Group 3 MB in a context of high MYC expression compared to the other MB groups whereas _SLC2A1_,
_ldha_, _Mpzl1_ and _Oct4/Pou5f1_, _Icam4_, the HIF1/2 and HIF-2 target genes, respectively, were expressed in Group 3 MB (Suppl. Fig. 3). These data suggest that Group 3 MB cells have a
different response to hypoxia and may be due to HIF-1α inability to control its target genes. POST-TRANSLATIONAL MODIFICATIONS INACTIVATE HIF-1Α IN GROUP 3 MB Immunoblot analysis revealed
that HIF-1α from HDMB-03 cells systematically showed a higher molecular weight shift than typical, estimated at about 1 - 2 kDa, while HIF-1α from D-458 cells was mostly absent or otherwise
hardly visible (Fig. 2a). As HIF-1α in HDMB-03 was different from classical HIF-1α, we used another anti-HIF-1α antibody to confirm our identification of this transcription factor our
observation (Suppl. Fig. 4a). In addition, we verified that the detected bands correspond to HIF-1α using siRNAs (Suppl. Fig. 4b). To better characterize these two HIF-1α from Group 3 MB, we
first analyzed their kinetics of stabilization in Nx in the presence of MG132, a proteasome inhibitor (Suppl. Fig. 4c) as well as their stability after reoxygenation (Suppl. Fig. 4e, f). We
determined that MG132 exhibited weaker stabilization of HIF-1α from Group 3 MB compared to Non-Group 3 MB, and HIF-1α underwent very rapid degradation in D-458 cells. For HIF-1α in HDMB-03
cells, the band with the highest molecular weight appeared much more stable in Nx even after 10 min of reoxygenation, in contrast to the other cell lines. A 2D gel exploration was possible
allowing a finer analysis of HIF-1α in HDMB-03 compared to that in ONS-76. HIF-1α was first stabilized in hypoxia in the presence of Bafilomycin or MG132 or both compounds to block any
degradation during sample processing (Suppl. Fig. 4g). Bafilomycin did not stabilize HIF-1α in HDMB-03, suggesting a dysfunction in the mitochondrial uncoupling process [33], but the use of
MG132 in hypoxia increases the stabilization capacity of HIF-1α. Subcellular fractionation was performed on the lysis of both ONS-76 and HDMB-03 cells. Nuclear fractions containing the
protein of interest were subjected to 2D electrophoresis. The extracts were either analyzed by immunoblot with an anti-HIF-1α antibody or stained with Coomassie blue and sent to mass
spectrophotometry (MS). Under hypoxic conditions, the isoelectric point of the HIF-1α protein was observed at a more basic pH in HDMB-03 compared with ONS-76, strongly supporting a
post-translational modification (Fig. 2b). The presence of HIF-1α was confirmed by MS. HDMB-03 cells expressed 6.2 times less HIF-1α protein than ONS-76 (Fig. 2c). The presence of HIF-1β was
also characterized. Like HIF-1α, HIF-1β was 15 times less expressed in HDMB-03 cells than in ONS-76 cells, thereby preventing dimerization between the two partners and consequently
activation of the target genes. Moreover, we demonstrated that HIF-1α from Group 3 MB cells had little (D-458) or no (HDMB-03) presence in the nucleus (Fig. 2d-e), reinforcing the inability
of these cells to activate HIF-1 target genes. HIF-1 cDNA amplification and sequencing revealed no mutation that could explain the different HIF-1α profiles observed in these cells (Suppl.
Fig. 5). We thus focused on translational modifications. Phosphorylation of HIF-1α, creating a shift of several kDa and recognized by our specific antibody, is a central post-translational
modification, which regulates its stability under hypoxic conditions (Suppl. Fig. 6a). Overall, _Mekk_ (_Map3k1_) and _Erk2_ (_Mapk1_) mRNA expression showed no difference in Nx _versus_ Hx
for either cell line (Suppl. Fig. 6b–d). Only _Erk1_ (_Mapk3_) mRNA expression appeared to be induced under hypoxia in ONS-76 (Suppl. Fig. 6c). MEKK (MAP3K1) inhibition by U0126 did not
block the shift observed on HIF-1α in HDMB-03 in contrast to what we observed in ONS-76, suggesting that this shift is not an additional phosphorylation. Methylation is a post-translational
process that results in a 1–2 kDa increase in apparent molecular mass. Methylation can then lead to changes in intracellular distribution, generate protein instability and alter
protein-protein interactions [34]. It has been shown in vitro and in vivo that HIF-1α can be methylated by G9a/GLP in glioblastoma [35] (Suppl. Fig. 6f). We therefore hypothesized that
HIF-1α expressed in HDMB-03 cells could be methylated. _Ehmt2_ (_G9a_) mRNA expression showed no difference between cell lines or between Nx and Hx conditions (Suppl. Fig. 6g). On the other
hand, while _Ehmt1_ (_GPL_) mRNA expression was repressed in Hx in ONS-76, its expression remained unchanged in Hx in HDMB-03, which suggests a possible methylation by _Ehmt1_ (_GPL_)
(Suppl. Fig. 6h). Moreover, _Ruvbl2_ (_Reptin_) mRNA expression was less repressed in Hx in HDMB-03 cells compared with ONS-76 cells, potentially indicating a more effective suppression of
HIF-1α activity (Suppl. Fig. 6i). Using UNC0642, a small molecule inhibitor specific for EHMT2/1, we showed that demethylated HIF-1α regained its normal molecular weight (Suppl. Fig. 6j),
recovered its ability to accumulate in the nucleus (Fig. 2f), and to activate its target gene (_Ca9_) (Fig. 2g), strongly supporting that HIF-1α from the HDMB-03 could be methylated in Hx.
Oct4 expression was decreased, suggesting that HIF-2α may require methylation to be active while MCT1 expression was not affected by the presence of UNC0642. K32 and/or K391 methylation of
HIF-1α seemed not to be involved as PFI-2, a potent inhibitor of SETD7, did not improve HIF-1α stabilization (Suppl. Fig. 6k–n). To reinforce these findings, we compared the expression of
_Ehmt1_, _Ehmt2_ and _Ruvbl2_ in the Non-Group 3 and Group 3 MBs using the GSE85217 microarray of 763 MB patient tissues. Only _Ruvbl2_ was significantly more expressed in Group 3 MB. As
Group 3 had 3 subgroups (alpha, beta, gamma), we looked at the expression of these 3 genes according to the subgroups. It was in Group 3 gamma, the most aggressive group, that _Ehmt2_ and
_Ruvbl2_ genes were significantly more expressed. With the hypothesis that overexpression of EHMT2 and RUVBL2 would lead to methylation and/or transcriptional inactivity of HIF-1, we
compared the expression of HIF-1 target genes in the 3 subtypes. We found a lower expression of 14 HIF-1 target genes (_Cacna1s_, _Ccgng2_, _Ccng2_, _Cited2_, _Flt1p1_, _Hk2_, _Igfbp2_,
_Lox_, _Pkm1/2_, _Slc2a3_, _Sl2a1_, _Tgfb3_, _Tpi1_ and _Ttn_) that was more pronounced in Group 3 gamma, reinforcing the potential involvement of the EHMT1/2/RUVBL2 pathway in the control
of HIF-1 (Suppl. Fig. 7). The genes thus impacted are particularly involved in cellular metabolism (Suppl. Fig. 7c). We then investigated the reason of the absence of HIF-1α in D-458 by
studying the full process of stabilization of the protein under hypoxic conditions. pVHL binds and degrades HIF-1α only when HIF-1α is hydroxylated by the prolyl hydroxylases (PHDs) in the
presence of oxygen (Suppl. Fig. 8a). In the absence of oxygen, the PHDs are inhibited, allowing stabilization of HIF-1α. However, a feedback loop is established and _phd_s will certainly be
induced to ensure rapid degradation under reoxygenation. An increase in the quantity of PHDs could also counteract their low activity. Autoregulation in hypoxia occurs through increased
expression of the genes _phd2_ and _phd3_, but not _phd1_ since these genes are themselves HIF-targets [36]. Non-Group 3 cells showed consistent regulation of expression of all three _phds_,
in contrast to Group 3 cells (Suppl. Fig. 8b–d). _phd1_ expression, already high in Nx, was not modulated in hypoxia in D-458 cells. _Phd2_ was not modulated in Hx in D-458 cells and _phd3_
was non-existent in both Group 3 MB cell lines. We also checked if _Vhl_ had mutations in the different lineages, but we did not find any mutation (data not shown) and the expression of
_Vhl_ mRNA did not show any discordance between Groups (Suppl. Fig. 8e). However, while DAOY, ONS-76 and HDMB-03 cells showed statistically lower proteosomal activity in Hx, D-458 cells
showed a higher trend under these same conditions (Suppl. Fig. 8f, g). Finally, since acetylation of K532 by the acetyltransferase ARD1 promotes interaction with pVHL and thus degradation of
HIF-1α in the proteasome, we checked _Ard1_ (_Naa10_) mRNA expression. While _Ard1_ expression was repressed in Hx in DAOY, ONS-76 and HDMB-03 cells, again, we found that ARD1 expression,
already very high in Nx, was not altered in Hx in D-458 cells (Fig. 2h). However, invalidation of _Ard1_ by siRNA did not stabilize HIF-1α (data not shown). Interestingly, significantly
higher expressions of _Egln1, Egln3_ and _Naa10_ were detected in Group 3 MB than in the Non-Group 3 using the R2: Genomics analysis and visualization platform (Suppl. Fig. 8h, i). Egln3 and
Egln1 mRNA expression were also found to be significantly upregulated using the GSE85217 microarray (Suppl. Fig. 8k). Taken together, these results strongly suggest that Group 3 MB cells
have nonfunctional HIF-1 resulting from post-translational modifications of HIF-1α, methylation in the HDMB-03 cells and high destabilization in D-458 cells, and thus that the response of
Group 3 MB cells to the hypoxic microenvironment relies essentially on HIF-2. PT2385 SENSITIZES GROUP 3 MB TO CELL DEATH IN VITRO AND DECREASES GLYCOLYSIS We then considered that the use of
an HIF-2α inhibitor could specifically target the metabolism of Group 3 MB. We chose PT2385, one of the first specific HIF-2α inhibitors identified, currently used in clinical trials for
kidney cancer and glioblastoma. The lowest concentration of PT2385 (1 µM) decreased viability specifically in Group 3 MB (Fig. 3a). As expected, in Hx (Fig. 3b-c) and Phx (data not shown),
PT2385 reduced glycolytic capacity by 35.3% and 38.2% in HDMB-03 and D-458 cells, respectively, in somewhat similar proportions to those observed with 2-DG used as a control (Suppl. Fig.
9a). The repressive effect of PT2385 was not observed in Nx, in which HDMB-03 showed even better glycolytic and respiratory capacities with PT2385 (Suppl. Fig. 10). No deleterious effect was
observed in Non-Group 3 MB (Fig. 3d-e). Finally, PT2385 had no effect on respiration in Hx in either Group 3 MB (Fig. 3f, g) or Non-Group 3 MB (Fig. 3h, i). It may, however, have increased
breathing capacity in Nx, as observed in HDMB-03 (Suppl. Fig. 10). To completely collapse the energy intake of the Group 3 MB, we explored blocking the respiration with Metformin (Metf), a
well-known inhibitor of the complex 1 of the respiratory chain and oxygen consumption. Metf clearly decreased the proliferation of all cells in Hx while specifically targeting only Group 3
MB viability both in Phx and Hx (Fig. 3j-k). The addition of Metf did block respiration in Group 3 MB cells but only partially decreased respiration in Non-Group 3 MB cells (Suppl. Fig. 9b).
A mirror effect on glycolysis was observed, as Metformin increased glycolysis overall in Group 3 MB to compensate for the lack of energy due to the blockage of respiration but this
compensatory effect was barely observed in the Non-Group 3 MB (Suppl. Fig. 9). It appears that the significant biological effects of PT2385 and Metf together is limited to Group 3 MB
suggesting that their combination could be of therapeutical interest. PT2385/METF COMBINATION DECREASES GROUP 3 MB CELL VIABILITY AND INDUCES MAJOR METABOLIC MODIFICATIONS We thus looked at
the impact of these compounds, alone or in combination, on the stabilization of HIF-1/2α. PT2385 alone slightly decreased the stabilization of HIF-2α only in D-458 cells without affecting
HIF-1α stabilization (Suppl. Fig. 11a). However, the combination of the two compounds strongly affected HIF-1α and HIF-2α stability (Suppl. Fig. 11b). This resulted in decreased expression
of the genes _Ca9_, _Ca12_, _Glut1_, and _Ldha_ (Suppl. Fig. 11c–g) but not of _Ldhb_ (Suppl. Fig. 11h). Subsequently, dual PT2385 and Metformin treatment clearly decreased proliferation in
all cell lines (Suppl. Fig. 12a, b) and decreased viability in particular in Group 3 MB in Phx and Hx (Fig. 4a, b). SiRNAs directed against HIF-1α in the presence of PT2385 had no effect on
cell viability in the Group 3 MB, whereas nearly 40% of the cells in the Non-Group 3 MB died, unable to depend on any HIF-α sub-unit (Fig. 4c). In addition, siRNA directed against HIF-2α
showed no effect on cell viability in the Non-Group 3 MB, whereas it slightly reinforced the action of PT2385/Metf in the Group 3 MB. Glycolysis as well as respiration were entirely
collapsed in Group 3 MB but only partially in Non-Group 3 MB (Suppl. Fig. 12c–j). Multivariate analysis of metabolomic profiling of ONS-76, HDMB-03 and D-458 untreated or treated with
PT2385, Metf or both in Hx, using principal component analysis (Fig. 4d, e) and hierarchical clustering (Fig. 4g–i and Suppl. Fig. 13a–f) revealed common or different profiles depending on
the treatments used. We highlighted clear changes in metabolites related to polyamine pathways and purine and pyrimidine synthesis in the presence of PT2385 alone in Group 3 MB compared to
ONS-76 (Suppl. Fig. 13g). Similar changes were observed with Metf but with a stronger impact than PT2385 suggesting an interesting yet unexploited role for Metf in MB (Suppl. Fig. 13h). In
addition, the tryptophan synthesis pathway was decreased (Fig. 4j). Interestingly, the use of the combination had a real additive effect blocking more strongly the four metabolic pathways
previously described (Fig. 4j and Suppl. Fig. 13g, h). Together, these results strongly suggest that the combination of PT2385 and Metf would (i) simultaneously block glycolysis and
respiration in the Group 3 MB, (ii) act directly on nucleotide synthesis and (iii) interfere with multiple metabolic pathways. These different actions represent a promising therapeutic
approach. BLOCKING HIF-2 PATHWAY IN COMBINATION WITH METF INDUCES APOPTOSIS OF GROUP 3 TUMOR ORGANOIDS Finally, we sought to validate the drug responses identified in 2D on an
organoid-derived model of human Group 3 MB in which cancer cells are GFP/Venus positive [37]. Human Group 3 MB organoids were generated with MYC and Otx2 overexpression, to recapitulate the
gene alteration/expression of Group 3 MB patients. qPCR confirmed that these organoids expressed both HIF-2 (_OCT4_, _CXCR4_ and _CCND1_) and HIF-1 (_MCT4_) target genes. Table 1 presents
the Ct and ΔCt values for these genes, with all _Ct_ values ranging between 21 and 28. This indicates that the genes are expressed at reasonable levels and are thus likely impacted by
PT2385. We examined the effects of the two drugs, PT2385 and Metf, alone and in combination. The organoids were maintained for 11 days and treated every 4 days with the different compounds.
We observed significant antitumor activity of Metf and PT2385+Metf at day 4 (Suppl. Fig. 14a, b). Venus fluorescence disappeared almost completely by day 11, showing a nearly total
disappearance of the tumor cells with the combination. However, the effect of PT2385 seemed weaker, its anti-tumoral action appearing later (D8). Confocal image stacks of the tumoral Venus
cells were reconstructed to 3D isosurfaces (Imaris) (Fig. 4k). The volume (Fig. 4l), and area (Fig. 4m) showed significant decreases compared to the control. Finally, control cells showed
less cleaved caspase 3 staining than cells in the presence of the different treatments (Suppl. Fig. 14c). Super imposition of images double stained with green (Venus) and red (cleaved
caspase 3) fluophores showed that tumor cells expressed both proteins, strongly suggesting that cells died of apoptosis in the presence of the combination but also in the presence of the
compounds alone. These findings suggest that the drug responses observed in vitro can be recapitulated when assayed in an in vitro-cultured three-dimensional structures context with the
human Group 3 MB tumor organoids. DISCUSSION Here we show for the first time that cell lines belonging to Group 3 MB, the most aggressive and metastatic group, exhibit post-translational
modifications of HIF-1α that lead to functional inactivation of HIF-1. The HIF-2 isoform is then the only one left to respond to different oxygen variations. This makes it interesting to
compare Group 3 MB with ccRCCs expressing only HIF-2, a particular type of aggressive kidney cancer. The activity of HIF-1α, rather antitumorigenic in this specific cancer, is strongly
decreased due to chromosomal deletions [38] or HAF activity [39] leaving HIF-2 to fully exert its pro-tumor activity. The dichotomy between HIF-1 and HIF-2 observed in ccRCCs was until now
unique in the tumor field. What about medulloblastomas and especially Group 3 MB? In the Non-Group 3, the presence of a functional HIF-1 coupled to HIF-2 seems to protect the tumor cells
from cell death and none of the tested treatments seemed to affect them. However, what our results suggest is more that HIF-1 introduces a survival capacity in a hostile environment like
hypoxia. Therefore, the absence of HIF-1α would not appear to benefit the tumor cell. However, HIF-1 acting alone does in fact give the cell an advantage. Group 3 MB has been characterized
by high expression of the MYC oncogene that enables rapid and aggressive tumor development [40]. HIF-2α is a formidable promoter of MYC activity while HIF-1α tends to inhibit it. Moreover,
MYC has been shown to regulate the HIF-2α expression [41]. Pei et al. showed that MYC overexpression in stem cells had strong morphological homologies and expression profiles comparable to
those of Group 3 cells [40]. Their studies suggest that MYC overexpression is a major oncogenic event for Group 3 MB: it induces tumorigenesis and then allows its maintenance and
progression. However, HIF-2 is a formidable player in maintaining stem cells in an undifferentiated state _via_ genes like _Oct4_, _Sox_ and _Nanog_ [42, 43]. In physioxia or hypoxia where
Oct4 would be induced, the cells would then have a strong stem cell potential even though these cells would be “adult”. Since hypoxia occurs as early as the embryonic state [44], we can
propose that HIF-2 may be the primary origin of oncogenic evolution of Group 3 MB. If the uniqueness of HIF-2 is an extraordinary advantage for the Group 3 MB tumor cell, then it becomes a
perfect target to block MB tumor growth. We used PT2385, which is in phase II for ccRCC (https://clinicaltrials.gov/ct2/show/NCT03108066) but also for glioblastoma
(https://clinicaltrials.gov/ct2/show/NCT03216499). Very promising results have been obtained, suggesting similar results would be possible for Group 3 MB patients. Other more efficient
inhibitors identified recently, such as PT2399 or PT2977, could certainly provide stronger therapeutic responses. HIF-2 inhibition could then not only partially block metabolism but also
affect particular stem cells. This approach might also influence stem cells in younger patients, particularly those with medulloblastoma. However, unlike ccRCC, it was the combination of
PT2385 with Metf that had a very strong impact on cell growth and death. Here we have proven the concept that the best targeted therapy comes from a better molecular knowledge. It seems
clear that this “hypoxic” approach will reveal other potential therapeutic targets and allow new drug combinations to be found, to provide the most specific and personalized therapeutic
response possible. STAR METHODS CELL CULTURE DAOY (from ATCC - HTB-186TM) and ONS-76 (from Dr. F. Di Cunto (University of Torino - Italy)) cells were grown in Dulbecco’s Modified Eagle’s
Medium (DMEM) (Gibco-BRL, Courtaboeuf, France) supplemented with 10% fetal bovine serum with penicillin G (50 U/mL) and streptomycin sulfate (50 g/mL) whereas HDMB-03 (from DSMZ - ACC740)
and D-458 cells, provided by Dr. C. Pouponnot (Institut Curie - France), were grown with the same medium supplemented with 20% fetal bovine serum. A BugBok workstation (Ruskinn Technology
Biotrace International Plc, The Science Park Bridgend, UK) set at 6% oxygen, 94% nitrogen and 5% carbon dioxide was used for physioxic conditions. A Whitley H35 hypoxystation anaerobic
workstation (Don Whitley Scientific, West Yorkshire, UK) set at 1% oxygen, 94% nitrogen and 5% carbon dioxide were used for hypoxic conditions. PATIENT-DERIVED XENOGRAFTS MB patient-derived
xenograft (PDX) models were developed from primary tumor samples of previously untreated patients, implanted into the neck fat pad of Nude mice [45]. In all cases, primary human brain tumor
specimens were obtained under written informed consent approved by the Internal Review Board of the Necker Sick Children’s Hospital, Paris, France. The protocol also complied with
internationally established 3 R principles, in accordance with the UKCCCR guidelines. Once established, PDX models were maintained by serial passages in Nude mice. PDX3 and PDX7 correspond
to IC-MB-PDX-1 and ICN-MB-PDX-7 respectively. PHARMACOLOGICAL INHIBITORS AND CHEMICALS Cells were incubated with 10 mM Metformin (Metf) to block mitochondrial Complex I, 2-DG (10 mM) to
block glycolysis and PT2385 (1- and 10 mM) to inhibit HIF-2α activity. Rotenone, antimycin A, oligomycin, and 2,4-Dinitrophenol (DNP) were from Sigma, (St. Louis, MI, USA). RNA INTERFERENCE
The 21-nucleotide RNAs were chemically synthesized (Eurogentec, Seraing, Belgium) and previously described [46]. The siRNA sequences, all validated, were as follows: siCtl (forward)
5’-CCU-ACA-UCC-CGA-UCG-AUG-AUG-TT-3’, siHIF-1α (forward) 5’- CUG-AUG-ACC-AGC-AAC-UUGATT- 3’, siHIF-2α (forward) 5’- CAG-CAU-CUU-UGA-UAG-CAG-UTT-3’. PCR ANALYSIS Total RNA was extracted with
the RNeasy Mini Kit (QIAGEN, Hilden, Germany). The amount of RNA was evaluated with a NanoDrop™ spectrophotometer (ThermoFisher Scientific, Waltham, MA USA). One μg of total RNA was used for
reverse transcription, using the QuantiTect Reverse Transcription kit (QIAGEN, Hilden, Germany), with oligo (dT)15 to prime first-strand synthesis. Full-length HIF-1α cDNAs of ~ 3.5 kb were
amplified by RT-PCR different primers shown in Suppl. Fig. 4a. The HIF-1α cDNAs were amplified and sequenced. QUANTITATIVE REAL-TIME PCR ANALYSIS Total RNA was extracted with the RNeasy
Mini Kit (QIAGEN, Hilden, Germany). The amount of RNA was evaluated with a NanoDrop™ spectrophotometer (ThermoFisher Scientific, Waltham, MA USA). One μg of total RNA was used for reverse
transcription, using the QuantiTect Reverse Transcription kit (QIAGEN, Hilden, Germany), with oligo (dT)15 to prime first-strand synthesis. SYBR master mix plus (Eurogentec, Liege, Belgium)
and specific oligonucleotides (Sigma Aldrich) were used for qPCR. Primer sequences used were: _Ca9_ (forward: 5’-CCGAGCGACGCAGCCTTTGA -3’; reverse: 5’- GGCTCCAGTCTCGGCTACCT- 3’), Ca12
(forward: 5’-CTGCCAGCAACAAGTCAG-3’; reverse: 5’- ATATTCAGCGGTCCTCTC-3’), _Glut1_ (forward: 5’-CTTCACTGTCGTGTCGCTGT -3’; reverse: 5’-TGAAGAGTTCAGCCACGATG-3’), _Oct4_ (forward:
5’-TGGAGTTTGTGCCAGGGTTT-3’; reverse: 5’-CTGTGTCCCAGGCTTCTTT-3’), _Ldha_ (forward: 5’-AGCCCGATTCCGTTACCT-3’; reverse: 5’-CACCAGCAACATTCATTCCA-3’), _Ldhb_ (forward: 5’-GATGGATTTTGGGGGAACAT-3’;
reverse: 5’-AACACCTGCCACATTCACAC-3’), _Mct4_ (forward: 5’-ATTGGCCTGGTGCTGCTGATG-3’; reverse: 5’-CGAGTCTGCAGGAGGCTTGTG-3’); _Mct1_ (forward: 5’-CACCGTACAGCAACTATACG-3’; reverse:
5’-CAATGGTCGCCTCTTGTAGA-3’) and 36B4 (forward: 5’-TGCATCAGTACCCCATTCTATCAT-3’; reverse: 5’-AGGCAGATGGATCAGCCAAGA-3’). RESPIROMETRY AND EXTRACELLULAR ACIDIFICATION The cellular oxygen
consumption rate (OCR) and extracellular acidification rate (ECAR) were obtained using a Seahorse XF24 extracellular flux analyzer from Seahorse Bioscience (North Billerica, MA, USA).
Experiments were performed according to the manufacturer’s instructions. OCR and ECAR were measured in real time in normoxia, physioxia or hypoxia. 40,000 cells were deprived of glucose for
1 h, then glucose (G–10 mM), oligomycin (O–1 µM), 2,4-Dinitrophenol (DNP–100 µM), and Rotenone + Antimycin A (R/A–1 µM) were injected at the indicated times. GLUCOSE AND LACTATE MEASUREMENTS
The Glucose and lactate concentrations in the supernatant of cells incubated in Hx for 72 h was determined by YSI Biochemistry Analyzer. Each condition was determined for 100,000 cells to
express the Glucose/Lactate concentration as g/L per 100,00 cells. IMMUNOBLOTTING Cells were lysed in 1.5 x SDS buffer and the protein concentration determined using the BCA assay. 40 µg of
protein from whole cell extracts were resolved by SDS-PAGE and transferred onto a PVDF membrane (Millipore, Molsheim, France). Membranes were blocked in 5% non-fat milk in TN buffer
(50mMTris-HClpH7.4, 150 mMNaCl) and incubated in the presence of the primary and then secondary antibodies in 5% non-fat milk in TN buffer. Rabbit polyclonal anti-HIF-1α antibody (antiserum
2087) was produced and characterized in our laboratory [47]. The antibody against HIF-2α (NB100-122) was purchased from Novus Biologicals (Littleton, CA). ECL signals were normalized to
either β-tubulin or HSP90. After washing in TN buffer containing 1% Triton-X100 and then in TN buffer, immunoreactive bands were visualized with the ECL system (Amersham Biosciences,
Buckinghamshire, UK). IMMUNOCYTOCHEMISTRY Cells were fixed in 3% paraformaldehyde and extracted with Triton X-100. Primary antibodies included rabbit anti-HIF-1α [47] (1:400). Alexa Fluor
594- and 488-conjugated secondary anti-rabbit antibodies (Molecular Probes, Carlsbad, CA, USA) were used at 1:400. Cells were visualized by wide-field, fluorescence microscopy using a
DM5500B upright stand (Leica, Wetzlar, Germany) with a 40 x oil objective NA 1.00. The cubes used were A4 (excitation filter BP 360/40, dichroic mirror 400, emission filter BP 470/40), L5
(BP 480/40, 05, BP 527/30), and TX2 (BP 560/40, 595, BP645/75). Acquisitions were done with an Orca-ER camera (Hamamatsu, Hamamatsu, Japan). Cells were also visualized using the confocal
microscope, Nikon A1R inverted stand (Nikon, Tokyo, Japan). Objectives 10 x dry NA 0.3 and/or 40 x oil 1.3 NA and/or 60 x oil 1.4 NA were used. The lasers used were 405 nm, and/or 488 nm,
and/or 561 nm. The microscope was equipped with an automated xy stage for mosaic acquisitions. SINGLE CELL DATA AVAILABILITY The RNA-Seq data discussed in B. Manoranjan’s publication [48]
have been deposited in NCBI’s Gene Expression Omnibus and are accessible through GEO Series accession number GSE131473. The scRNA-seq data have been deposited in CReSCENT
(https://crescent.cloud/; CRES-P22) and processed data is uploaded on the Broad Institute Single Cell Portal https://singlecell.broadinstitute.org/single_cell/study/SCP840. DATA SOURCES
Primary medulloblastoma RNA-seq data were obtained from the ‘R2: Genomics Analysis and Visualization Platform (http://r2.amc.nl)’ in the data set ‘Tumor Medulloblastoma - Pfister - 223 -
MAS5.0—u133p2’. Affymetrix Human Gene 1.1 ST Array profiling of 763 primary medulloblastoma samples used for identification of Medulloblastoma subtypes [31]. STATISTICS Statistical analysis
of all data was performed using GraphPad Prism software, version 9.0 (GraphPad Software, La Jolla, CA, USA) and expressed as means ± S.E.M. For multiple comparisons, two-way ANOVA (post hoc
Bonferroni) was done. The _p_-values are indicated (*_p_ < 0.05, **_p_ < 0.005, ***_p_ < 0.0005, ****_p_ < 0.0001) and _p_-values between 0.05 and 0.10 indicated a statistical
tendency. REFERENCES * Packer RJ, Goldwein J, Nicholson HS, Vezina LG, Allen JC, Ris MD, et al. Treatment of children with medulloblastomas with reduced-dose craniospinal radiation therapy
and adjuvant chemotherapy: a children’s cancer group study. J Clin Oncol. 1999;17:2127–36. Article CAS PubMed Google Scholar * Northcott PA, Buchhalter I, Morrissy AS, Hovestadt V,
Weischenfeldt J, Ehrenberger T, et al. The whole-genome landscape of medulloblastoma subtypes. Nature. 2017;547:311–7. Article CAS PubMed PubMed Central Google Scholar * Northcott PA,
Jones DT, Kool M, Robinson GW, Gilbertson RJ, Cho YJ, et al. Medulloblastomics: the end of the beginning. Nat Rev Cancer. 2012;12:818–34. Article CAS PubMed PubMed Central Google Scholar
* Northcott PA, Shih DJ, Remke M, Cho YJ, Kool M, Hawkins C, et al. Rapid, reliable, and reproducible molecular sub-grouping of clinical medulloblastoma samples. Acta Neuropathol.
2012;123:615–26. Article CAS PubMed Google Scholar * Taylor MD, Northcott PA, Korshunov A, Remke M, Cho YJ, Clifford SC, et al. Molecular subgroups of medulloblastoma: the current
consensus. Acta Neuropathol. 2012;123:465–72. Article CAS PubMed Google Scholar * Pouyssegur J, Dayan F, Mazure NM. Hypoxia signalling in cancer and approaches to enforce tumour
regression. Nature. 2006;441:437–43. Article CAS PubMed Google Scholar * Brahimi-Horn M, Laferrière J, Mazure N & Pouysségur, J. Tumor angiogenesis. In: Marmé D & Fusenig N,
editors. Springer; 2007. pp. 171–94. * Mazure NM, Brahimi-Horn MC, Berta MA, Benizri E, Bilton RL, Dayan F, et al. HIF-1: master and commander of the hypoxic world. A pharmacological
approach to its regulation by siRNAs. Biochem Pharmacol. 2004;68:971–80. Article CAS PubMed Google Scholar * Keith B, Johnson RS, Simon MC. HIF1alpha and HIF2alpha: sibling rivalry in
hypoxic tumour growth and progression. Nature Rev Cancer. 2012;12:9–22. Article CAS Google Scholar * Deng F, Chen D, Wei X, Lu S, Luo X, He J, et al. Development and validation of a
prognostic classifier based on HIF-1 signaling for hepatocellular carcinoma. Aging (Albany NY). 2020;12:3431–50. Article CAS PubMed Google Scholar * Jogi A, Ehinger A, Hartman L, Alkner
S. Expression of HIF-1alpha is related to a poor prognosis and tamoxifen resistance in contralateral breast cancer. PLoS One. 2019;14:e0226150. Article PubMed PubMed Central Google
Scholar * Generali D, Berruti A, Brizzi MP, Campo L, Bonardi S, Wigfield S, et al. Hypoxia-inducible factor-1alpha expression predicts a poor response to primary chemoendocrine therapy and
disease-free survival in primary human breast cancer. Clin Cancer Res. 2006;12:4562–8. Article CAS PubMed Google Scholar * Birner P, Schindl M, Obermair A, Plank C, Breitenecker G,
Oberhuber G. Overexpression of hypoxia-inducible factor 1alpha is a marker for an unfavorable prognosis in early-stage invasive cervical cancer. Cancer Res. 2000;60:4693–6. CAS PubMed
Google Scholar * Baba Y, Nosho K, Shima K, Irahara N, Chan AT, Meyerhardt JA, et al. HIF1A overexpression is associated with poor prognosis in a cohort of 731 colorectal cancers. Am J
Pathol. 2010;176:2292–301. Article CAS PubMed PubMed Central Google Scholar * Li M, Li G, Yang X, Yin W, Lv G & Wang S. HIF in gastric cancer: regulation and therapeutic target.
Molecules 2022;27:4893. * Aebersold DM, Burri P, Beer KT, Laissue J, Djonov V, Greiner RH, et al. Expression of hypoxia-inducible factor-1alpha: a novel predictive and prognostic parameter
in the radiotherapy of oropharyngeal cancer. Cancer Res. 2001;61:2911–6. CAS PubMed Google Scholar * Daponte A, Ioannou M, Mylonis I, Simos G, Minas M, Messinis IE, et al. Prognostic
significance of hypoxia-inducible factor 1 alpha(HIF-1 alpha) expression in serous ovarian cancer: an immunohistochemical study. BMC Cancer. 2008;8:335. Article PubMed PubMed Central
Google Scholar * Ye LY, Zhang Q, Bai XL, Pankaj P, Hu QD, Liang TB. Hypoxia-inducible factor 1alpha expression and its clinical significance in pancreatic cancer: a meta-analysis.
Pancreatology. 2014;14:391–7. Article CAS PubMed Google Scholar * Beasley NJ, Leek R, Alam M, Turley H, Cox GJ, Gatter K, et al. Hypoxia-inducible factors HIF-1alpha and HIF-2alpha in
head and neck cancer: relationship to tumor biology and treatment outcome in surgically resected patients. Cancer Res. 2002;62:2493–7. CAS PubMed Google Scholar * Han S, Huang T, Li W,
Liu S, Yang W, Shi Q, et al. Association between hypoxia-inducible factor-2alpha (HIF-2alpha) expression and colorectal cancer and its prognostic role: a systematic analysis. Cell Physiol
Biochem. 2018;48:516–27. Article CAS PubMed Google Scholar * Ioannou M, Paraskeva E, Baxevanidou K, Simos G, Papamichali R, Papacharalambous C, et al. HIF-1alpha in colorectal carcinoma:
review of the literature. J BUON. 2015;20:680–9. PubMed Google Scholar * Luan Y, Gao C, Miao Y, Li Y, Wang Z, Qiu X. Clinicopathological and prognostic significance of HIF-1alpha and
HIF-2alpha expression in small cell lung cancer. Pathol Res Practice. 2013;209:184–9. Article CAS Google Scholar * Kaelin WG Jr. The von Hippel-lindau tumour suppressor protein: O2
sensing and cancer. Nat Rev Cancer. 2008;8:865–73. Article CAS PubMed Google Scholar * Holmquist-Mengelbier L, Fredlund E, Lofstedt T, Noguera R, Navarro S, Nilsson H, et al. Recruitment
of HIF-1alpha and HIF-2alpha to common target genes is differentially regulated in neuroblastoma: HIF-2alpha promotes an aggressive phenotype. Cancer Cell. 2006;10:413–23. Article CAS
PubMed Google Scholar * Li Z, Bao S, Wu Q, Wang H, Eyler C, Sathornsumetee S, et al. Hypoxia-inducible factors regulate tumorigenic capacity of glioma stem cells. Cancer Cell.
2009;15:501–13. Article CAS PubMed PubMed Central Google Scholar * Petrova V, Annicchiarico-Petruzzelli M, Melino G, Amelio I. The hypoxic tumour microenvironment. Oncogenesis.
2018;7:10. Article PubMed PubMed Central Google Scholar * Semenza GL. Targeting HIF-1 for cancer therapy. Nat Rev Cancer. 2003;3:721–32. Article CAS PubMed Google Scholar * Fallah J,
Rini BI. HIF inhibitors: status of current clinical development. Curr Oncol Rep. 2019;21:6. Article PubMed Google Scholar * Semenza GL. Pharmacologic targeting of hypoxia-inducible
factors. Annu Rev Pharmacol Toxicol. 2019;59:379–403. Article CAS PubMed Google Scholar * Jonasch E, Donskov F, Iliopoulos O, Rathmell WK, Narayan VK, Maughan BL, et al. Belzutifan for
renal cell carcinoma in von Hippel-lindau disease. N Engl J Med. 2021;385:2036–46. Article CAS PubMed PubMed Central Google Scholar * Cavalli FMG, Remke M, Rampasek L, Peacock J, Shih
DJH, Luu B, et al. Intertumoral heterogeneity within medulloblastoma subgroups. Cancer Cell. 2017;31:737–754.e736. Article CAS PubMed PubMed Central Google Scholar * Manoranjan B, Adile
AA, Venugopal C, Singh SK. WNT: an unexpected tumor suppressor in medulloblastoma. Mol Cell Oncol. 2020;7:1834903. Article PubMed PubMed Central Google Scholar * Lim JH, Park JW, Kim
MS, Park SK, Johnson RS, Chun YS. Bafilomycin induces the p21-mediated growth inhibition of cancer cells under hypoxic conditions by expressing hypoxia-inducible factor-1alpha. Mol
Pharmacol. 2006;70:1856–65. Article CAS PubMed Google Scholar * Han D, Huang M, Wang T, Li Z, Chen Y, Liu C, et al. Lysine methylation of transcription factors in cancer. Cell Death Dis.
2019;10:290. Article PubMed PubMed Central Google Scholar * Bao L, Chen Y, Lai HT, Wu SY, Wang JE, Hatanpaa KJ, et al. Methylation of hypoxia-inducible factor (HIF)-1alpha by G9a/GLP
inhibits HIF-1 transcriptional activity and cell migration. Nucleic acids Res. 2018;46:6576–91. Article CAS PubMed PubMed Central Google Scholar * Marxsen JH, Stengel P, Doege K,
Heikkinen P, Jokilehto T, Wagner T, et al. Hypoxia-inducible factor-1 (HIF-1) promotes its degradation by induction of HIF-alpha-prolyl-4-hydroxylases. Biochem J. 2004;381:761–7. Article
CAS PubMed PubMed Central Google Scholar * Ballabio C, Anderle M, Gianesello M, Lago C, Miele E, Cardano M, et al. Modeling medulloblastoma in vivo and with human cerebellar organoids.
Nat Commun. 2020;11:583. Article PubMed PubMed Central Google Scholar * Schodel J, Grampp S, Maher ER, Moch H, Ratcliffe PJ, Russo P, et al. Hypoxia, Hypoxia-inducible transcription
factors, and renal cancer. Eur Urol. 2016;69:646–57. Article PubMed Google Scholar * Koh MY, Powis G. Passing the baton: the HIF switch. Trends Biochem Sci. 2012;37:364–72. Article CAS
PubMed PubMed Central Google Scholar * Pei Y, Moore CE, Wang J, Tewari AK, Eroshkin A, Cho YJ, et al. An animal model of MYC-driven medulloblastoma. Cancer Cell. 2012;21:155–67. Article
CAS PubMed PubMed Central Google Scholar * Das B, Pal B, Bhuyan R, Li H, Sarma A, Gayan S, et al. MYC regulates the HIF2alpha stemness pathway via Nanog and Sox2 to maintain self-renewal
in cancer stem cells versus non-stem cancer cells. Cancer Res. 2019;79:4015–25. Article CAS PubMed PubMed Central Google Scholar * Covello KL, Kehler J, Yu H, Gordan JD, Arsham AM, Hu
CJ, et al. HIF-2alpha regulates Oct-4: effects of hypoxia on stem cell function, embryonic development, and tumor growth. Genes Dev. 2006;20:557–70. Article CAS PubMed PubMed Central
Google Scholar * Petruzzelli R, Christensen DR, Parry KL, Sanchez-Elsner T, Houghton FD. HIF-2alpha regulates NANOG expression in human embryonic stem cells following hypoxia and
reoxygenation through the interaction with an Oct-sox cis regulatory element. PLoS One. 2014;9:e108309. Article PubMed PubMed Central Google Scholar * Simon MC, Keith B. The role of
oxygen availability in embryonic development and stem cell function. Nat Rev Mol Cell Biol. 2008;9:285–96. Article CAS PubMed PubMed Central Google Scholar * Garancher A, Lin CY,
Morabito M, Richer W, Rocques N, Larcher M, et al. NRL and CRX define photoreceptor identity and reveal subgroup-specific dependencies in medulloblastoma. Cancer Cell. 2018;33:435–49.
Article CAS PubMed PubMed Central Google Scholar * Dayan F, Roux D, Brahimi-Horn MC, Pouyssegur J, Mazure NM. The oxygen sensor factor-inhibiting hypoxia-inducible factor-1 controls
expression of distinct genes through the bifunctional transcriptional character of hypoxia-inducible factor-1alpha. Cancer Res. 2006;66:3688–98. Article CAS PubMed Google Scholar *
Richard DE, Berra E, Gothie E, Roux D, Pouyssegur J. p42/p44 mitogen-activated protein kinases phosphorylate hypoxia-inducible factor 1alpha (HIF-1alpha) and enhance the transcriptional
activity of HIF-1. J Biol Chem. 1999;274:32631–7. Article CAS PubMed Google Scholar * Manoranjan B, Venugopal C, Bakhshinyan D, Adile AA, Richards L, Kameda-Smith MM, et al. Wnt
activation as a therapeutic strategy in medulloblastoma. Nat Commun. 2020;11:4323. Article PubMed PubMed Central Google Scholar * Northcott PA, Robinson GW, Kratz CP, Mabbott DJ, Pomeroy
SL, Clifford SC, et al. Medulloblastoma. Nat Rev Dis Primers. 2019;5:11. Article PubMed Google Scholar Download references ACKNOWLEDGEMENTS This work was supported by a grant from La
Fondation Flavien, the Fondation ARC pour la recherche sur le Cancer and La Ligue contre le Cancer. Y. Guo is supported by the China Scholarship Council. I. Ben-Sahra is supported by the NIH
R00-CA194192 and LAM Foundation grants. F. Bost and N.M. Mazure are CNRS investigators. Metabolomics services were performed by the Metabolomics Core Facility at Robert H. Lurie
Comprehensive Cancer Center of Northwestern University and the Beth Israel Deaconess Medical Center Mass Spectrometry Facility of Harvard Medical School. Armenise, AIRC, CARITRO and EMBO to
LT. We sincerely thank the GIS-IBISA multi-sites platform Microscopy Imagery Côte d’Azur (MICA), and particularly the imaging site of C3M (INSERM U1065) supported by INSERM, Cancéropôle
PACA, Conseil Régional, Conseil Départemental, and IBISA. AUTHOR INFORMATION Author notes * These authors contributed equally: J. Contenti, Y. Guo. AUTHORS AND AFFILIATIONS * Université Côte
d’Azur, INSERM U1065, C3M, 151 Route de St Antoine de Ginestière, BP2 3194, CEDEX 03, Labellisé Ligue Nationale contre le Cancer 2022, 06204, Nice, France J. Contenti, Y. Guo, M. Irondelle,
V. Tiroille, A. Mazzu, G. Robert, F. Bost & N. M. Mazure * CNRS UMR 3347, Centre Universitaire, Orsay, France M. Larcher, L. Mirabal-Ortega & C. Pouponnot * Université Côte d’Azur,
LP2M, CNRS-UMR 7370, Faculty of Medicine, 06108, Nice, France M. Rouleau * Université Côte d’Azur, Laboratory of Solid Tumor Genetics, University Hospital of Nice (CHU), Nice, France V.
Duranton-Tanneur & F. Pedeutour * Laboratory of Solid Tumor Genetics, Institute for Research on Cancer and Aging of Nice (IRCAN), CNRS UMR 7284/INSERM U1081, Nice, France V.
Duranton-Tanneur & F. Pedeutour * Department of Biochemistry and Molecular Genetics, Northwestern University, Chicago, IL, USA I. Ben-Sahra * Armenise-Harvard Laboratory of Brain Cancer,
Department CIBIO, University of Trento, Via Sommarive 9, 38123, Trento, Italy C. Lago, G. Leva & L. Tiberi Authors * J. Contenti View author publications You can also search for this
author inPubMed Google Scholar * Y. Guo View author publications You can also search for this author inPubMed Google Scholar * M. Larcher View author publications You can also search for
this author inPubMed Google Scholar * L. Mirabal-Ortega View author publications You can also search for this author inPubMed Google Scholar * M. Rouleau View author publications You can
also search for this author inPubMed Google Scholar * M. Irondelle View author publications You can also search for this author inPubMed Google Scholar * V. Tiroille View author publications
You can also search for this author inPubMed Google Scholar * A. Mazzu View author publications You can also search for this author inPubMed Google Scholar * V. Duranton-Tanneur View author
publications You can also search for this author inPubMed Google Scholar * F. Pedeutour View author publications You can also search for this author inPubMed Google Scholar * I. Ben-Sahra
View author publications You can also search for this author inPubMed Google Scholar * C. Lago View author publications You can also search for this author inPubMed Google Scholar * G. Leva
View author publications You can also search for this author inPubMed Google Scholar * L. Tiberi View author publications You can also search for this author inPubMed Google Scholar * G.
Robert View author publications You can also search for this author inPubMed Google Scholar * C. Pouponnot View author publications You can also search for this author inPubMed Google
Scholar * F. Bost View author publications You can also search for this author inPubMed Google Scholar * N. M. Mazure View author publications You can also search for this author inPubMed
Google Scholar CONTRIBUTIONS Conceived and designed experiments: JC, YG, MI, LT, GR, CP, NMM. Performed the experiments: JC, YG, ML, LM-O, MR, MI, VT, AM, VD-T, IB-S, CL, GL, GR, NMM.
Analyzed the data: JC, YG, ML, LM-O, MR, MI, VD-T, FP, IB-S, CL, GL, LT, GR, CP, FB, NMM. Wrote the paper: JC, YG, IB-S, LT, GR, CP, NMM. Acquire funding: IB-S, LT, CP, FB, NMM.
CORRESPONDING AUTHORS Correspondence to J. Contenti or N. M. Mazure. ETHICS DECLARATIONS COMPETING INTERESTS The authors declare no competing interests. ETHICS APPROVAL AND CONSENT TO
PARTICIPATE Not applicable. ADDITIONAL INFORMATION PUBLISHER’S NOTE Springer Nature remains neutral with regard to jurisdictional claims in published maps and institutional affiliations.
SUPPLEMENTARY INFORMATION SUPPL. FIGURES 1–14 SUPPL. LEGENDS ORIGINAL DATA RIGHTS AND PERMISSIONS OPEN ACCESS This article is licensed under a Creative Commons Attribution 4.0 International
License, which permits use, sharing, adaptation, distribution and reproduction in any medium or format, as long as you give appropriate credit to the original author(s) and the source,
provide a link to the Creative Commons licence, and indicate if changes were made. The images or other third party material in this article are included in the article’s Creative Commons
licence, unless indicated otherwise in a credit line to the material. If material is not included in the article’s Creative Commons licence and your intended use is not permitted by
statutory regulation or exceeds the permitted use, you will need to obtain permission directly from the copyright holder. To view a copy of this licence, visit
http://creativecommons.org/licenses/by/4.0/. Reprints and permissions ABOUT THIS ARTICLE CITE THIS ARTICLE Contenti, J., Guo, Y., Larcher, M. _et al._ HIF-1 inactivation empowers HIF-2 to
drive hypoxia adaptation in aggressive forms of medulloblastoma. _Cell Death Discov._ 10, 338 (2024). https://doi.org/10.1038/s41420-024-02100-5 Download citation * Received: 08 March 2024 *
Revised: 01 July 2024 * Accepted: 12 July 2024 * Published: 24 July 2024 * DOI: https://doi.org/10.1038/s41420-024-02100-5 SHARE THIS ARTICLE Anyone you share the following link with will
be able to read this content: Get shareable link Sorry, a shareable link is not currently available for this article. Copy to clipboard Provided by the Springer Nature SharedIt
content-sharing initiative