The single-cell transcriptomic atlas ipain identifies senescence of nociceptors as a therapeutical target for chronic pain treatment
- Select a language for the TTS:
- UK English Female
- UK English Male
- US English Female
- US English Male
- Australian Female
- Australian Male
- Language selected: (auto detect) - EN
Play all audios:

ABSTRACT Chronic pain remains a significant medical challenge with complex underlying mechanisms, and an urgent need for new treatments. Our research built and utilized the iPain single-cell
atlas to study chronic pain progression in dorsal root and trigeminal ganglia. We discovered that senescence of a small subset of pain-sensing neurons may be a driver of chronic pain. This
mechanism was observed in animal models after nerve injury and in human patients diagnosed with chronic pain or diabetic painful neuropathy. Notably, treatment with senolytics, drugs that
remove senescent cells, reversed pain symptoms in mice post-injury. These findings highlight the role of cellular senescence in chronic pain development, demonstrate the therapeutic
potential of senolytic treatments, and underscore the value of the iPain atlas for future pain research. SIMILAR CONTENT BEING VIEWED BY OTHERS AGING AND INJURY DRIVE NEURONAL SENESCENCE IN
THE DORSAL ROOT GANGLIA Article Open access 14 May 2025 SINGLE-CELL TRANSCRIPTOMIC ANALYSIS OF SOMATOSENSORY NEURONS UNCOVERS TEMPORAL DEVELOPMENT OF NEUROPATHIC PAIN Article 10 March 2021
NEUROGENESIS IN THE ADULT BRAIN FUNCTIONALLY CONTRIBUTES TO THE MAINTENANCE OF CHRONIC NEUROPATHIC PAIN Article Open access 17 September 2021 INTRODUCTION Currently, around 20% of adults
suffer from chronic pain, which would correspond to over 1.2 billion people worldwide, making it a global healthcare crisis1. While there are treatments available, these often provide only
partial relief if at all, and come with adverse side effects and a risk of drug abuse2,3. These treatments also center on pain signaling modulation and do not address the underlying
molecular and cellular causes of chronic pain. A better understanding of the molecular changes underlying chronic pain progression could enable the development of innovative, non-addictive
therapeutic strategies to effectively alleviate chronic pain. Thus, understanding the mechanisms involved in pain chronification have remained crucial for uncovering new therapeutic avenues.
Pain sensation is conveyed peripherally by the activation of pain-sensing neurons, or nociceptors, whose cell bodies reside in the peripheral sensory ganglia (mostly in the dorsal root
ganglia, DRG, alongside the spinal cord and in the trigeminal ganglia, TG). Those neurons are of different subtypes that are classified as peptidergic (PEPs), non-peptidergic (NPs), C-Low
Threshold mechanoreceptor (C-LTMRs), and a subtype of somatostatin positive neurons (SST)4,5,6. Nociceptors send peripheral nerve endings throughout the whole body, innervating the skin,
dura mater, and deep tissue. Centrally, they project within the spinal cord or the pons where the pain signal is transmitted and integrated locally and sent to upper brain centers where it
is perceived as a pain sensation. The introduction of single-cell RNA sequencing (scRNA-seq) has enabled the transformative advancement in our understanding of the intricate functional
diversity of disorder development much like the comprehensive atlases created in other fields such as cancer7 and neurological disorders8. In a substantial effort to create atlases with
further gene coverage than already available and with chromatin dynamic information, we integrated diverse single cell (sc) or single-nuclei (sn) RNA-seq from peer-reviewed datasets with our
in-house datasets5,9,10,11,12,13,14,15,16,17 (Table 1), with the aim to further unveil the molecular signatures governing the development and persistence of the different types of chronic
pain while also focusing on uncovering a shared mechanism among diverse pain models. With our somatosensory atlases called iPain available on CELLxGENE browser, we have established a
foundational framework that builds upon and extends previous research efforts5,11 and is crucial for investigating the development of chronic pain, when originating in the first anatomical
relay of pain pathway, either in the DRG (iPainDRG) or in the TG (iPainTG). Using iPainDRG, our results identify the senescence of a subset of nociceptor cells as a common mechanism across
the various rodent pain models, as well as in humans with chronic pain. Our data further reveal that treatment with senolytic compounds rescues hyperalgesia and allodynia associated with
chronic pain in mice, demonstrating significant therapeutic potential and a role for the senescence process in chronic pain disorders independent of aging. RESULTS CREATION OF IPAIN, A
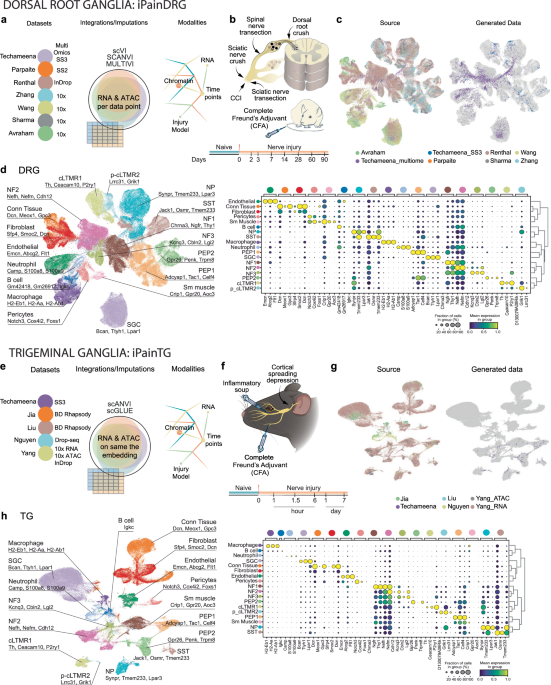
SOMATOSENSORY ATLAS THAT CAPTURES CHRONIC PAIN DEVELOPMENT In recent years, numerous efforts have been made to generate sc/snRNA-seq datasets of the mouse DRG and TG in diverse models of
chronic pain (Fig. 1; Supplementary Data 1). These datasets offer different sampling timepoints and pain models at various stages of progression, providing the opportunity to create
comprehensive atlases. However, the lack of alignment among the unique genes and molecules identified in each dataset due to the use of different isolation methods and sequencing
technologies can be a challenge for integration of different datasets. To overcome this, we have used variational autoencoder (VAE)-based integration models like scANVI18, MULTIVI19, and
scGLUE20 (Fig. 1; Supplementary Fig. 1; Supplementary Fig. 2; Supplementary Fig. 3), which can effectively harmonize the datasets, control for batch correction while conserving the
biological information to capture the entire spectrum of molecular dynamics and diversity associated with pain chronicity in the DRG and TG in different chronic pain models and at different
timepoints (Fig. 1b, f; and Supplementary Fig. 3). The iPainDRG atlas, which integrates 191,798 cells from 7 sources (in-house generate: 4468 cells from multiome and 625 cells from
Smart-seq3), represents a comprehensive resource for understanding the molecular dynamics in somatosensory neurons in response to injury and the progression of pain chronification, with RNA
and ATAC information provided for each single cell (multiomic dataset allow for the use of MultiVI with ATAC imputation to all cells even to cells that did not originally provide ATAC
modality, Supplementary Fig. 2a for workflow, Supplementary Fig. 3a for atlas content). Of note, the combination of all these modalities allows the use of integration methods compatible with
the imputation of missing genes, therefore increasing the gene coverage. Similarly, the iPainTG atlas, which integrates 87,838 cells from five diverse sources (in-house generated: 124 cells
from Smart-seq3), provides insights into the TG’s response to various pain conditions (unlike in iPainDRG, not every cell in iPainTG has ATAC modality, Supplementary Fig. 2b and
Supplementary Fig. 3b). These atlases, with their detailed cell-type-specific markers and chromatin accessibility profiles, can serve as valuable references for the research community
studying the underlying mechanisms of chronic pain (Fig. 1d, h; and Supplementary Data 2–3). Finally, the atlases allow for the integration of datasets sequenced by any sequencing
technologies. CELL STATE PROGRESSION TOWARDS CHRONIC PAIN AND DRIVING MECHANISM To better understand the progression of cell state changes in sensory neurons during chronic pain, we used the
iPainDRG dataset, as it includes more pain models than iPainTG and covers the whole-time course of pain chronification. Indeed, all pain models used in the dataset are known to develop
within 1–3 days, peak at 2–3 weeks, and persist for weeks thereafter21. Therefore, we chose to cover the analysis of the study up to 28 days post-injury, where the pain is chronic and well
established, and in the atlas, several models share 28-day timepoints presumably reinforcing the analysis. Using iPainDRG, we further isolated and re-clustered neurons from the nociceptive
lineage in DRG, then visualized with Uniform Manifold Approximation and Projection (UMAP) to examine the molecular changes following injury (Fig. 2a–d; Supplementary Fig. 4a). We observed
that the neurons distribute in a pattern that reflects dynamics based on their experimental timepoint and connections to naïve or injury states (Fig. 2b–d and Supplementary Fig 4a). In the
UMAP visualization, neurons at a naïve (0 day) state are located at the periphery, while neurons post-injury begin to shift toward the center. By 28 days, this phenotype reversed, and most
neurons returned to the periphery of the graph (Fig. 2d). To investigate these molecular changes further, we classified the generated Leiden clusters where those spatially distinct areas
were classified into “woPain” (without pain) and “wPain” (with pain) macrostates based on their alignment with the “Reference” state (naïve and sham conditions) or not, respectively (Fig.
2c). Differential expression analysis confirmed that the “wPain” category was associated with upregulated genes related to axon regeneration and axon guidance, suggesting a regenerative
molecular program following injury, as previously reported22,23 (Supplementary Data 4). Importantly, the “wPain” and “woPain” macrostates could be further broken down into microstates to
refine cell progression over time. These microstates, combined with injury timepoints, were named _Reference_, _Moving_, _Pain_, _Recovery,_ and _Lasting Pain_ (Fig. 2e). The _Reference_
state (timepoint 0) represents uninjured cells, naturally within “woPain”. The _Pain_ state represents the neurons in “wPain” excluding timepoint 28 days. Cells in “wPain” at 28 days
post-injury were labeled as being in the _Lasting Pain_ state. Remaining cells at post-injury timepoints but exhibited in “woPain” were further distinguished: the early phase of pain
development (up to 1.5 days) as _Moving_, and the later phase (1.5–28 days) as _Recovery_. This categorization was based on the observation that all cells were in the “wPain” macrostate at
the 1.5-day timepoint, while “woPain” state cells were seen both before and after. Therefore, cells in “woPain” prior to 1.5 days were assumed to be _Moving_ toward _Pain_, while cells after
were in _Recovery_ from _Pain_. Importantly, the defined microstates were unbiasedly recovered as pain dynamics states using RNA velocity24 (computed from CytoTrace25 score) (Fig. 2e and
Supplementary Fig. 4b) and PAGA graph analysis26 (Supplementary Fig. 4c). We also performed Generalized Perron Cluster-Cluster Analysis (GPCCA) using RNA velocity transition matrix and
observed a high degree of alignment when we color-coded the GPCCA results by our own defined states. Note that this analysis was performed for each nociceptor subtype with similar results
(Supplementary Fig. 4d). Altogether these results unbiasedly indicate that the nociceptors captured in the atlas dynamically progress between different microstates in chronic pain models. We
therefore extracted the driver genes within nociceptors responsible for the microstates transition and performed cell-cell communication analysis to comprehend the origin of cellular
changes centering on the communication between nociceptors, immune cells, and satellite glial cells. For the driver genes within nociceptors, the analysis based on the terminal states
revealed that many genes belonged to the “regeneration-associated genes” RAGs22,23 (Supplementary Data 5), with dynamic activity along the CytoTrace pseudotime. _Sox11_ was identified as the
sole transcription factor (TF) that consistently ranked among the top five driver genes in all nociceptor subtypes (Fig. 2f and Supplementary Data 5). We used SCENIC to identify the
regulons associated with the molecular programs responsible for controlling the dynamic cell state transition of nociceptors and combined it with an analysis of ATAC peaks’ accessibility
after injury (Fig. 2g and Supplementary Fig. 4e, f). Identified regulons included _Atf3_, _Jun_, and _Sox11_. Particularly, _Sox11_ regulon activity was found to increase as pseudotime
progressed and remained elevated in the _Lasting Pain_ state, in contrast to _Atf3_ and _Jun_ regulons, which exhibited an initial increase in activity followed by a decline (Supplementary
Fig. 5a–f). This suggested that SOX11 is a potential driver gene for the development and maintenance of neuropathic pain, a finding that was recently confirmed in vivo27, further supporting
the robustness of our analysis. To decipher cell-cell communication patterns (Fig. 2h), we combined all cell types, including non-neuronal cells, and employed tensor decomposition28 (Fig.
2h, i; Supplementary Fig. 4g; and Supplementary Data 6). This method extracts multicellular gene expression patterns that vary across different cell types, pain models (contexts), and
timepoints to unbiasedly identify groups of molecular ligand-receptor pairs involved in cell-to-cell interactions. In our analysis, these groups, also called “Factors”, capture how molecular
changes in nociceptors are related to interactions with immune and satellite glial cells in _Reference_ and _non-Reference_ (_Moving, Pain, Recovery_, and _Lasting Pain_) states
(Supplementary Fig. 4g). Six Factors were revealed, amongst which Factor 3 exhibited the greatest changes between _Reference_ and _non-Reference_ conditions while affecting all pain models
that are included in the iPainDRG (Supplementary Fig. 4g). We, therefore, conducted a gene enrichment analysis using PROGENy pathways on the receptor-ligand pairs characterizing Factor 3 to
understand their biological significance. The p53 pathway was the most enriched pathway for this Factor, underlying upregulation of the p53 pathway during pain progression (Fig. 2j).
Notably, the distribution of the p53, p21, and p16 tumor suppressor genes within this “Factor” correlated with expression of these genes post-injury conditions in our atlas (Supplementary
Fig. 5g). The presence of these genes together strongly suggested a process of cellular senescence during pain chronification29,30,31. DEVELOPMENT AND PERSISTENCE OF PAIN AND SENESCENCE OF
PAIN-SENSING NEURONS The concept of cellular senescence was initially discovered in dividing cells but later extended to include post-mitotic cells, correlating this process with aging in
various tissues. Cellular senescence involves cells altering their characteristic phenotype in response to stress, resulting in a distinct secretory phenotype, called the Senescence
Associated Secretory Phenotype (SASP), and characterized by the release of inflammatory cytokines, growth factors, and proteases. SASP operates through diverse mechanisms, often involving
autocrine or paracrine signaling. To facilitate standardized and streamlined senescence analysis, the Mayo Clinic has recently introduced the SenMayo gene set32, encompassing an extensive
collection of SASP-related genes (Supplementary Data 7). Using this method, we identified SASP-positive cells by selecting those within the top 10 percent of the SenMayo z-score (Fig. 3a, b)
and highlighted them in the scatter plot, depicting GenAge score (gene set associated with aging in model organisms) in relation to CellAge score (gene set associated with aging in human
cells)33 (Fig. 3a, b and Supplementary Data 8). This analysis demonstrated that cells affected by injury exhibited advancement in both GenAge and CellAge compared to naïve cells. Upon
evaluating this with the CytoTrace score which demonstrated a lower potential for cell plasticity after injury in a subset of nociceptors (Supplementary Fig. 4b), we formulated a hypothesis
suggesting that the persistence of pain in the chronic injury model might be attributed to the persistence of injury-induced senescent cells which are unable to reverse their phenotype to
the _Reference_ state. To test this hypothesis, we initially identified senescent cells among the nociceptive lineage cells by computing a gene module score based on the genes listed in
SenMayo. Upon the evaluation of the score, we observed that the SenMayo z-score increased in every type of neuropathic pain model when compared to the control (Fig. 3c). Statistical testing
of the SenMayo z-score revealed a high enrichment of senescent cellular characteristics within nociceptors following injury in all pain models except Paclitaxel (Fig. 3c), across the dynamic
states (Fig. 3d) and for all nociceptors subtypes, regardless of the biological sexes (Fig. 3e). Additionally, the SenMayo z-score was found to be significantly lower in the _Recovery_
state when compared to the _Pain_ and _Lasting Pain_ states (Fig. 3d). Interestingly, every subtype of the nociceptive lineage cells exhibited the increase of the SenMayo z-score when we
compared the _Pain_ state to _Reference_ state. We then verified the time course of senescence development in silico (Fig. 3f) and in vivo by detecting the Senescence-Associated
Beta-galactosidase (SA-β-Gal) staining in DRG after nerve injury (CCI, Fig. 3g, h). We identified a senescent phenotype in a subset of nociceptors, which were characterized by high
expression of the neuronal nuclei marker (NeuN) and their smaller size (Fig. 3i). Furthermore, the injury was accompanied by an increased nuclear expression of the senescence marker p21
starting from day 7 post-injury34 (Supplementary Fig. 5g, h). These in vivo findings support the reliability of using the SenMayo z-score as a hallmark of senescence in our in silico
analysis. For TG, the atlas covered limited timepoints for proper analysis. We, therefore, assessed the SenMayo z-score in a pain model of compression of the trigeminal root entry zone
(TREZ) of the TG nerve, modeling excruciating pain disorders such as trigeminal neuralgia (TN, also called the suicidal disease)35, and cluster headache (CH, a trigeminal autonomic
cephalalgia) which are both associated with nerve compression by blood vessels (called microvascular compression)36. To do this, we used the bulk RNA-seq dataset37 from the rat model with TN
to compute the score. We identified a clear increase in the SenMayo z-score compared to control conditions suggesting that both the DRG and TG use senescence as a pain chronification
mechanism (Fig. 3j). We then assessed the SenMayo z-score in human samples focusing on the DRG (TG dataset or samples from pain sufferers are not currently available online nor in biobank).
SenMayo z-score was elevated in DRG from human patients diagnosed with chronic pain (Fig. 4a) irrespective of their biological age (Fig. 4b, c), in an online dataset38. Deconvolution into
cell types using human reference map39 (Fig. 4d–f; Supplementary Fig. 5i) showed that the nociceptors (Fig. 4g) have a SenMayo z-score significantly elevated in chronic pain condition,
further emphasizing the involvement of senescence in nociceptors in human with chronic pain. Similar results were observed when the SenMayo z-score was applied to DRG bulk-seq40 extracted
from patients with diabetes neuropathy (Fig. 4h, i). These results in humans support the translational value of our findings. Importantly in mice, the senescence score was significantly
higher in all pain models, regardless of the biological sex (Fig. 3c, e). TARGETING SENESCENT CELLS TREATS CHRONIC PAIN While the presence of senescent neurons in peripheral somatosensory
neurons was unexpected in the context of chronic pain independent of aging, drugs targeting senescence cells, known as senolytic agents, have been well characterized and are used already in
preclinical and clinical trials. Senolytic drugs capitalize on senescent-cell anti-apoptotic pathways (SCAPs)41. Disrupting the expression of proteins within these pathways can lead to the
selective elimination of senescent cells while preserving neighboring cells and tissue physiology. The senolytic agents used in this study included the bioavailable small molecule inhibitors
of B-cell lymphoma-2 protein (Bcl-2) family proteins, such as Navitoclax (ABT-263), Venetoclax, and proteolysis targeting chimera (PROTAC) compound, PROTAC Bcl-XL degrader, the latter
aiming at controlling the linked side effects that this class of molecules has on thrombocytes counts. To test the hypothesis that targeting senescent cells could suppress hypersensitivity
to pain in a chronic pain model, we gave these various senolytic agents or vehicles to mice which have been subjected to Chronic Constriction Injury (CCI) and developed hyperalgesia and
allodynia by day 7 (Fig. 5a). Remarkably, mice treated with senolytic agents exhibited significantly less or no signs of mechanical pain 4 weeks post nerve injury when compared with baseline
or vehicle at the same timepoint (Fig. 5b). The drugs however did not significantly impact thermal sensation during the timeframe of the experiment or at the administered doses. The
restoration of normal pain behavior was associated with the selective removal of at least 50% of SA-β-galactosidase positive cells, on average, among the small diameter, peripherin-positives
neurons for all drugs (Fig. 5c, d). Ultimately, the removed cells represent a small fraction of the total peripherin-positive neurons. Moreover, body weight remained unchanged
(Supplementary Fig. 5j) throughout the experiment and blood counts were similar between the drug-treated and control groups (Fig. 5e), indicating that the senolytic compounds did not show
obvious adverse systemic effects and did not significantly affect the thrombocytes counts (Fig. 5e). Importantly, as a control to assess the specific role of the senolytic compounds on
pain-sensing neurons and to control for off-target effects, we tested the mice for anxiety balance and motor skills (Fig. 5f, g, and Supplementary Fig. 5k, l). No significant difference was
observed when comparing the drug-treated mice to the control conditions. These results provide a more comprehensive understanding of the effects of the senolytic compounds highlighting their
selective impact on mechanical hypersensitivity without affecting other sensory modalities or general health parameters. Together these data indicate that a senescence process occurs in a
subset of nociceptive neurons in various chronic pain models and participates in the persistence of the pain state and that targeting these senescent cells represents a promising treatment
option for patients affected with chronic pain. DISCUSSION The extensive prevalence of chronic pain in the human population aligns with the pressing need to develop novel approaches to
medical treatment. A major limitation to progress in this field has been a lack of comprehensive understanding of the overall phenotypic alterations that underlie the dysfunction of
nociceptive neurons following nerve injury, leading to the onset of the chronic pain state. Our study introduces an integrated pain atlas (iPain) for systematically exploring the trajectory
of chronic pain development through the analysis of single-cell omics data from various sources. A salient discovery from our research is the consistent induction of a senescence phenotype
in the transcriptome of a subset of somatosensory neurons, principally in nociceptors, following peripheral nerve injury, a phenomenon observed in both rodents and human datasets.
Pharmacologically targeting senescent cells further proved effective in rescuing pain behaviors in a mouse model of chronic pain, suggesting a role of senescent cells in sustaining a
neuropathic pain phenotype. Our data provide functional evidence for the role of senescent cells in the progression and persistence of chronic pain in a sex-independent manner. This study
reveals a dynamic “intrinsic” shift in gene expression patterns in time following peripheral nerve injury. A common transcriptomic signature across all subtypes is _Sox11_. SOX11 is a
transcription factor involved in nervous system development and in neurogenesis in adults where it induces the expression of neuronal traits42,43. This suggests a role in the regeneration
process. However, while the expression of the known regeneration-associated genes like _Atf3_ and _Jun_ increases at early timepoints post-injury, they decrease later. In contrast, _Sox11_
remains elevated at a later timepoint, suggesting a different role than regeneration which would align with persistent pain development and maintenance. Interestingly, in relation to chronic
pain a role of _Sox11_ was previously predicted using the neuropathic pain model of spared nerve injury44, and in a sex-stratified genome-wide association study of Multisite Chronic Pain
(MCP), SOX11 was shown to be associated with MCP in females44. Finally, it is now reported using loss and gain of function that SOX11 has an important role in the initiation and maintenance
of neuropathic pain25. Those findings further support the resourcefulness of iPain. Moreover, our approach and our workflow differ from a cross-species atlas45, which also integrates data
from multiple sources, but focuses on addressing molecular conservation across different species. In contrast, iPain is specifically tailored to charting the trajectory of chronic pain
development in a targeted manner. Previous research has linked cellular senescence with chronic pain, specifically in the spinal cord46,47, presumably as a secondary process occurring
several months after injury and exhibiting a male-specific effect46 in certain cases. Nevertheless, using senolytics to treat the spinal cord locally did not provide sustained relief from
neuropathic pain, indicating that this approach did not address the primary mechanism underlying neuropathic pain in the studied model. However, our study found that the connection between
cellular senescence and chronic pain begins just after the acute phase, and is linked to the onset of neuropathic/chronic pain. We observed senescence in nociceptors across various models of
peripheral nerve injury and inflammation, as well as in the TG for the TREZ compression model. Furthermore, we discovered that this effect is not sex-specific; both male and female animals
showed similar levels of cellular senescence in nociceptors. This suggests an underlying mechanism different from those previously reported. Lastly, while our study focuses on young and
middle-aged adult animals, this mechanism might also function or even intensify in older individuals in which the development of a senescent phenotype in nociceptors following nerve injury
or in control conditions might be more easily induced48. In conclusion, our single-cell transcriptomic atlases could provide substantial advances in drug discovery efforts by defining cells
and pathways relevant to pain disorders following peripheral nerve injury. Our discovery suggests an alternative therapeutic approach to the currently limited options for chronic pain
treatment, a hypothesis that has been validated in mice with translational potential for human subjects according to in silico analysis of chronic pain patients and patients with diabetes
painful neuropathy. The selective removal of the few dysfunctional, senescent neurons may be a worthwhile trade-off to achieve lasting well-being for the patient, especially in the case of
excruciating pain conditions with limited options, such as TN and CH which are linked to trigeminal nerve compression36. The current clinical development of several senolytic compounds,
including those used in this study, for anti-aging and cancer-related diseases, supports the strategy of targeting senescence to treat persistent pain in humans. This progress suggests these
senolytic compounds could soon be repurposed for treating chronic pain and headache disorders resulting from nerve tissue injury. Targeting senescent cells through apoptosis induction is a
straightforward method, and there are various agents demonstrating the effectiveness of senolytic agents in vivo, as well as in clinical trials39. Therefore, the use of senolytics represents
a promising approach in managing chronic pain. METHODS The basic analysis of the data was done with the functions from Scanpy49 package (v1.9.3) of Python3 (v3.10.10) and default parameters
according to Scanpy pipeline unless otherwise specified. MICE Cohorts of adult mice of both biological sexes, aged from 8 to 12 weeks were used for sequencing in all the different published
studies5,9,10,11,12,13. Our sequencing data on TG and DRG were obtained from mice aged between 8 and 12 weeks using the Smart-seq3Xpress, 10x multiomic technologies, in iPain these mice are
referred to as young. A middle-aged cohort (34–62 weeks) was processed using 10x multiomic sequencing, in iPain these mice are referred to as aged. For all details on biological sex, and
the number of cells per timepoints see tables in Fig. S2 and the CellxGene50 iPain (iPain). For the senescence kinetic and for the drug treatment experiment, cohorts of mice aged between 17
and 27 weeks of both sexes (3 males and 3 females per group) were used. All the mice were on a C57BL/6 background and were kept under a 12-h light–dark cycle, at 24 °C with unlimited food
and water. All animal care and experimental procedures were permitted by the Ethical Committee on Animal Experiments (Stockholm North committee) and conducted according to The Swedish Animal
Agency’s Provisions and Guidelines for Animals Experimentation recommendations. Ethical permit numbers 9702-2018 and 17396-2022. DRUG ADMINISTRATION The senolytic compounds were given
orally, by gavage. The stock solution was diluted as 10% DMSO in corn oil prior to administration. The treatment starts seven days post CCI injury, the senolytic compound or vehicle control
(10% DMSO in corn oil) was administered by oral gavage once daily for either 10 consecutive days (Navitoclax CAS No. CAS. 923564-51-6 or Venetoclax CAS No. 1257044-40-8) or once weekly for 2
weeks PROTAC Bcl-xL degrader (CAS No. 2920415-08-1). FULL BLOOD COUNT Mice were deeply anesthetized with isoflurane. The full blood was taken from the hearts of the mice and kept in a blood
collection tube (containing EDTA) for further testing by IDEXX BioAnalytics. CHRONIC CONSTRICTIVE INJURY MICE MODEL Chronic constriction injury of the sciatic nerve (CCI) has been widely
described with minor differences in rodents51,52,53. Briefly, mice were first anesthetized with isoflurane, and a small incision was made at the mid-thigh level on the right side. Ligatures
(7–0 surgical silk) were tied loosely around the sciatic nerve with approximately 0.5 mm between ligatures. And then, the skin was closed by a 5–0 silk suture. PAIN-RELATED BEHAVIORAL TESTS
Mechanical sensitivity was assessed by the von Frey test in an up-down testing paradigm as previously described54,55. Briefly, mice were placed in glass cylinders on a 6 × 6 mm wire mesh
grid floor and were allowed to acclimate for 20–60 min. The plantar surface of the hind paw was stimulated with a series of calibrated monofilaments (von Frey hairs; Stoelting, IL) ranging
between 0.008 and 2 g and withdrawal or jerking of the paw is recorded as the pain threshold. Mice were tested 6 times on each paw following the testing paradigm. Thermal sensitivity was
assessed by the Hargreaves thermal paw withdrawal test as previously described56,57. Briefly, mice were placed in Plexiglas chambers on top of a glass sheet and were allowed to acclimate for
20–60 min. A thermal stimulator (IITC Inc., Woodland Hills, CA, United States) was precisely aimed at the middle of the plantar surface of the mice through the glass sheet. The laser
intensity was set to 30% and a cutoff latency of 20 s was set to avoid tissue damage. Noxious mechanical sensitivity was assessed by pinprick test as previously described with minor
modification58. Briefly, mice were placed in Plexiglas chambers on top of a glass sheet and were allowed to acclimate for 20–60 min. A 25-gauge needle connected with a 1 g filament (von Frey
hairs; Stoelting, IL) was applied uniformly to the plantar surface of the hind paw without penetrating the skin. A score system was used according to the extent of the response. 0 = no
response; 1 = move, look around to see what happened; 2 = brief quick lift or withdrawal or removal away of hind paw; 3 = brief quick shakes of the hind paw, or jumps; 4 = high frequency of
shaking, licking, flinching, or guarding. Mice were tested 4 times on each paw with a waiting time of 5min58,59. ANXIETY AND BALANCE MOTOR FUNCTION-RELATED BEHAVIOR ASSESSMENTS Anxiety was
assessed by the open field test (OFT) and elevated plus maze (EPM) tests60,61. For OFT, animals were placed in a roofless 45 × 45 cm square arena enclosed with 40 cm walls and allowed to
explore for 15 min while being recorded by a camera secured on the ceiling. Tracking and analysis were done using the EthoVision XT software where the arena was further partitioned into two
zones: center (square area of 22.5 × 22.5 cm in the middle of the arena) and periphery (rest of arena close to walls). The proportion of time spent in the two different zones with respect to
the center-point of each animal was used as an indicator of anxiety. For EPM, animals were placed in a plus (+) shaped arena elevated at 60 cm from the ground and allowed to explore for 5
min while being recorded by a camera secured on the ceiling. Tracking and analysis were done using the EthoVision XT software where the arena was partitioned according to its design: two
closed arms opposite to each other that are each 6 × 35 cm enclosed by 15 cm walls, two open arms opposite to each other with 6 × 35 cm which are all connected to one another by a small
6x6cm center area. The total distance traveled, and the proportion of time spent in the different types of zones with respect to the center-point of each animal were used as indicators of
anxiety. Motor coordination was assessed by beam walk and rotarod tests62,63,64,65. For the beam walk test, each animal and some bedding material was first placed for 2 min for habituation
inside the goal box, which is 12 × 12 × 12 cm elevated to 64 cm from the ground and enclosed on all sides except for the entry side. A round beam with a diameter of 11 mm (Small) and a
length of 105 cm were used. The test beam was placed straight with the endpoint in front of the goal box parallel to the ground with start and finish lines defined for a total length of 80
cm in the middle of the beam. Animals were first habituated on a 20 mm beam until the ability to fully cross the beam without hesitation was demonstrated. A total of three trials were
performed on the 11 mm beam, with at least 1 min rest between trials in the goal box. Each trial was recorded on camera and the time required for the mouse to cross the beam from start to
finish and the usage of the injured leg as a scoring system were used as indicators of motor function. 7 = traverses beam normally with no more than two footslips; 6 = traverses beam
successfully and uses affected limb in more than 50% of the steps; 5 = traverses beam successfully and uses affected limb in less than 50% of the steps; 4 = traverses beam and places
affected limb on horizontal surface at least once; 3 = traverses beam by dragging affected limbs; 2 = the animals cannot traverse but were able to place limbs on horizontal surface and
maintain balance; 1 = the animal cannot traverse and were unable to put affected limb on horizontal surface. For rotarod, the equipment from Ugo Basile S.R.L. model 47,600 was used with a
start speed of 4 rpm/min, a max speed of 40 rpm, and a ramp speed of 1.8 min (20 rpm/min). Mice were placed on the rotating dowel set to minimum speed and allowed to habituate for 5 min on
the first trial. A total of 8 trials were performed for each animal with a rest time of at least 5 min between each trial in the home cage. The time and final rpm of the mouse at falling or
the first occurrence of passive rotation (clinging to the dowel) were used as indicators of motor function. The first 2 trials were seen as habituation trials and the last 5 trials were
taken for analysis. SENESCENCE-ASSOCIATED Β-GALACTOSIDASE STAINING Mice were deeply euthanized with isoflurane and perfused with pre-cooled PBS. L4- L6 DRGs were quickly dissected,
immediately frozen, and then quickly imbedded in optimal cutting temperature embedding medium (OCT). The SA-β-galactosidase activity was detected by using a SA-β-galactosidase staining kit
(Cell Signaling Technology, #9860) at PH 6.0 according to the manufacturer’s instructions with minor modification. Briefly, DRG sections were rinsed twice by PBS before fixation, followed by
x-gal (PH 6.0) staining. 4 days after incubation (at 37 °C), the staining solution was removed, rinsed three times with PBS, sealed, and then immediately taken imaging. IMMUNOSTAINING The
snap-frozen DRG tissues were collected as described above (in “Methods” section, SA-β-galactosidase staining section). The snap-frozen DRG tissue was either freshly sectioned and then fixed
in PFA overnight at 4 °C, or reused from SA-β-galactosidase staining (double staining). DRG sections were washed with PBS, and permeabilized with 0.3% PBST for 10 min, followed by incubation
in blocking buffer (PBS containing 0.25% Triton X-100 and 1% bovine serum albumin) for 30 min at room temperature (RT). And then, DRG sections were incubated with primary antibody (diluted
in blocking buffer) at 4 °C overnight. After 3 washes with blocking buffer, a secondary antibody (1:1000, diluted in blocking buffer) was applied for 1 h at RT. Cells were then incubated in
DAPI solution (D212, Wako) for another 10 min, followed by 3 washes with PBS. Images were obtained with a fluorescence microscope or confocal microscope. The following primary antibodies
were used: anti-p21 antibody (1:100, gift from Doctor Sylvain Peuget), anti-peripherin (1:200; ab39374, Abcam), anti-NeuN (1:200; MAB377, Merck Millipore). IMAGING Brightfield images were
acquired using the Zeiss Axio Imager.Z2. Images were analyzed with ImageJ (v1.52 h) by (1) manual segmentation of ganglion while excluding large fibers; (2) general isolation of the blue
stain with the Color Deconvolution plugin66,67 with the built-in Brilliant Blue vector; (3) thresholding by pixel intensity from 5 to 185 with Li’s method and (4) positive stain
identification by the Analyze Particles function (size inclusion from 400-Infinity). Identified positive regions were refined manually before measurement of the area which were summed and
normalized against the total area of the segmented DRG to determine the percentage positive area for each DRG. Statistical significance was calculated with the Mann–Whitney U test. DRG
DISSOCIATION AND SINGLE-NUCLEI ISOLATION51,52,53 Mice were deeply euthanized by isoflurane and perfused with 4% pre-cooled PBS. L4-L6 DRGs were collected at 14 days after CCI injury in aged
mice or from young mice (without injury), and then immediately put on dry ice. Frozen tissues are stored at −80 °C before nuclei isolation. Isolation of nuclei from frozen tissue was
performed as described by the Allen Institute for Brain Science68,69. All steps were performed in 4 °C. Briefly, tissues were homogenized in 2 ml chilled homogenization buffer (10 mM Tris pH
8, 250 mM Sucrose, 25 mM KCl, 5 mM MgCl2, 0.1 mM DTT, 1× Protease inhibitor cocktail, 0.2 U/μl RNasin Plus, 0.1% Triton X-100), and filtered through 70 µm and 30 µm cell strainers. Nuclei
pellets were collected by 10 min, 900 × _g_ suspension, and then resuspended in 250 μl chilled homogenization buffer. Finally, debris was removed by Iodixanol 25–29%, and the nuclei pellet
was resuspended. For single-nuclei Multiomic sequencing, the nuclei pellet was resuspended in 30 µL 1× chilled nuclei buffer (10x Genomics, 2000207) and then proceeded immediately for
single-nuclei Multiomic sequencing protocol. For neuron-specific- single-nuclei RNA sequencing, the nuclei pellet was resuspended in 500 ul blocking buffer (1× PBS, 1% BSA, 0.2 U/μl RNase
inhibitor) for fluorescent-activated nuclei sorting and Smart-seq3xpress. FLUORESCENT-ACTIVATED NUCLEI SORTING AND SINGLE-NUCLEI RNA SEQUENCING (SMART-SEQ3XPRESS AND 10X MULTIOMIC
SEQUENCING) To enable sorting of nuclei derived from neurons, nuclei suspension was incubated with anti-NeuN PE-conjugated antibody (1:500, FCMAB317PE, Merck) for 30 min on ice. Next, nuclei
pellet was collected by 5 min, 400 × _g_ suspension, and resuspended in PBS containing 0.1 μg/mL DAPI (D3571, Invitrogen) and 0.2 U/ul RNase inhibitor. Single NeuN+ and DAPI+ nuclei were
sorted into each well of a 384-well plate containing 0.3 µL lysis reaction mix by a flow cytometer (DB FACSAria Fusion or BD FACSAria III) at 4 °C. Gating was performed based on DAPI and
phycoerythrin signal of NeuN. After sorting, each plate was immediately spun down and stored at −80 °C before single-nuclei RNA sequencing with Smart-seq3xpress. The smart-seq3xpress
protocol was performed by Rickard Sandberg’s Group, Karolinska Institute. Nuclei isolated for single nuclei Multiomic sequencing were stained with DAPI and sent for sequencing by Eukaryotic
Single Cell Genomics Facility at SciLifeLab, Stockholm. OBTAINING AND PREPROCESSING THE PUBLICLY AVAILABLE SCRNA-SEQ DATA The count matrices and associated metadata of DRG were obtained from
the Gene Expression Omnibus (GEO) with the following accession numbers presented on Table 1. Additionally, the data were preprocessed according to the original papers before being loaded
into Python3 as AnnData objects. PREPROCESSING THE LAB-GENERATED DATA DRG 10X MULTIOMICS The samples were sequenced on NovaSeq6000 (NovaSeq Control Software 1.7.5/RTA v3.4.4) with a
50nt(Read1)−8nt(Index1)−24nt(Index2)−49nt(Read2) (ATAC part) and 28nt(Read1)−10nt(Index1)−10nt(Index2)−90nt(Read2) (GEX part) setup using ‘NovaSeqStandard’ workflow in ‘S2’ mode flowcell.
The Bcl to FastQ conversion was performed using bcl2fastq_v2.20.0.422 from the CASAVA software suite. The quality scale used is Sanger/phred33/Illumina 1.8+. The sequenced reads of each
sample were aligned using Cell Ranger Arc pipeline version 2.0.2 to the mouse genome (mm10). After the alignment, the chromatin peaks from each sample were aggregated together to obtain a
common peak set with “aggr” function from Cell Ranger Arc. The count matrices were loaded into Python3 as AnnData objects. The quality control was done by removing features that were
detected in less than 3 cells, and cells with a the natural log pseudo count (log1p) of the number of genes or peaks less than 4 and more than 9 were removed. Cells with percent
mitochondrial genes of more than 1.5 and a total UMI count of more than 20,000 were also filtered out. SMART-SEQ3 DRG & TG The sequenced reads were aligned using the zUMIs pipeline which
makes use of the STAR-SOLO70 alignment tool, and the reference genome was mouse (mm39). After alignment, the count matrices were loaded into Python3 for analysis. Furthermore, the count
matrices were filtered to only yield high-quality cells. For DRG, genes found in less than 20 cells, and cells with less than 1000 genes were filtered out. For TG, genes detected in less
than 3 cells, and cells with more than 3 percent of mitochondrial genes and less than 2000 detected genes were removed. MAIN UMAP OF DRG The AnnData objects were concatenated to create a
unified AnnData object, and we made use of two models which were based on the scVI71 framework (v0.20.3) for the integration of DRG data. First, we trained the scVI model to integrate the
DRG cells unbiasedly on 3000 highly variable genes. The model architecture was designed to obtain 50 dimensions in the latent space with 5 hidden layers and 128 nodes per hidden layer, where
the distribution of gene likelihood was negative binomial. Then we constructed a scANVI model based on the trained scVI model to obtain the latent space that could clearly separate the
respective cell types for visualization. We used the cell-type nomenclature from Renthal et al. 5 to train the model and perform label transfer. The scANVI model was trained until the model
was converged. After the models were trained, the latent spaces from scVI and scANVI were extracted. The neighbor graph was built from 50 dimensions with 100 neighbors and the method to
calculate the distance was cosine based on the latent space from scANVI. The projection of UMAP of constructed from the neighbor graph with parameter min_dist = 0.5 before plotting. FEATURE
IMPUTATION Next, we train the MultiVI model to imputed for the missing features across data modalities by using our lab-generated multiomics data as an anchor. We aimed to impute as many
features as possible. The MultiVI was constructed by using the default parameters and was trained until it converged. To train the model, we employed NVIDIA A100 GPU to be able to hold the
count matrix on the VRAM, and this resource was provided by the National Academic Infrastructure for Supercomputing in Sweden (NAISS). After the training, the imputation of the gene
expression modality was done by calling get_normalized_expression method from the model, while the chromatin accessibility modality was imputed using get_accessibility_estimates method with
custom parameters of threshold = 0.1, normalize_cells = True, and normalize_regions = True. The imputed matrices were then multiplied by 10,000. ANALYSIS OF THE NOCICEPTIVE LINEAGE CELLS The
nociceptive lineage cells were selected and subset to yield high-resolution clusters. The neighbor graph and UMAP projection were calculated using the same parameters as mentioned above.
Then we clustered the nociceptive lineage cells with the Leiden clustering algorithm at 0.1 resolution. To visualize the distribution of cells along the time kinetic after injury, the
embedding_density method from the Scanpy package was utilized to compute the cell density on the UMAP projection for cells at different timepoints. Next, we ran the pySCENIC72 pipeline to
calculate the regulon activity in the nociceptive lineage. Yet, not all TFs had the information for regulons and thus we fit the univariate linear model (ULM) from the decoupleR73 package by
using the RNA expression of each cell as an independent variable and the interaction weight of each TF from the adjacency table from pySCENIC as a target. The t-value of the slope of the
fitted model represented the TF activity. CELL STATE POTENCY The relative cell state potency of the nociceptive lineage cells was calculated in R using the CytoTrace package. Before running
CytoTrace, we reconstructed the raw count matrix of the gene expression data from the imputed normalized count with the PyTorch distribution module for the negative binomial distribution.
After the reconstruction, the AnnData object was converted into a SingleCellExperiment (SCE) object using rpy2 and anndata2ri Python packages. Once converted, we ran CytoTrace on the
reconstructed raw count matrix with data sources passed to the batch parameter. The CytoTrace was normalized to have the range from 0 to 1. Then we calculated the CytoTrace pseudotime by
taking the difference between 1 and the normalized CytoTrace score. We performed an independent _t_-test with 7000 random permutations on the CytoTrace scores between the naïve and injury
states with the SciPy package to confirm that the score in the naïve state was significantly higher than that of the injured state. TEMPORAL ANALYSIS OF NOCICEPTIVE SUBTYPES We employed
CellRank74 (v2.0.0) to perform the temporal analysis of each nociceptive subtype between control and pain states based on RNA modality. For each subtype, we made use of the CytroTrace kernel
from CellRank to compute the transition matrix. Then we passed the transition matrix CytroTrace kernel to Generalized Perron Cluster-Cluster Analysis (GPCCA) for the identification of
terminal states and fate probability toward the terminal states with n_states=3. With GPCCA, we identified the lineage driver genes that drove the transition of cells toward the terminal
state of pain. A generalized additive model was utilized to fit the expression profile for each gene as a function of pseudotime to visualize the expression trend of the lineage driver
genes. Furthermore, we also applied the same analytical approach on the regulons level calculated from SCENIC. CELL-CELL COMMUNICATION The inference of cell-cell communication (CCC) was done
with the LIANA+75 package (v0.1.8). Here, we passed the count matrix of the atlas as input to the rank_aggregate.by_samplen function of LIANA and we selected “mouseconsensus” as the
resource for CCC inference. Due to multi-conditions and multi-timepoints information held within the atlas, the communications were very complex. Thus, tensor decomposition was employed to
extract meaningful communications as factors. This was accomplished by calling run_tensor_cell2cell_pipeline function provided by the cell2cell28 package. IDENTIFICATION OF SENESCENCE The
SenMayo gene score was calculated based on the scaled data of the imputed gene expression count matrix by using the score_genes function from the Scanpy package. The SenMayo gene set can be
found in Supplementary Data 7. Additionally, we selected cells within the top 10 percentile and assigned them as SASP. To study the relative age of SASP cells, we performed gene set
enrichment analysis with the run_gsea function from the decoupleR73 package to extract the enrichment scores of GenAge and CellAge gene sets. This was done on the normalized unscaled imputed
gene expression count matrix. Mann–Whitney U test was performed to test for the statistical significance of the SenMayo score between the naïve and injury groups. ANALYSIS OF HUMAN DRG
RNA-SEQ WITHIN For the analysis of human DRG RNA-seq, we first obtained the bulk RNA-seq data of different pain conditions of neuron-rich samples from Ray et al.38. As the count matrix was
normalized using the TPM method, we multiplied 1e6 to the matrix to unnormalize it back to the raw transcript count values. Then we normalized the raw count to obtain the total transcript
count per sample after normalization equal to the median of the total transcript count for that sample before normalization. The normalized count matrix was log-transformed and scaled with
log1p and scale functions from Scanpy. SenMayo score was calculated with the score_gene function on the scaled count matrix. Regarding the deconvolution of hDRG, we retrieved the snRNA-seq
of hDRG under normal conditions from Jung et al.39 with the accession number GSE201654 from GEO. The data was preprocessed and analyzed as described in the original paper. The deconvolution
was done using a VAE-based model called Bulk2Single provided by the omicverse76 package in Python3. The bulk RNA-seq data of hDRG was separated into two count matrices, one from donors
without known pain conditions and the other from donors with pain. As the data was split in two, we trained two models separately for 3500 epochs each. After the training, the predicted
snRNA-seq count matrices were reconstructed and merged for further analysis. There were more than 250,000 cells generated by the models in total. We processed and clustered the matrix
according to Scanpy workflow with the Leiden clustering algorithm, and we noticed that there was a lot of noise within the generated data as there were many clusters comprised of 50–1000
cells. Thus, Leiden clusters with less than 900 cells were removed to retain cells with clean signals. Furthermore, we selected only nociceptive cells to calculate the SenMayo score after
scaling the count matrix. Regarding the analysis of hDRG, we noted that the cell proportions between the reference snRNA-seq and the deconvolution of bulk RNA-seq were not equal. This result
was expected as we performed the deconvolution on the samples from the group being classified by the authors as neuron-rich samples36 (51 out of 70 samples), to focus our analysis on
nociceptive lineage cells. The deconvolution yielded ~60% neurons whereas the reference snRNA-seq contained a more representative population of the cell types in DRG with around ~2% neurons.
We thus applied a broad classification on the hDRG in contrast to the single-cell analysis in mice model, as we suspected that the deconvolution model could not perform well in classifying
the high-resolution cell types (neuronal subtypes) that were closely related to each other due to it being trained on the reference sample with lower neuron representation. Nevertheless,
even with the broad classification the model seems to have some difficulties in clearly distinguishing between the two neuronal cell types of NFs and nociceptors that are more highly
correlated than other cell types (Fig. 4h). Despite this, the Spearman correlation still indicated the highest correlation between the transcriptome profiles of the nociceptors identified in
the reference snRNA-seq and the deconvolved RNA-seq nociceptors, indicating the applicability of the model. We then proceeded to perform a SenMayo score comparison between the NoPain and
Pain groups to find that it is increased in the Pain group indicating for cellular senescence, aligning with our other results. ANALYSIS OF HUMAN DRG RNA-SEQ WITH DIABETIC NEUROPATHY The
count matrix was obtained from Hall et al.40. The count matrix was normalized into transcript per million and pseudo-log transformed. The effect of different sexes was regressed out with
Scanpy’s regress_out function. Samples with their ages being outliers between the healthy and diabetic groups were removed; these were samples with ages below 30 and ages above 60. The
SenMayo score was calculated after the matrix was being scaled. The Z-score of SenMayo was computed before performing a one-sided _t_-test to statistically compare the scores between healthy
and diabetic groups. UMAP OF TG For the TG, we generate an integrated atlas separately for TG using scGLUE20 (v0.3.2), by first computing the latent space representation of each source and
modality and passing them as input. For the latent space representation of RNA, we updated the weights of the scANVI model trained on the DRG data to obtain the updated latent space of the
RNA gene expression modality for the TG datasets. LSA was performed on the ATAC modality to obtain the latent semantic indexing from the TG datasets. Furthermore, scGLUE required an
additional input besides the latent space representations which was the guidance graph. The guidance graph was constructed using the highly variable features from RNA and ATAC as described
in the original paper20. After the inputs were prepared, the model was trained with the default parameters. Once the model was trained, we extracted cell embedding from the model to build a
neighbor graph using “cosine” as a metric. The UMAP was computed from the neighbor graph. To facilitate us with cell-type annotation, we perform label transfer using the scANVI model that
was previously updated with the weights. STATISTICAL ANALYSIS The statistical analysis and tests were done in Python3 with the “stats” module from the SciPy v1.10.1 package. The data were
either imported as DataFrame or Array through Pandas v2.0.3 or Numpy v1.22.4 package respectively. In general, a _t_-test was applied when the data followed a normal distribution. Otherwise,
the Mann–Whitney U test was performed if the data did not appear to follow the normal distribution. For the behavior analysis with paired data paired _t_-test was used for comparison, where
an independent _t_-test was used on unpaired data. REPORTING SUMMARY Further information on research design is available in the Nature Portfolio Reporting Summary linked to this article.
DATA AVAILABILITY The sequencing data and count matrices generated from this study have been deposited in the Gene Expression Omnibus (GEO) database under accession code GSE253345. All the
datasets with their GEO accessions used to generate iPain can be found in Table 1. The interactive visualization of the atlases can be accessed through CELLxGENE platform from the Chan
Zuckerberg Initiative (iPain) and UCSC cell browser77. Source data are provided with this paper. CODE AVAILABILITY The script for the core analysis of this work can be found at
https://github.com/PrachTecha/Hadjab_iPain. REFERENCES * Yong, R. J., Mullins, P. M. & Bhattacharyya, N. Prevalence of chronic pain among adults in the United States. _Pain_ 163, e328
(2022). Article PubMed Google Scholar * Queremel Milani, D. A. & Davis, D. D. Pain Management medications. in _StatPearls_ (StatPearls Publishing, Treasure Island, FL, 2023). * The
Lancet Regional Health – Americas. Opioid crisis: addiction, overprescription, and insufficient primary prevention. _Lancet Reg. Health Am._ 23, 100557 (2023). * Usoskin, D. et al. Unbiased
classification of sensory neuron types by large-scale single-cell RNA sequencing. _Nat. Neurosci._ 18, 145–153 (2015). Article CAS PubMed Google Scholar * Renthal, W. et al.
Transcriptional reprogramming of distinct peripheral sensory neuron subtypes after axonal injury. _Neuron_ 108, 128–144.e9 (2020). Article CAS PubMed PubMed Central Google Scholar *
Kupari, J. et al. Single cell transcriptomics of primate sensory neurons identifies cell types associated with chronic pain. _Nat. Commun._ 12, 1510 (2021). Article ADS CAS PubMed PubMed
Central Google Scholar * Couturier, C. P. et al. Single-cell RNA-seq reveals that glioblastoma recapitulates a normal neurodevelopmental hierarchy. _Nat. Commun._ 11, 3406 (2020). Article
ADS CAS PubMed PubMed Central Google Scholar * Otero-Garcia, M. et al. Molecular signatures underlying neurofibrillary tangle susceptibility in Alzheimer’s disease. _Neuron_ 110,
2929–2948.e8 (2022). Article CAS PubMed PubMed Central Google Scholar * Wang, K. et al. Single-cell transcriptomic analysis of somatosensory neurons uncovers temporal development of
neuropathic pain. _Cell Res._ 31, 904–918 (2021). Article CAS PubMed PubMed Central Google Scholar * Avraham, O. et al. Profiling sensory neuron microenvironment after peripheral and
central axon injury reveals key pathways for neural repair. _eLife_ 10, e68457 (2021). Article CAS PubMed PubMed Central Google Scholar * Zhang, C. et al. scRNA-sequencing reveals
subtype-specific transcriptomic perturbations in DRG neurons of PirtEGFPf mice in neuropathic pain condition. _eLife_ 11, e76063 (2022). Article CAS PubMed PubMed Central Google Scholar
* Sharma, N. et al. The emergence of transcriptional identity in somatosensory neurons. _Nature_ 577, 392–398 (2020). Article ADS CAS PubMed PubMed Central Google Scholar * Parpaite,
T. et al. Patch-seq of mouse DRG neurons reveals candidate genes for specific mechanosensory functions. _Cell Rep._ 37, 109914 (2021). Article CAS PubMed PubMed Central Google Scholar
* Yang, L. et al. Human and mouse trigeminal ganglia cell atlas implicates multiple cell types in migraine. _Neuron_ 110, 1806–1821.e8 (2022). Article CAS PubMed PubMed Central Google
Scholar * Jia, S. et al. Single-cell RNA sequencing reveals distinct transcriptional features of the purinergic signaling in mouse trigeminal ganglion. _Front. Mol. Neurosci._ 15, 1038539
(2022). Article CAS PubMed PubMed Central Google Scholar * Nguyen, M. Q., Wu, Y., Bonilla, L. S., von Buchholtz, L. J & Ryba, N. J. P. Diversity amongst trigeminal neurons revealed
by high throughput single cell sequencing. _PLoS ONE_ 12, e0185543 (2017). Article PubMed PubMed Central Google Scholar * Liu, Q. et al. Transcriptional alterations of mouse trigeminal
ganglion neurons following orofacial inflammation revealed by single-cell analysis. _Front. Cell. Neurosci._ 16, 885569 (2022). Article CAS PubMed PubMed Central Google Scholar * Xu, C.
et al. Probabilistic harmonization and annotation of single-cell transcriptomics data with deep generative models. _Mol. Syst. Biol._ 17, e9620 (2021). Article PubMed PubMed Central
Google Scholar * Ashuach, T. et al. MultiVI: deep generative model for the integration of multimodal data. _Nat. Methods_ 20, 1222–1231 (2023). Article CAS PubMed PubMed Central Google
Scholar * Cao, Z.-J. & Gao, G. Multi-omics single-cell data integration and regulatory inference with graph-linked embedding. _Nat. Biotechnol._ 40, 1458–1466 (2022). Article CAS
PubMed PubMed Central Google Scholar * The Condition of Neuropathic Pain. in _Neuropathic Pain: Causes, Management and Understanding_ (eds. Toth, C. & Moulin, D. E.) 33–100 (Cambridge
Univ. Press, Cambridge, 2013). * Ma, T. C. & Willis, D. E. What makes a RAG regeneration associated? _Front. Mol. Neurosci._ 8, 43 (2015). Article PubMed PubMed Central Google
Scholar * Huebner, E. A. & Strittmatter, S. M. Axon regeneration in the peripheral and central nervous systems. _Results Probl. Cell Differ._ 48, 339–351 (2009). CAS PubMed PubMed
Central Google Scholar * La Manno, G. et al. RNA velocity of single cells. _Nature_ 560, 494–498 (2018). Article ADS PubMed PubMed Central Google Scholar * Gulati, G. S. et al.
Single-cell transcriptional diversity is a hallmark of developmental potential. _Science_ 367, 405–411 (2020). Article ADS CAS PubMed PubMed Central Google Scholar * Wolf, F. A. et al.
PAGA: graph abstraction reconciles clustering with trajectory inference through a topology preserving map of single cells. _Genome Biol._ 20, 59 (2019). Article PubMed PubMed Central
Google Scholar * Le, D. et al. Neuropathic pain development following nerve injury is mediated by SOX11-ARID1A-SOCS3 transcriptional regulation in the spinal cord. _Mol. Biol. Rep._ 51, 281
(2024). Article CAS PubMed Google Scholar * Armingol, E. et al. Context-aware deconvolution of cell–cell communication with Tensor-cell2cell. _Nat. Commun._ 13, 3665 (2022). Article
ADS CAS PubMed PubMed Central Google Scholar * Mijit, M., Caracciolo, V., Melillo, A., Amicarelli, F. & Giordano, A. Role of p53 in the regulation of cellular senescence.
_Biomolecules_ 10, 420 (2020). Article CAS PubMed PubMed Central Google Scholar * Schmitt, C. A. et al. A senescence program controlled by p53 and p16INK4a contributes to the outcome of
cancer therapy. _Cell_ 109, 335–346 (2002). Article CAS PubMed Google Scholar * Hafner, A., Bulyk, M. L., Jambhekar, A. & Lahav, G. The multiple mechanisms that regulate p53
activity and cell fate. _Nat. Rev. Mol. Cell Biol._ 20, 199–210 (2019). Article CAS PubMed Google Scholar * Saul, D. et al. A new gene set identifies senescent cells and predicts
senescence-associated pathways across tissues. _Nat. Commun._ 13, 4827 (2022). Article ADS CAS PubMed PubMed Central Google Scholar * de Magalhães, J. P., Curado, J. & Church, G.
M. Meta-analysis of age-related gene expression profiles identifies common signatures of aging. _Bioinformatics_ 25, 875–881 (2009). Article PubMed PubMed Central Google Scholar *
Saito-Diaz, K., Street, J. R., Ulrichs, H. & Zeltner, N. Derivation of peripheral nociceptive, mechanoreceptive, and proprioceptive sensory neurons from the same culture of human
pluripotent stem cells. _Stem Cell Rep._ 16, 446–457 (2021). Article Google Scholar * Luo, D., Luo, L., Lin, R., Lin, L. & Lin, Q. Brain-derived neurotrophic factor and Glial cell
line-derived neurotrophic factor expressions in the trigeminal root entry zone and trigeminal ganglion neurons of a trigeminal neuralgia rat model. _Anat. Rec._ 303, 3014–3023 (2020).
Article CAS Google Scholar * Mjåset, C. & Russell, M. B. Secondary chronic cluster headache due to trigeminal nerve root compression. _Acta Neurol. Scand._ 122, 373–376 (2010).
Article PubMed Google Scholar * Tao, R. et al. Using RNA-seq to explore the hub genes in the trigeminal root entry zone of rats by compression injury. _Pain Physician_ 24, E573–E581
(2021). PubMed Google Scholar * Ray, P. R. et al. RNA profiling of human dorsal root ganglia reveals sex differences in mechanisms promoting neuropathic pain. _Brain_ 146, 749–766 (2023).
Article PubMed Google Scholar * Jung, M. et al. Cross-species transcriptomic atlas of dorsal root ganglia reveals species-specific programs for sensory function. _Nat. Commun._ 14, 366
(2023). Article ADS CAS PubMed PubMed Central Google Scholar * Hall, B. E. et al. Transcriptomic analysis of human sensory neurons in painful diabetic neuropathy reveals inflammation
and neuronal loss. _Sci. Rep._ 12, 4729 (2022). Article ADS CAS PubMed PubMed Central Google Scholar * Chaib, S., Tchkonia, T. & Kirkland, J. L. Cellular senescence and senolytics:
the path to the clinic. _Nat. Med._ 28, 1556–1568 (2022). Article CAS PubMed PubMed Central Google Scholar * Bergsland, M., Werme, M., Malewicz, M., Perlmann, T. & Muhr, J. The
establishment of neuronal properties is controlled by Sox4 and Sox11. _Genes Dev._ 20, 3475–3486 (2006). Article CAS PubMed PubMed Central Google Scholar * Bhattaram, P. et al.
Organogenesis relies on SoxC transcription factors for the survival of neural and mesenchymal progenitors. _Nat. Commun._ 1, 9 (2010). Article ADS PubMed Google Scholar * Chen, P. et al.
Identification of Slc6a19os and SOX11 as two novel essential genes in neuropathic pain using integrated bioinformatic analysis and experimental verification. _Front. Neurosci._ 15, 627945
(2021). Article PubMed PubMed Central Google Scholar * Bhuiyan, S. A. et al. Harmonized cross-species cell atlases of trigeminal and dorsal root ganglia. _Sci. Adv._ 10, eadj9173 (2024).
Article PubMed Google Scholar * Muralidharan, A. et al. Long-term male-specific chronic pain via telomere- and p53‑mediated spinal cord cellular senescence. _J. Clin. Invest._ 132,
e151817 (2022). Article CAS PubMed PubMed Central Google Scholar * Paramos-de-Carvalho, D. et al. Targeting senescent cells improves functional recovery after spinal cord injury. _Cell
Rep._ 36, 109334 (2021). Article CAS PubMed Google Scholar * Donovan, L. J. et al. _Aging and injury drive neuronal senescence in the dorsal root ganglia_. Preprint at _bioRxiv_
https://doi.org/10.1101/2024.01.20.576299 (2024). * Wolf, F. A., Angerer, P. & Theis, F. J. SCANPY: large-scale single-cell gene expression data analysis. _Genome Biol._ 19, 15 (2018).
Article PubMed PubMed Central Google Scholar * Program, C. S.-C. B. et al. _CZ CELL×GENE Discover: a single-cell data platform for scalable exploration, analysis and modeling of
aggregated data_. Preprint at _bioRxiv_ https://doi.org/10.1101/2023.10.30.563174 (2023). * Sommer, C. Neuropathic pain model, chronic constriction injury. in _Encyclopedia of Pain_ (eds
Schmidt, R. F. & Willis, W. D.) 1290–1292 (Springer, Berlin, Heidelberg, 2007). * Bennett, G. J. & Xie, Y.-K. A peripheral mononeuropathy in rat that produces disorders of pain
sensation like those seen in man. _Pain_ 33, 87–107 (1988). Article PubMed Google Scholar * Guan, Y. et al. Mas-related G-protein–coupled receptors inhibit pathological pain in mice.
_Proc. Natl Acad. Sci. USA_ 107, 15933–15938 (2010). Article ADS CAS PubMed PubMed Central Google Scholar * Chaplan, S. R., Bach, F. W., Pogrel, J. W., Chung, J. M. & Yaksh, T. L.
Quantitative assessment of tactile allodynia in the rat paw. _J. Neurosci. Methods_ 53, 55–63 (1994). Article CAS PubMed Google Scholar * Bonin, R. P., Bories, C. & De Koninck, Y. A
simplified up-down method (SUDO) for measuring mechanical nociception in rodents using von Frey filaments. _Mol. Pain._ 10, 26 (2014). Article PubMed PubMed Central Google Scholar *
Hargreaves, K., Dubner, R., Brown, F., Flores, C. & Joris, J. A new and sensitive method for measuring thermal nociception in cutaneous hyperalgesia. _Pain_ 32, 77–88 (1988). Article
CAS PubMed Google Scholar * Feng, X. et al. Direct inhibition of microglia activation by pretreatment with botulinum neurotoxin a for the prevention of neuropathic pain. _Front.
Neurosci._ 15, 760403 (2021). Article PubMed PubMed Central Google Scholar * Rinwa, P. et al. Demise of nociceptive Schwann cells causes nerve retraction and pain hyperalgesia. _Pain_
162, 1816–1827 (2021). Article CAS PubMed PubMed Central Google Scholar * Yoon, C., Wook, Y. Y., Sik, N. H., Ho, K. S. & Mo, C. J. Behavioral signs of ongoing pain and cold
allodynia in a rat model of neuropathic pain. _Pain_ 59, 369–376 (1994). Article PubMed Google Scholar * La-Vu, M., Tobias, B. C., Schuette, P. J. & Adhikari, A. To approach or avoid:
an introductory overview of the study of anxiety using rodent assays. _Front. Behav. Neurosci._ 14, 145 (2020). Article PubMed PubMed Central Google Scholar * Walf, A. A. & Frye, C.
A. The use of the elevated plus maze as an assay of anxiety-related behavior in rodents. _Nat. Protoc._ 2, 322–328 (2007). Article CAS PubMed PubMed Central Google Scholar * Carter, R.
J., Morton, J. & Dunnett, S. B. Motor coordination and balance in rodents. _Curr. Protoc. Neurosci._ 15, 8.12.1–8.12.14 (2001). Article Google Scholar * Tung, V. W. K., Burton, T. J.,
Dababneh, E., Quail, S. L. & Camp, A. J. Behavioral assessment of the aging mouse vestibular system. _J. Vis. Exp._ https://doi.org/10.3791/51605 (2014). * Deacon, R. M. J. Measuring
motor coordination in mice. _J. Vis. Exp._ https://doi.org/10.3791/2609 (2013) * Luong, T. N., Carlisle, H. J., Southwell, A. & Patterson, P. H. Assessment of motor balance and
coordination in mice using the balance beam. _J. Vis. Exp._ https://doi.org/10.3791/2376 (2011). * Ruifrok, A. C. & Johnston, D. A. Quantification of histochemical staining by color
deconvolution. _Anal. Quant. Cytol. Histol._ 23, 291–299 (2001). CAS PubMed Google Scholar * Landini, G., Martinelli, G. & Piccinini, F. Colour deconvolution: stain unmixing in
histological imaging. _Bioinformatics_ 37, 1485–1487 (2021). Article CAS PubMed Google Scholar * Allen Institute for Brain Science. Isolation of Nuclei from Human or NHP Brain Tissue.
protocols.io https://doi.org/10.17504/protocols.io.ewov149p7vr2/v3 (2024). * Parekh, S., Ziegenhain, C., Vieth, B., Enard, W. & Hellmann, I. zUMIs - a fast and flexible pipeline to
process RNA sequencing data with UMIs. _GigaScience_ 7, giy059 (2018). Article PubMed PubMed Central Google Scholar * Kaminow, B., Yunusov, D. & Dobin, A. STARsolo: accurate, fast
and versatile mapping/quantification of single-cell and single-nucleus RNA-seq data. Preprint at _bioRxiv_ https://doi.org/10.1101/2021.05.05.442755 (2021). * Gayoso, A. et al. A Python
library for probabilistic analysis of single-cell omics data. _Nat. Biotechnol._ 40, 163–166 (2022). Article CAS PubMed Google Scholar * Van de Sande, B. et al. A scalable SCENIC
workflow for single-cell gene regulatory network analysis. _Nat. Protoc._ 15, 2247–2276 (2020). Article PubMed Google Scholar * Badia-i-Mompel, P. et al. decoupleR: ensemble of
computational methods to infer biological activities from omics data. _Bioinform. Adv._ 2, vbac016 (2022). Article PubMed PubMed Central Google Scholar * Lange, M. et al. CellRank for
directed single-cell fate mapping. _Nat. Methods_ 19, 159–170 (2022). Article CAS PubMed PubMed Central Google Scholar * Dimitrov, D. et al. LIANA+: an all-in-one cell-cell
communication framework. Preprint at _bioRxiv_ https://doi.org/10.1101/2023.08.19.553863 (2023). * Zeng, Z. et al. A single pipeline for exploring the entire transcriptome universe. Preprint
at _bioRxiv_ https://doi.org/10.1101/2023.06.06.543913 (2023). * Speir, M. L. et al. UCSC Cell Browser: visualize your single-cell data. _Bioinformatics_ 37, 4578–4580 (2021). Article CAS
PubMed PubMed Central Google Scholar Download references ACKNOWLEDGEMENTS The authors are grateful to Professor Francois Lallemend and team members for discussion and proofreading the
manuscript. The authors are grateful to Professor Patrik Ernfors and team members, especially Doctors Jie Su and Mingdong Zhang for training in performing pain models and pain behavior
assessments. The authors are grateful to Doctor Marek Bartosovic for the discussion on epigenomic analysis. The authors thank Doctor Olga Kharchenko for drawings, Doctor Sylvain Peuget for
the gift of the p21 antibody. The authors would like to acknowledge the KI innovation, Bic facility, the BFC facility, the Animal Behavior Core Facility at Karolinska Institutet, the
Eukaryotic Single Cell Genomics (ESCG) Facility, and the National Genomics Infrastructure (NGI) at the Science for Life Laboratory, Sweden, for the sc/snRNA-seq. The authors acknowledge
support from the National Genomics Infrastructure in Stockholm funded by Science for Life Laboratory, the Knut and Alice Wallenberg Foundation and the Swedish Research Council, and
SNIC/Uppsala Multidisciplinary Center for Advanced Computational Science for assistance with massively parallel sequencing and access to the UPPMAX computational infrastructure. The
computations and data handling were enabled by resources provided by the National Academic Infrastructure for Supercomputing in Sweden (NAISS) partially funded by the Swedish Research
Council through grant agreement no. 2022-06725. S.H., P.T., and K.Z. are supported by the KID funding at Karolinska Institutet, S.H. and X.F. are supported by the Wenner Gren Foundation.
S.H. was further supported by StratNeuro, Tysta Skolan, the Swedish Research Council, and Hjärnfonden. FUNDING Open access funding provided by Karolinska Institute. AUTHOR INFORMATION Author
notes * These authors contributed equally: Prach Techameena, Xiaona Feng. AUTHORS AND AFFILIATIONS * Laboratory of Neurobiology of Pain & Therapeutics, Department of Neuroscience,
Karolinska Institutet, Stockholm, Sweden Prach Techameena, Xiaona Feng, Kaiwen Zhang & Saida Hadjab Authors * Prach Techameena View author publications You can also search for this
author inPubMed Google Scholar * Xiaona Feng View author publications You can also search for this author inPubMed Google Scholar * Kaiwen Zhang View author publications You can also search
for this author inPubMed Google Scholar * Saida Hadjab View author publications You can also search for this author inPubMed Google Scholar CONTRIBUTIONS Study design and supervision: S.H.
Tissue collection and acquisition of data: X.F., K.Z., P.T., and S.H. Animal behavior: X.F. and K.Z. Analysis of data: P.T., X.F., K.Z, and S.H. Computational analysis and integrated
atlases: P.T. under supervision of S.H. Figures: P.T. and S.H. with input from all co-authors. Drafting of manuscript: P.T., K.Z., and S.H. with input from X.F. CORRESPONDING AUTHOR
Correspondence to Saida Hadjab. ETHICS DECLARATIONS COMPETING INTERESTS S.H. is an inventor on pending patents describing senolytic compounds for the treatment of a headache disorder and/or
chronic pain (application numbers # 2351493-8 and # 2450321-1). The other authors do not have competing interests. PEER REVIEW PEER REVIEW INFORMATION _Nature Communications_ thanks Yi Zhang
and the other anonymous reviewer(s) for their contribution to the peer review of this work. A peer review file is available. ADDITIONAL INFORMATION PUBLISHER’S NOTE Springer Nature remains
neutral with regard to jurisdictional claims in published maps and institutional affiliations. SUPPLEMENTARY INFORMATION SUPPLEMENTARY INFORMATION PEER REVIEW FILE DESCRIPTION OF ADDITIONAL
SUPPLEMENTARY FILES SUPPLEMENTARY DATA 1 SUPPLEMENTARY DATA 2 SUPPLEMENTARY DATA 3 SUPPLEMENTARY DATA 4 SUPPLEMENTARY DATA 5 SUPPLEMENTARY DATA 6 SUPPLEMENTARY DATA 7 SUPPLEMENTARY DATA 8
REPORTING SUMMARY SOURCE DATA SOURCE DATA RIGHTS AND PERMISSIONS OPEN ACCESS This article is licensed under a Creative Commons Attribution 4.0 International License, which permits use,
sharing, adaptation, distribution and reproduction in any medium or format, as long as you give appropriate credit to the original author(s) and the source, provide a link to the Creative
Commons licence, and indicate if changes were made. The images or other third party material in this article are included in the article’s Creative Commons licence, unless indicated
otherwise in a credit line to the material. If material is not included in the article’s Creative Commons licence and your intended use is not permitted by statutory regulation or exceeds
the permitted use, you will need to obtain permission directly from the copyright holder. To view a copy of this licence, visit http://creativecommons.org/licenses/by/4.0/. Reprints and
permissions ABOUT THIS ARTICLE CITE THIS ARTICLE Techameena, P., Feng, X., Zhang, K. _et al._ The single-cell transcriptomic atlas iPain identifies senescence of nociceptors as a
therapeutical target for chronic pain treatment. _Nat Commun_ 15, 8585 (2024). https://doi.org/10.1038/s41467-024-52052-8 Download citation * Received: 07 May 2024 * Accepted: 21 August 2024
* Published: 04 October 2024 * DOI: https://doi.org/10.1038/s41467-024-52052-8 SHARE THIS ARTICLE Anyone you share the following link with will be able to read this content: Get shareable
link Sorry, a shareable link is not currently available for this article. Copy to clipboard Provided by the Springer Nature SharedIt content-sharing initiative