Isolated theta waves originating from the midline thalamus trigger memory reactivation during nrem sleep in mice
- Select a language for the TTS:
- UK English Female
- UK English Male
- US English Female
- US English Male
- Australian Female
- Australian Male
- Language selected: (auto detect) - EN
Play all audios:

ABSTRACT During non-rapid eye movement (NREM) sleep, neural ensembles in the entorhinal-hippocampal circuit responsible for encoding recent memories undergo reactivation to facilitate the
process of memory consolidation. This reactivation is widely acknowledged as pivotal for the formation of stable memory and its impairment is closely associated with memory dysfunction. To
date, the neural mechanisms driving the reactivation of neural ensembles during NREM sleep remain poorly understood. Here, we show that the neural ensembles in the medial entorhinal cortex
(MEC) that encode spatial experiences exhibit reactivation during NREM sleep. Notably, this reactivation consistently coincides with isolated theta waves. In addition, we found that the
nucleus reuniens (RE) in the midline thalamus exhibits typical theta waves during NREM sleep, which are highly synchronized with those occurring in the MEC in male mice. Closed-loop
optogenetic inhibition of the RE-MEC pathway specifically suppressed these isolated theta waves, resulting in impaired reactivation and compromised memory consolidation following a spatial
memory task in male mice. The findings suggest that theta waves originating from the ventral midline thalamus play a role in initiating memory reactivation and consolidation during sleep.
SIMILAR CONTENT BEING VIEWED BY OTHERS SLEEP LOSS DIMINISHES HIPPOCAMPAL REACTIVATION AND REPLAY Article 12 June 2024 COORDINATED NREM SLEEP OSCILLATIONS AMONG HIPPOCAMPAL SUBFIELDS MODULATE
SYNAPTIC PLASTICITY IN HUMANS Article Open access 01 October 2024 THE HUMAN THALAMUS ORCHESTRATES NEOCORTICAL OSCILLATIONS DURING NREM SLEEP Article Open access 05 September 2022
INTRODUCTION Neural ensemble interactions in the medial entorhinal cortex (MEC)-hippocampal circuit support learning and memory1,2,3. During wakefulness, specific neural ensembles are
activated, exhibiting theta and gamma oscillations, to achieve encoding and retrieval of memories with the help of wakefulness-promoting systems4,5,6,7,8,9. These neural ensembles are
reactivated during non-rapid eye movement (NREM) sleep, coordinated by network oscillatory events known as sharp-wave ripples (SWRs) and cortical spindles. Reactivation during NREM sleep is
considered as one of the cellular hallmarks of memory and plays a necessary role in the formation of stable memory10,11,12. The impairment of reactivation is closely linked to memory
dysfunction and may contribute to cognitive decline in those with Alzheimer’s disease13,14,15. However, to date, the neural mechanisms responsible for the generation of memory-related neural
ensemble reactivation during sleep still remain elusive. The elucidation of these mechanisms has become a fundamental concern in understanding the role of sleep in the memory consolidation.
The reactivation of neural ensembles and the associated high-frequency network oscillations in the MEC generally necessitates excitatory subcortical inputs, as it cannot be solely achieved
by the MEC alone16,17,18,19. The MEC-hippocampal circuit receives various external inputs, including wakefulness-promoting neurons, such as cholinergic neurons in the basal
forebrain6,7,8,20, histaminergic and hypocretinergic neurons in the hypothalamus4,5, as well as inputs from the midline thalamus21,22. In fact, these cholinergic and monoaminergic neurons
exhibit peak activity during wakefulness, driving the high-frequency oscillations like theta and gamma oscillations required for memory encoding and recall during wakefulness. However,
following the transition from wakefulness to NREM sleep, their firing activity significantly diminished, suggesting a limited role in driving reactivation and high-frequency oscillatory
events during NREM sleep4,7,8,20. In contrast, the midline thalamic neurons display distinct characteristics compared to these wakefulness-promoting neurons and continue to exhibit burst
firing during NREM sleep21,23. Additionally, many studies have reported that midline thalamus is implicated in the memory performance21,24,25,26,27. Therefore, we hypothesize that the
midline thalamus may play a crucial role in driving reactivation of neural ensembles associated with memory consolidation during NREM sleep. We focused specifically on the MEC associated
with spatial memory, and demonstrated that isolated theta waves, nested within the delta waves, are in concert with the reactivation of MEC cells during NREM sleep after spatial memory
training. In addition to the previously reported neocortical slow oscillations (SO)-coupled spindle waves and hippocampal SWRs10,28, our present results unveil that isolated theta waves
serve as the sign of memory replay. Concurrently, we show that the nucleus reuniens (RE) in the midline thalamus exhibits isolated theta waves which propagate to the MEC and trigger memory
reactivation in the MEC. Taken together, this study identifies a network oscillation pattern associated with memory consolidation during sleep and reveals that the midline thalamus has a
unique role in this process. RESULTS THE REACTIVATION OF CELL ENSEMBLES MANIFESTS AS ISOLATED THETA WAVES DURING NREM SLEEP To explore whether the MEC replays waking experience, we developed
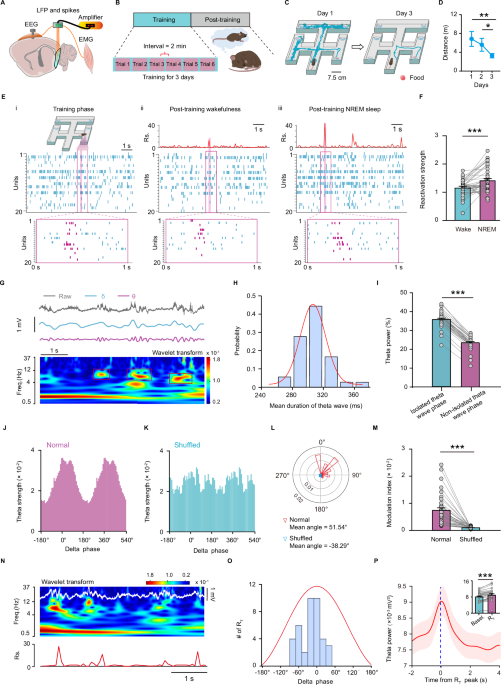
a six-arm maze task to assess the spatial memory, in which animals had to learn to select the rewarded arm. After six trials per day for consecutive three days of training during light
phase (12:00 P.M.−18:00 P.M.), the animal gradually gained stable spatial memory, manifested as reaching the rewarded arm with a shorter path (Fig. 1A–D). According to previous reports on
the effect of different sleep duration on memory consolidation, spatial memory consolidation could be effectively achieved within 1 h after training with 15–30 min NREM sleep29,30,31.
Therefore, we recorded spikes and local field potentials (LFP) from the superficial layers of the MEC, in conjunction with electroencephalography (EEG) and electromyography (EMG) recordings,
immediately after spatial memory training during the light phase. During this phase, animals spent about 50% of the time in the NREM sleep on average; however, they spent very little time
in rapid eye movement (REM) sleep (Supplementary Fig. 1). Therefore, we focused only on NREM sleep in the subsequent analyses. A total of 117 and 129 neurons were recorded on day 1 and day
2, with putative interneurons comprising only 18% and 13%, respectively. We used principal components (PC) analysis to extract the firing patterns of all the neurons during the learning
phase. High-rank PC, associated with larger eigenvalues that exceeded the signal threshold defined as the theoretical upper bound for eigenvalues in the case of random spike trains, were
referred to as signal PC. After detecting the signal PC, we calculated the reactivation strength during post-training sleep. Of note, high reactivation strength reflects that the firing
pattern during NREM sleep is a closer match to learning-related firing pattern32,33. Figure 1E shows an example of a firing pattern of MEC neurons with a signal PC and corresponding
reactivation strength during post-training NREM sleep and wakefulness. Of note, high reactivation strength was detected during NREM sleep rather than wakefulness. On average, a significant
increase in the strength of reactivation events was observed during the NREM sleep period relative to post-training wakefulness (Fig. 1F and Supplementary Fig. 2A–D). There was no
significant difference in the average reactivation strength during NREM sleep between the first and second day of training (because the mice had already acquired stable spatial memory by the
third day of testing, we focused on memory consolidation only after the first and second days of training) (Supplementary Fig. 2E). To further analyze the spatial memory features reflected
by the detected signal PC that were reactivated during NREM sleep, the normalized Z-scores in different positions of the maze were introduced to quantify the activation strength of the
signal PC in each corresponding trial. A higher z-score at specific location in the maze indicates that the signal PC prefers to appear at that location. The preferential position of signal
PC covered the different arms of the maze, including the start arm (cluster 1), turning points (cluster 2), non-reward arms (cluster 3) and reward arm (cluster 4) (Supplementary Fig. 2F–H).
The cluster 1 and 2 accounted for the proportion of 28% and 49%, while the cluster 3 and 4 were 10% and 13%, respectively (Supplementary Fig. 2I). These findings indicated that the firing
patterns of MEC cells were indeed correlated with different parts of the six-arm maze during training phase and reactivated during post-training NREM sleep. Many studies reported that neural
reactivations during NREM sleep are coordinated by prominent network oscillations, e.g. SO-coupled spindle waves in the neocortical regions and SWRs in the hippocampus11,34,35. Yet, the
signature of network oscillatory dynamics reflecting the replay of MEC cells remains unclear. After entering NREM sleep, the delta oscillations (0.5–4 Hz) and low-frequency theta (4–6 Hz)
increased significantly, but the high-frequency theta (6–12 Hz) decreased significantly (Supplementary Fig. 3). After analyzing the power spectrum of the LFP by wavelet transform, discreted
theta events in the MEC recordings were evident during NREM sleep (Fig. 1G). These theta events during NREM sleep lasted about 300 ms (The term “isolated theta waves” is used to describe
these theta events due to their short duration) (Fig. 1H). During isolated theta wave phase, the percentage of theta band power is significantly higher than that of non-isolated theta wave
phase (Fig. 1I). Notably, these isolated theta waves occurred phase-locked to the depolarizing up-state of the delta waves, since the modulation index (MI) was higher compared to that of the
shuffled data (Fig. 1J–M). Additionally, examining data from entire post epoch sessions revealed that reactivation peaks occurred concomitantly with isolated theta waves. Significant
reactivation events (RT), defined as their reactivation values exceeding the threshold (mean plus 3 standard deviation of the reactivation values from entire post NREM sleep epoch sessions),
mainly occurred in the up-state of the delta waves, where prominent isolated theta waves were nested (Fig. 1N, O). Power spectrum analysis further showed that significant reactivation
events were indeed accompanied by stronger theta waves compared to the baseline (inset in Fig. 1P). Altogether, these results suggested that delta waves-nested isolated theta waves are in
concert with the replay of MEC cells. RE EXHIBITS TYPICAL ISOLATED THETA WAVES THAT CAN PROPAGATE TO THE MEC THROUGH EXCITATORY MONOSYNAPTIC TRANSMISSIONS The delta waves have been
considered to primarily generate within cortical networks, where it can occur in the absence of thalamocortical input, and are closely associated with the homeostatic functions of NREM
sleep17,18,19. Nonetheless, the occurrence of high-frequency network oscillations in the neocortex and hippocampus, such as the spindles and theta waves, often requires external excitatory
inputs4,20. Then, we want to determine the excitatory inputs that drive isolated theta waves in the MEC. Using a monosynaptic retrograde tracing technique based on glycoprotein (G)-deleted
rabies virus, we screened the upstream targets of the MEC, which include RE in the midline thalamus, medial septum/diagonal band, hippocampus and piriform cortex (Supplementary Fig. 4A–D).
Among these brain areas, the RE in the midline thalamus has attracted our attention, because the glutamatergic neurons in the RE of the midline thalamic nuclei can generate burst-mode
discharges lasting about hundreds of milliseconds during NREM sleep23,36, which is possible to drive high-frequency oscillatory events in the neocortex. Additionally, RE has been reported to
be involved in cortico-hippocampal interaction and is associated with memory performance21,37,38. Using retrograde neuronal tracing with red retrobeads, we further mapped the distribution
of RE neurons projecting to the MEC and found that this cluster of neurons is mainly located in the RE from 0.46 to 1.82 mm post the bregma (Supplementary Fig. 4E–G). To further determine
the connections between the RE and MEC, we injected AAV2/9-CaMKIIα-mCherry into the RE for anterograde tracing. Notably, the superficial layers of the MEC, rather than the deep layers of the
MEC, contained a high density of mCherry-positive axonal fibers (Supplementary Fig. 4H, I), suggesting that MEC receives prominent inputs from the RE in the midline thalamic nuclei. Next,
we explored the correlation of the functional network activities between RE and MEC across different states in vivo by recording the LFP from both the RE and the superficial layers of the
MEC. After analyzing the power spectrum of the LFP by wavelet transform, theta (4–12 Hz) waves in the RE recordings were also evident during NREM sleep (Fig. 2A–D). Coherence analysis
further indicated that highest synchronized activity was observed in the theta band (5–7 Hz) between RE and MEC during NREM sleep (Fig. 2E). In contrast, the synchronized activity shifted to
the gamma frequency band between these two brain areas when entering the resting and locomotor awake states (Supplementary Fig. 5), suggesting that RE inputs to the MEC may exhibit
correlations with different network oscillations during distinct brain functional states. Furthermore, we conducted a Granger causality analysis to establish the temporal directionality
between RE and MEC. Among the detected theta events during NREM sleep, the calculated F-value, which reflects the strength of the temporal directionality from RE to MEC, exceeded the
critical value for most theta events (Supplementary Fig. 6). This indicates a clear temporal directionality from RE to MEC. Of note, the occurrence of theta oscillations in the hippocampus
is primarily observed during movement and REM sleep. During locomotor awake states, the frequency of theta oscillations in the hippocampus was notably high, surpassing 8 Hz39. Conversely,
synchronized theta activity between RE and MEC exhibited a lower frequency of less than 7 Hz, with these isolated theta oscillations being brief in duration lasting only a few hundred
milliseconds. These findings indicate that isolated theta oscillations in MEC during NREM sleep possess distinct characteristics compared to those recorded during wakefulness. What are the
response properties of MEC cells to RE inputs that contribute to the isolated theta waves during NREM sleep? To test this, we further investigated the functional connections between RE and
MEC by optogenetic stimulation (470 nm, 15 ms light pulse) of the RE afferents, combined with the patch-clamp recordings of the main excitatory neurons and inhibitory interneurons in the
superficial layers of the MEC (Fig. 3A). These types of neurons could be distinguished by their morphology and electrophysiological properties (Fig. 3B, D, left). Optogenetic stimulation of
the RE afferents reliably induced fast excitatory postsynaptic currents (EPSCs) with short latency of 5.45 ± 0.23 ms and 5.19 ± 0.31 ms in 62.5% (15/24) of the excitatory neurons and 51.7%
(15/29) of the inhibitory interneurons, respectively. These excitatory effects observed in the MEC diminished after blockade of ionic glutamatergic receptors (Fig. 3B–E). These results,
combined with the retrograde tracing data, imply the monosynaptic excitatory functional connections between the RE and MEC. We also used different optogenetic stimulation frequencies (1, 5,
10 and 20 Hz) to observe the integration effect of the MEC cells on upstream inputs of RE. Under current-clamp model, 1 Hz, 5 Hz and 10 Hz optogenetic stimulation of the RE afferents
resulted in reliably action potential firing in excitatory neurons, whereas 20 Hz stimuli induced a weaker increase in discharge frequency as compared 10 Hz. The efficiency of action
potential generation in inhibitory interneurons is comparatively lower for stimuli of different frequencies compared to excitatory neurons (Fig. 3F, G). Consistently, using voltage-clamp
mode to record the evoked EPSCs, we found that MEC cells exhibit distinct effects to different frequency stimuli of the RE afferents, with the strong integration to 5 Hz and 10 Hz stimuli,
while the response to higher frequency (20 Hz) stimuli is weaker. As for different cell types, the response of excitatory neurons is much greater than that of inhibitory interneurons
(Supplementary Fig. 7A, B). Together, these results indicate that MEC neurons efficiently integrate monosynaptic and excitatory inputs of RE in vitro. Why do RE neurons and MEC inhibitory
interneurons have a direct connection that does not efficiently produce action potential output in vitro? One possible explanation could be the absence of wakefulness-promoting
neuromodulators, such as acetylcholine, which is widely distributed in the MEC-hippocampal circuit and strongly associated with spatial memory6,40,41. In isolated brain slices, this lack of
neuromodulation leads to hyperpolarization and impairs the effective generation of action potentials. To verify this, we first depolarized the membrane potential of the interneurons with an
average increment of 17.5 mV, in which case activating the RE afferents did induce significant action potentials in the MEC inhibitory interneurons (Fig. 3H–J). Furthermore, bath application
of the wakefulness-promoting neuromodulator acetylcholine does significantly induce depolarization of the inhibitory interneurons in isolated brain slices, an effect that may enable these
neurons to effectively respond to exogenous excitatory inputs of the RE neurons (Supplementary Fig. 7C–E). In sum, these results imply that the RE may drive different functional activity
patterns of MEC in different states. During NREM sleep, the level of wakefulness-promoting neuromodulators such as acetylcholine is low, which may preferentially drive MEC to produce theta
frequency network oscillations. In the awake state, on the other hand, the level of acetylcholine are higher, and it could efficiently excite the inhibitory interneurons. Given the important
role of inhibitory interneurons in driving high-frequency network oscillations, such as gamma oscillations42,43, it is likely that during the wake period, RE can drive MEC to produce higher
frequency oscillations such as gamma oscillations during wakefulness. To further specifically investigate the correlation of the activities between of these two brain regions, we used
photometry to selectively record the activity of the RE neurons projecting to MEC, and simultaneously recorded the LFP of the MEC (Fig. 4A, B). After the transitions from awakening to NREM
sleep, the calcium (Ca2+) activity of these RE neurons was significantly decreased (Supplementary Fig. 8A, B). In contrast, the Ca2+ activity of these cells was significantly increased after
entering wakefulness from NREM sleep (Supplementary Fig. 8C, D). Although their activity decreased, the RE neurons projecting to MEC also exhibited discontinuous Ca2+ events during NREM
sleep (Fig. 4C). The frequency of these Ca2+ activity events was increased, but the amplitude was significantly reduced, compared with the awake state (Supplementary Fig. 8E, F). These
results are consistent with previous reports that during NREM sleep the RE neurons still exhibit rhythmic burst-mode discharge23,36. Interestingly, when Ca2+ peaks appeared, reflected that
neurons projecting to MEC were activated during NREM sleep, MEC exhibited strong theta wave activity (Fig. 4D–G), suggesting that the activity of this group of cells was positively
correlated with the MEC theta event power. We also specifically recorded the activities of RE neurons projecting to medial prefrontal cortex (mPFC) and hippocampal CA1, while simultaneously
collecting LFP in the MEC (Supplementary Fig. 9A, G). Interestingly, neither the activity of RE neurons projecting to mPFC (Supplementary Fig. 9B–F) nor those projecting to the CA1
(Supplementary Fig. 9H–L) exhibited a positive correlation with MEC theta oscillations. These control experiments further support that only RE neurons projecting to MEC are specifically
correlated with MEC theta oscillations. In addition, if the isolated theta waves in the MEC originate from the RE inputs during NREM sleep, the spikes recorded in the RE should be correlated
with the theta waves in the MEC. To test this, a total of 104 cells were recorded from the RE, and on average, their discharge frequency during awakening was higher than that during NREM
sleep (Supplementary Fig. 10A, B). Indeed, we found that the firing of 26% neurons was concentrated at a relatively fixed phase of delta waves-nested theta waves of the MEC during NREM sleep
(Supplementary Fig. 10C–E). These results imply the activation of RE neurons may contribute to the isolated theta waves during NREM sleep. RE TRIGGERS ISOLATED THETA WAVES-RELATED MEMORY
REACTIVATION The overarching aim of this project was to elucidate the underlying mechanisms responsible for the reactivation of the MEC cells. The data so far pointed to the need to change
our focus to the RE neuron projections to the MEC as likely mediator of this role, because of the correlation between the RE activity and the MEC isolated theta waves during NREM sleep. To
test this, we chemogenetically inhibited RE-MEC pathway by injecting AAV2/9-CaMKIIα-hM4D-mCherry or AAV2/9-CaMKIIα-mCherry as control into the RE combined with implantation of cannula into
the MEC (Fig. 5A). In vitro patch-clamp recordings of the RE neurons expressing hM4D-mCherry validated that Clozapine N-oxide (CNO) significantly inhibited neuronal firing rates (Fig. 5B,
C). The application of CNO also significantly reduced the firing frequency of MEC cells, accompanied by a specific decrease in the frequency of spontaneous excitatory postsynaptic currents
(sEPSCs) while leaving the amplitude of sEPSCs unaffected (Supplementary Fig. 11). These findings demonstrate the efficacy of this chemogenetic approach. After the mice were trained in the
six-arm maze, CNO (5 μM) was injected immediately into the MEC to inhibit the RE-MEC pathway in vivo (Fig. 5D–F). Chemogenetic inhibition of this pathway can remarkably prolong the distance
to find the target arm and increase the number of errors entering the non-target arms (Fig. 5G–I), indicating the impairment of spatial memory consolidation after inhibition of this pathway.
Although chemogenetic inhibition demonstrated the necessity of RE-MEC pathway in spatial memory consolidation, it is not yet clear whether this pathway affects memory consolidation by
affecting the isolated theta waves and replay of the MEC cells. On this basis, we further adopted closed-loop optogenetic approach to specifically trigger the inhibition of RE-MEC pathway
following a few milliseconds of the isolated theta wave detection during NREM sleep (Fig. 6A). Closed-loop optogenetic interventions were performed by selectively expressing the ArchT3.0
fused to eYFP or eYFP alone in the MEC-projecting RE neurons (Supplementary Fig. 12A, B). Once a theta event was detected, yellow laser (300 ms, 20 mW) was triggered to inhibit RE-MEC
pathway. The duration of 300 ms yellow laser stimulation was selected primarily based on the fact that the average duration of theta events was ~300 ms. Closed-loop optogenetic inhibition of
the RE-MEC pathway effectively reduced theta wave power (Supplementary Fig. 12C, D), decreased the coupling strength of the delta wave and isolated theta waves during NREM sleep, and
altered the preferred phase in which isolated theta waves are coupled to delta waves (Fig. 6B–D). In parallel, closed-loop optogenetic inhibition of the RE-MEC pathway caused a remarkable
decrease in the reactivation strength of the learning-related MEC cell ensembles during the subsequent NREM sleep (Fig. 6E–G). At the behavioral level, closed-loop optogenetic inhibition
caused impairment of spatial memory consolidation, reflected by prolonged distance to find the target arm and the increases in the number of errors entering the non-target arms (Fig. 6H–J).
Optogenetic manipulation of RE-MEC pathway had no effects on post-training sleep-wakefulness architecture and EEG power spectrum (Supplementary Fig. 12E–I), which ruled out the impairment of
memory consolidation caused by the change of sleep–wake state. Considering that RE projections can also extend to the mPFC, we aim to investigate the impact of RE inputs on network
oscillations of the mPFC during NREM sleep. After optogenetic inhibition of the RE-mPFC pathway, there was a significant reduction in beta and gamma oscillations, while theta oscillations
remained unaffected (Supplementary Fig. 13A–D). In control animals, light stimulation did not affect neuronal network oscillatory activity in the mPFC (Supplementary Fig. 13E, F). These
findings suggest that RE may participate in memory consolidation through distinct network oscillation mechanisms in different cortical regions during NREM sleep. DISCUSSION The interplay of
triple cardinal rhythms, including neocortical SO, thalamo-cortical spindles and hippocampal ripples, is thought to initiate the systematic consolidation of spatial memory during NREM sleep.
The hierarchical coupling provides a temporally fine-tuned framework for information redistribution from temporary to long-term storage sites11,44,45. Using timed electrical stimulation in
rats, reinforcing the endogenous temporal coordination of triple-coupling can enhance the retainment of spatial memory46. In contrast, disrupting these couplings impairs subsequent memory
recall, implicating their causal role in memory information consolidation47,48. The present study reports that reactivation of learning-related MEC cell assemblies occurs in transient delta
waves-nested isolated theta waves during NREM sleep following a spatial memory task. These results reveal another type of network oscillatory dynamics linking to memory reactivation during
NREM sleep (Supplementary Fig. 14), which implies that different brain regions may adopt distinct network oscillatory mechanisms to coordinate the reactivation of memory traces. However, it
is not yet known whether this form of oscillatory dynamics in the MEC operates independently or synergistically with hippocampal SWRs and neocortical SO-nested spindles. We found that MEC
receives dense projections from the RE of the midline thalamus, which is consistent with the previous report49. RE serves as the major anatomical route between the mPFC and hippocampus, and
has been shown to be critical for spatial working memory50. RE inactivation decreased working memory specific theta synchrony between the mPFC and dorsal hippocampus25, and impaired spatial
working memory25,51. Some evidence also suggests that RE may be involved in the consolidation of spatial memory; however, these results are still contradictory38. The lesions of ventral
midline thalamus including RE with excitotoxic N-methyl-D-aspartic acid did not impact the recent memory recall, while the long-term memory performance was impaired after training21.
Additionally, some results point to the RE as a functional hub able to finely coordinate hippocampal-prefrontal gamma bursts during slow oscillations and slow-wave activity, which have been
reported to be associated with memory consolidation37,52. In contrast, other studies indicated a preferential role of the RE in retrieval rather than in consolidation, because systematic
inactivation of the RE after each learning session did not alter the acquisition of the task or remote memory performance 20 days later in an elevated crossword-like maze53. The discrepancy
in these previous work might be explained by a lack of recording and specific manipulation of neuronal activity in the RE during the consolidation stage post spatial memory encoding. In the
present study, we demonstrate that RE exhibits prominent theta waves, which are highly synchronized with those occurring in the MEC. The neuronal activity of the RE is also positively
correlated with the isolated theta waves of the MEC during NREM sleep. Specific suppression of projections from the RE to MEC resulted in disruption of these delta waves-nested theta waves,
decreased reactivations of spatial learning-related MEC cell assemblies and deterioration of spatial memory consolidation. The findings highlight the role of the RE in the midline thalamus
in driving isolated theta waves and temporally driving memory reactivation in the MEC, thereby further elucidating the neural circuitry mechanisms underlying memory consolidation during NREM
sleep. During the wake-sleep cycle, different network oscillatory activities occur in the hippocampal-entorhinal circuit to mediate the routing and processing of memory information. During
active wakefulness, this neural circuit mainly displays theta oscillations, and nested high-frequency gamma events to help realize memory encoding and retrieval3. After entering to NREM
sleep phases, the MEC shows low-frequency delta oscillations in which isolated theta waves are nested, while the hippocampus shows typical SWRs, which contributes to the restorative
functions of sleep and systematic memory consolidation54,55. The RE exhibits distinct characteristics in comparison to the hypocretinergic and cholinergic neuromodulatory systems, as RE
neurons maintain rhythmic firing patterns even during NREM sleep37,52. The aforementioned statement implies that RE enables the initiation of memory engram cell reactivation, thereby leading
to memory consolidation. Undoubtedly, these findings have further expanded our understanding of midline thalamus in memory consolidation, and provide a target in the treatment of memory
disorders. The different network oscillation patterns of hippocampus and MEC, correlated with NREM memory reactivation, may be due to their distinct functional properties. It has been
reported that the layer III of MEC exhibits presistent firing activity lasting several hundred milliseconds. Additionally, our results indicate that MEC neurons more efficiently integrate
excitatory inputs from RE at theta frequency band in vitro. These functional properties of MEC may enable it to participate in memory consolidation through a unique mechanism of isolated
theta waves. Of note, although the in vitro patch-clamp experiment revealed that RE strongly excites MEC excitatory neurons, it is important to consider that interneurons receive a
substantial amount of input from local excitatory glutamatergic neurons within the MEC region56. Therefore, the reactivation of excitatory neurons triggered by RE input during NREM sleep may
subsequently drive the reactivation of interneurons through this local circuit in the MEC in vivo. Previous studies have recorded ensembles of grid cells in superficial layers of MEC during
active exploratory behaviors and NREM sleep. The patterns of spike-time correlations that reflected the spatial tuning offsets between these grid cells during active exploration was also
observed during the NREM sleep57. The current study primarily employed a six-arm maze behavioral paradigm to investigate MEC-related spatial memory, which may not be optimal for detecting
grid cells. Further investigation is required to determine whether the identified isolated theta oscillations drive the reactivation of grid cells during NREM sleep. METHODS ANIMALS
Wild-type _C57BL/6_ mice (8–12 weeks old) were used in this study. The experiments involved the use of male mice for multi-channel single-unit and Ca2+ signal recordings, behavioral tests
including the spatial memory test with optogenetic manipulation of RE-MEC pathway, as well as morphological experiments. All the animals (4–5 mice in a cage) were kept in the animal
experiment center of Army Medical University with stable ambient temperature of 24 ± 1 °C and the feeding house was kept on a 12/12 h light/dark cycle (lights on at 8:00 A.M.). The mice that
underwent fiber or cannula implantation surgery need to be housed separately. All the experiments were in line with the ethical requirements for animal care and use of Army Medical
University and the procedures were approved by the ethics committee of Army Medical University. SURGERY Wild-type mice were anesthetized under 1% isoflurane and placed in a stereotaxic
instrument (RWD Life Technology, China). Erythromycin eye ointment was applied to prevent corneal drying and light injury. An incision was made in the scalp, the head was leveled, and bregma
coordinates were identified. A small drill hole (0.5 × 0.5 mm) was drilled at the skull corresponding to the coordinates of the RE (AP = −0.8 mm, ML = +1.0 mm, DV = −4.0 mm, tilt +15°), MEC
(AP = −4.4 mm, ML = ± 3.8 mm, DV = +1.9 mm), mPFC (AP = 1.8 mm, ML = 0.5 mm, DV = 1.5 mm) and ventral CA1 (vCA1) (AP = −3.1 mm, ML = ± 3.2 mm, DV = 3.5 mm) for injections of viruses. The
glass pipette was used for virus micro-injections. After arriving at the target area, the pipette was kept in site for 2 min. The pipette was held in place for 10 min, and then withdrawn
slowly. For retrograde tracing experiment, RV-N2C(G)-ΔG-dsRed (400 nL, BrainVTA, China) or red retrobeads (400 nL, Lumafluor) was bilaterally injected into the MEC. AAV2/9-CaMKIIα-mCherry
(200 nL, BrainVTA, China) was injected into the RE (200 nL, BrainVTA, China) for anterograde tracing experiment. For the fiber photometry recording activities of RE neurons projecting to
MEC, AAV2/9-CAG-FLEX-jGCamp7b (200 nL, Taitool Bioscience Co. Ltd, China) was injected into RE, and AAV2/2Retro-hSyn-Cre (400 nL, Taitool Bioscience Co. Ltd, China) was bilaterally injected
into the MEC. For the brain region control experiments, AAV2/9-CAG-FLEX-jGCamp7b (200 nL) was injected into the RE, and AAV2/2Retro-hSyn-Cre (400 nL) was bilaterally injected into the mPFC
or vCA1. After 2 weeks, optical fiber (OD = 200 μm, NA = 0.37, Inper, China) was implanted into the RE. Meanwhile, the electrode used for LFP recording was implanted in the MEC. For the
closed-loop optogenetic stimulation experiments, AAV2/9-CaMKIIα-ArchT3.0-eYFP (BrainVTA, China) or AAV2/9-CaMKIIα-eYFP (control, BrainVTA, China) were injected into the RE with a total
volume of 200 nL. After 2 weeks, the optic fibers surrounded by electrodes were bilaterally implanted into the MEC for light delivery and electrophysiological recordings. Similar procedures
were adopted to inject 200 nL AAV2/9-CaMKIIα-ChR2-mCherry (Obio, China) into the RE for patch-clamp experiments. And in the optogenetic inhibition of RE-mPFC experiment, same strategy for
virus injection was carried out, while the optoelectrode was unilaterally implanted into the right mPFC. For designer receptors exclusively activated by designer drug experiments,
AAV2/9-CaMKIIα-hM4D-mCherry (BrainVTA, China) or AAV2/9-CaMKIIα-mCherry (control, BrainVTA, China) into the RE with a total volume of 200 nL. After 2 weeks, the cannula (L = 5 mm, ID = 0.25
mm, RWD Life Technology, China) was bilaterally implanted into the MEC, and a stainless-steel dummy cannula (ID = 0.2 mm, RWD Life Technology, China) was inserted into the guide cannula. To
explore the characteristics of MEC firing activity, the electrode array was unilaterally implanted into the MEC. Similarly, to investigate the correlation between RE and MEC
electrophysiology activity, the electrode arrays were implanted into the RE and unilateral MEC for spikes and LFP recording. For EEG and EMG recordings, two screws into the skull on top of
the left and right cortex was inserted on the surface of mPFC. A reference screw was inserted into the skull on top of the cerebellum. Also, one EMG electrode was fixed into the dorsal neck
musculature. All the optical fibers, cannula or electrodes inserted were affixed to the skull with dental cement. The placement coordinates of the optical fiber, cannula or electrodes was
the same as described above in the virus injection sections. And animals after surgery were allowed to recover for 7 days and at least 3 weeks to express the viruses before the behavioral
testing. BEHAVIORAL APPARATUS AND TRAINING PROCEDURE Six-arm maze was used in all behavioral sessions. The maze consisted of four crossing stem arms and six side arms. Each arm (30 cm long,
8 cm wide and 17.5 cm high) was made by 3–4 milky acrylic plates (0.5 cm in thickness). The tops of the arm were open to allow tracking of the animal inside. Four figures of different shapes
(star, square, circle, triangle) were attached on both sides of walls of two stem arms perpendicular to the entrance arm. Three days before training, animals were placed on food restriction
(80–90% of initial weight) and kept at 25 °C room. During the training days, the mouse was fed with 2–2.5 g of food per day to maintain body weight. One day before formal training, then the
animal was exposed to the maze twice for adaptive exploration. Before entrance, pellets (50 mg) were placed in the container at the end of six side arms, then the animal was put in and
trained to retrieve food. After going through all the arms and collecting all the pellets, the subject was gently taken out and placed in its homecage. Once animal was habituated to the maze
and started consuming the pellets, it entered the formal training phase next day. Training procedure involves three consecutive days of spatial learning in the maze. The learning session
consisted of six trials and 2 min interval between each trial. In each trial, pellet was always placed in the container of the fixed arm. Then the animal was put in the maze to search for
the pellet. Once the rewards had been consumed, the near board was lifted, and the mouse was gently guided back to the homecage for a 2-min rest. After that trial procedure was repeated six
times, the mouse was immediately placed in its homecage for post-training 1-h sleep recording. To prevent the use of an odor-guided search strategy during these experiments, the board was
periodically wiped. In addition, trials with immobility longer than 1 min were excluded. MULTI-CHANNEL SINGLE-UNIT RECORDING For the in vivo recording the spikes and LFP, a custom-made
electrode array was used. The electrode array consisted of 3 tetrodes and 2 wires for EEG-EMG recording. A tetrode was made up of 4 insulated nickel-cadmium wires (100–250 kΩ, California
Fine Wire) twisted together. The electrode was slowly lowered into the target region with the help of brain stereotaxic apparatus (RWD Life Technology, China). Reference electrodes were
fixed above the cerebellum with small stainless screws. The electrode was tightly cemented on the animal’s skull. Electrodes were connected to a 16-channel headstage (30 kHz, Neuralynx) with
an amplifier for each wire and a green LED (3 V) for tracking the position of the animal. The headstage was connected to a 2 m cable plugged into a commutator that allows the animal to move
freely in the behavioral task. Signals were amplified (Digital Lynx SX; Neuralynx, MO, USA) and acquired by Cheetah 5.7.4 acquisition software (Neuralynx). Units were amplified 10,000 times
using a 16-channel amplifier (Neuralynx) and band-pass filtered at 300–10,000 Hz. Wild band signals were digitized at 30 kHz and band-pass filtered (0.1–9 kHz) by an amplifier (Digital Lynx
SX; Neuralynx, MO, USA). OPTOGENETIC INTERVENTION As for closed-loop optogenetic inhibition of RE-MEC pathway, the bilateral optical fibers of MEC were connected to the 589 mm yellow laser
generator (Newdoon Technology Co. Ltd., China). A closed-loop system was used for real-time optogenetic intervention. Finishing 6-trials spatial learning, mice were placed in the homecage
for 1-h sleep recording by Cheetah 5.7.4 acquisition software (Neuralynx), as well as in real-time LFP recording in the MEC with the Neuralynx Hardware Processing Platform.
Transistor-Transistor Logic (TTL) pulse high time was set at 300 ms and the detection lockout time was set at 500 ms. TTL pulse was selectively transmitted only when the peak of theta power
exceeded one standard deviation from the average theta activity58. Once theta wave was detected during post-training NREM sleep, yellow laser (300 ms, 20 mW) was triggered by TTL pulse
procedure to inhibit RE-MEC pathway. The subject mouse was returned to the home cage immediately and the EEG-EMG recording was monitored to manually identify NREM episodes across the
following 1 h. NREM sleep was defined by high amplitude and low-frequency EEG activity, as well as low amplitude EMG activity. Once the mice entered NREM sleep, the laser generator was
turned on, and the closed-loop system would specifically detect theta oscillations during NREM sleep to trigger the optogenetic stimulation. The 93.8% and 90.5% of optogenetic stimulation
were applied during NREM sleep on day 1 and day 2 in the mice with RE expressing ArchT3.0-eYFP. For optogenetic inhibition of the RE-mPFC pathway, unilateral optical fiber of mPFC was
connected to the 589 mm yellow laser generator (Newdoon Technology Co. Ltd., China). Mice were placed in the homecage for 1–2 h sleep recording (Neuralynx), as well as in real-time LFP
recording in the mPFC with the Neuralynx. A light stimulation lasting for a duration of 20 s when the mice entered stable NREM sleep, as evidenced by consistent EEG pattern. At the distal
end of the optical fiber the laser intensity was set to 15 mW under consistent illumination. CHEMOGENETIC INTERVENTION For the chemogenetic inhibition experiment, CNO (500 nL, Tocris, USA)
was bilaterally delivered into the MEC through an intracranially-inserted cannula, immediately after training session each day. A syringe pump (Harvard apparatus) was used for infusion at a
rate of 250 nL/min. The needle was held in place for another 2 min, and then withdrawn slowly. FIBER PHOTOMETRY RECORDING To perform the fiber photometry recording experiment, a
commercialized fiber photometry system (Inperstudio Alpha 8.2, Inper, China) was used to record RE Ca2+ signals. An optical fiber (200 μm in diameter, NA of 0.37, Inper, China) was used to
guide the laser from the optical commutator to the implanted optical fiber. A 470 nm and a 410 nm laser beam were used for excitation and isosbestic wavelength, respectively. The laser power
at the tip of the optical fiber was set at 20–30 μW (470 nm) and 10–20 μW (410 nm) to minimize photobleaching. The 410-nm channel was used as an isosbestic control. The fluorescence signals
were bandpass filtered and collected by a photomultiplier tube. The current signals from the photomultiplier tube were converted to voltage signals by an amplifier, which was further
filtered through a low-pass filter. The analogue voltage signals were digitalized at 20 Hz, and recorded by fiber photometry software (Inperstudio Alpha 8.2, Inper, China). Meanwhile,
Bayonet Neill-Concelman was used to connect the fiber photometry system and multi-channel single unit recording system for synchronous recording neural activities. After triggering the start
of synchronous recording in the Inper Signal software, 40 min of Ca2+ signals of RE neurons projecting to MEC and LFP in the MEC were recorded as well as EEG-EMG recording. WHOLE-CELL
PATCH-CLAMP RECORDING The whole-cell patch-clamp recordings procedures were consistent with previous studies59,60,61. Mice were decapitated after being anesthetized with isoflurane. The
brain was rapidly removed and placed into the ice-cold section solution oxygen-saturated with 95% O2 and 5% CO2. The section solution was composed of 220 mM sucrose, 10 mM glucose, 2.5 mM
KCl, 1 mM CaCl2, 26 mM NaHCO3, 6 mM MgCl2 and 1.25 mM NaH2PO4. The brain was cut into horizontal slices containing the MEC with 400 μm thickness in the ice-cold section solution by a VT1000
tissue slicer (Leica, Germany) and then incubated for 1 h in the oxygen-saturated artificial cerebrospinal fluid (ACSF) containing 2.5 mM KCl, 125 mM NaCl, 2 mM CaCl2, 26 mM NaHCO3, 1.3 mM
MgSO4, 1.25 mM NaH2PO4, 20 mM glucose at room temperature. Then, the brain slices were moved into a submerged chamber for recording with continuous infusion of oxygen-saturated ACSF. The
targeted neurons were identified by an upright fluorescent microscope (Olympus, Japan) equipped with differential contrast optics and an infrared video imaging camera. The whole-cell
recordings were conducted on the target neurons in the MEC with glass pipettes containing the solution (130 mM potassium gluconate, 5 mM KCl, 2 mM MgCl2, 10 mM HEPES, 0.1 mM EGTA, 2 mM
Na2-ATP, 0.2 mM Na2-GTP). After clamping the targeted neurons at −60 mV with stable recoding for at least 15 min, step currents (−300 pA to +300 pA, Δcurrent = 100 pA, duration = 1 s) were
injected into the clamped neurons to induce voltage curves and action potentials. Different neuronal types were distinguished by the morphological and electrophysiological properties of
these neurons. The excitatory glutamatergic neurons exhibited larger somata and smaller fast afterhyperpolarization potential. While the interneurons showed fast afterhyperpolarization
potential and faster spike firing rates. To stimulate ChR2 expressed in axon terminals from the RE, AAV2/9-CaMKIIα-hChR2(H134R)-mCherry (Obio Technology Co. Ltd., China) were injected into
the RE of the adult mice. After about 4 weeks of virus expression, glutamatergic neurons and interneurons were recorded from the horizontal brain slices containing the MEC, which were
prepared according to the above-mentioned method. To demonstrate whether monosynaptic functional connection is established between RE and MEC neuron, the postsynaptic effect of MEC neurons
were recorded under the voltage clamp configuration. After a stable baseline recording, 473 nm blue light (1 Hz, 15 ms, 10 mW under constant light) was delivered to evoke excitatory
postsynaptic effects via an optical fiber placed above the recorded cell. Then, 6,7-dinitroquinoxaline-2,3-dione (DNQX, 10 μM) and d-(−)−2-amino-5-phosphonopentanoic acid (AP5) (50 μM) was
used to block action potential-based excitatory monosynaptic transmission under blue light. To evaluate the integrated strength of MEC neurons in response to RE inputs, a series of light
pulses (1 Hz, 5 Hz, 10 Hz, 20 Hz) were applied to stimulate RE axon terminals in the MEC. The responses of glutamatergic neurons and interneurons in the MEC were recorded under the voltage
and current clamp configuration. The light pulses were applied under the control of an eight-channel programmable pulse stimulator (Master-8, A.M.P.I. USA). Parameters of light pulses: 1 Hz:
duration = 15 ms, interval = 1 s, M = 10; 5 Hz: duration = 15 ms, interval = 200 ms, M = 10; 10 Hz: duration = 15 ms, interval = 100 ms, M = 20; 20 Hz: duration = 15 ms, interval = 50 ms, M
= 40. To verify when RE_-_\({{{{\rm{MEC}}}}}^{{{{\rm{GABA}}}}}\) pathway is activated, MEC interneurons were clamped at resting and depolarized potentials. And a series of light pulses (1
Hz, 5 Hz, 10 Hz, 20 Hz) were applied to stimulate terminals from RE to observe whether action potentials of recording cell were effectively evoked under current clamp mode. The mean
amplitude of EPSCs induced by each stimulus was calculated to evaluate the response of MEC neurons to different frequency stimulation of RE inputs. Wakefulness-promoting neurotransmitter
acetylcholine (MCE, China) was also added to observe its effects on the MEC interneurons. The interneurons were recorded as baseline states with membrane potentials held at resting states
under current clamp mode. Following 15 min of baseline recording, acetylcholine (1 μM, 10 μM, 100 μM) was bath-applied for 2 min with a speed of about 2 ml/min, and followed by washout of 15
min. A neuron was excluded for data analysis if the change in series resistance was larger than 25 MΩ or 15% of baseline. To verify whether CNO could silence hM4D-expressing RE neurons,
AAV2/9-CaMKIIα-hM4d-mCherry virus (BrainVTA, China) were injected into the RE. After about 2 weeks of recovery, the coronal brain slices containing the RE were prepared. Action potentials in
hM4D-expressing RE neurons were elicited by depolarizing the membrane potential in the current clamp configuration. After recording the baseline for about 5 min, CNO (Tocris, USA) was
bath-applied for 2 min and then followed by washout. In addition, to investigate whether CNO inhibited the activities of MEC neurons receiving RE hM4D-expressed inputs, similarly,
AAV2/9-CaMKIIα-hM4d-mCherry virus (BrainVTA, China) were injected into the RE. MEC glutamatergic neurons were clamped in the depolarized state to evoke stable action potentials. Since the
input of RE is mainly an excitatory, in order to prevent the influence of local inhibitory input to MEC neurons, the brain slices were continuously perfused in the ACSF with GABAA receptor
blockers (Bicuculline, 10 μM). After recording the baseline for about 5 min, CNO was added for 2 min, and then followed by washout. And postsynaptic responses of MEC neurons were also
recorded in the voltage-clamp mode to further explore whether the decrease in discharge is due to a decrease in excitatory inputs. The on-line electrophysiological data were continuously
recorded using an EPC10 recording system and the Patchmaster software v2x73 (HEKA). The electrical signals were processed with 4 kHz low-pass filter and digitalized at 10 kHz. The off-line
data were analyzed by the Igor Pro 4.03 (WaveMatrics) or Mini Analysis Program 6.0 (Synaptosoft). HISTOLOGY After completing all experiments, the mice were anesthetized and a lesion maker
device (Ugo Basile, Italy) to deliver 0.5 mA direct current for 10 s to each of the electrode locations. Then, mice were perfused transcardially with ~20 ml 37 °C phosphate-buffered saline
(PBS), followed by ~50 ml ice-cold 4% paraformaldehyde (PFA). The brain tissues were carefully extracted from the skull and postfixed in 4% PFA for 5 h, then transferred to 30% sucrose for
dehydration at 4 °C overnight. Brains were coronally or sagittally sectioned at 40 μm using a freezing microtome (CM 3050S, Leica). Slices containing interested brain regions were washed
three times (10 min each time) in PBS and then mounted on glass microscope slides, dried, and coverslipped with a DAPI-containing mounting media (F6057, Sigma, USA). The expression of
fluorescent protein and location of electrode, optical fiber, cannula were identified. Only animals with accurate recording sites and good fluorescence expression will be included. Images
were taken by fluorescence microscope (BX53, Olympus), digital slide scanner (SLIDEVIEWTM VS 200, Olympus), or confocal laser scanning microscopes (LSM 900, Zeiss). SLEEP-WAKE CYCLE ANALYSIS
All the experiments required EEG and EMG recording were performed by Cheetah 5.7.4 acquisition software (Neuralynx). EEG and EMG signals were amplified (Digital Lynx SX; Neuralynx, MO, USA)
and band-passed filtered at 0.1–100 Hz and 100–1000 Hz, respectively. Off-line analysis of sleep-wakefulness stage was performed by the specialized software SleepSign 2.0 (Kissei Comtec).
Wakefulness was characterized by desynchronized, low-amplitude EEG rhythms and elevated EMG activity with phasic bursts. NREM sleep was defined as synchronized, high amplitude and low
frequency (0.5-4 Hz) EEG activity and lower EMG activity compared with wakefulness with no phasic bursts. REM sleep was defined as containing a pronounced theta rhythm with nearly no EMG
activity61. TRAJECTORY ANALYSIS Behavioral tracking data were recorded via an overhead camera with Cheetah 5.7.4 acquisition software (Neuralynx) at a 30 Hz sample rate. Cheetah 5.7.4
produced automated tracking of the animal’s position by the green LED light mounted on the headstage near the animal’s head. Imaging and behavioral data were further processed to calculate
the distance in each trial. The distance values were obtained by the distance of two adjacent points (_x1, y1_) and (_x2, y2_). The number of errors entering the non-target arm was judged
according to the video and manually counted. REACTIVATION ANALYSIS The analysis of reactivation intensity was calculated as previous studies32,62. Firing pattern of trials during the spatial
learning behavior were extracted as a template, and firing pattern during post-training sleep was matched with the template to gain the reactivation strength. For both the template and
match epochs, spike trains of MEC ensemble were divided into 100 ms bins and Z-transformed to get the matrices \({Q}_{{template}}^{{trial}}\) and \({Q}_{{match}}^{{post}-{sleep}}\). The
correlation matrix \({C}_{{template}}\) (\({N}_{{cells}}\times {N}_{{cells}}\)) of the template epoch was defined as follows: $$C=\frac{1}{B}Q{Q}^{T}$$ (1) In this formula, _B_ is the total
amount of time bins, _Q_ is the \({Q}_{{template}}^{{trial}}\). PC analysis was applied to decompose the matrix \({C}_{{template}}\) into projectors \({P}^{(l)}\), which is associated to the
eigenvalue \({\lambda }_{l}\). $$C={\sum}_{l}{\lambda }_{l}{P}^{(l)}$$ (2) Further, to describe the similarities between the cell assemblies activated pattern of post-task sleep section and
spatial learning experience, reactivation strength was calculated as follows: $${R}_{l}\left(t\right)={\sum}_{i,j,i\ne j}{Q}_{{it}}^{{\prime} }{P}_{{ij}}^{(l)}{Q}_{{jt}}^{{\prime} }$$ (3)
In the given equation, \({Q}^{{\prime} }\) represents the Z-transformed spike trains during the post-task sleep section at time t. \({R}_{l}(t)\) quantifies the instantaneous correspondence
between the ongoing activity and the _l_th coactivation template. To obtain the significant PC signal in the template epoch, the root square of the eigenvalues of the correlation matrix
\({C}_{{template}}\) of random datasets has been demonstrated to adhere to the Marcenko–Pastur distribution63,64. In the limit \(B\to \infty\) an_d_ \(N\to \infty\) with \(q=B/N\ge\)1 fixed,
$$\rho (\lambda )=\frac{q}{2\pi {\sigma }^{2}}\frac{\sqrt{({\lambda }_{\max }-\lambda )(\lambda -{\lambda }_{\min })}}{\lambda }$$ (4) $${\lambda }_{\min }^{\max }={\sigma }^{2}{(1\pm
\sqrt{1/q})}^{2}$$ (5) The \({\sigma }^{2}\) _i_s the variance of the elements of the random matrix, and the \(Q\) matrix is Z-transformed. In the null hypothesis where _Q_ template
represents uncorrelated data, the correlations between spike trains are solely influenced by random fluctuations. Consequently, the eigenvalues of \({C}_{{template}}\) should fall within the
range of \({\lambda }_{\max }\) and \({\lambda }_{\min }\). Any eigenvalues exceeding \({\lambda }_{\max }\) indicate the presence of nonrandom correlations in the matrix, thus referred to
as signal PC. On the other hand, components associated with eigenvalues between \({\lambda }_{\max }\) and \({\lambda }_{\min }\) are considered non-signal components. Trial-by-trial
normalized z scores of the activation strength of the signal PC during the training epoch were plotted along the trace on the maze. Then the z scores were clustered based on the preferential
position of PC-representing firing patterns. FIRING RATE ANALYSIS Electrophysiological data for single-unit spike sorting were processed using SpikeSort3D v2.5.2.0 (Neuralynx). Clustering
of spikes and unit isolation procedures were in accordance with the previous study61. The raw data was resampled to 30 kHz and the power in the 600–6000 Hz range was computed. PC analysis
was used to extract and represent the first two PC on a two-dimensional plot of detected spike events. Waveforms with similar PC were clustered by using K-means sorting method. The isolated
cluster was considered as single unit recorded from the same neuron. Cross-channel artifacts were eliminated by cross-correlation histogram. Based on the previous study5, the putative
interneurons and putative glutamatergic neurons were distinguished according to their firing frequency and waveforms. The putative interneurons had high firing frequency and narrow width of
spike waveforms, while the putative glutamatergic neurons had broad waves and low firing frequency. Firing rate histograms and rastergrams were created using the software NeuroExplorer 5.312
(Nex Technologies). LOCAL FIELD POTENTIAL ANALYSIS For LFP analysis, power spectral density (PSD) was first extracted by the software NeuroExplorer 5.312 (Nex Technologies), which was
further processed using the MATLAB 2021a. The PSD for each frequency band: delta: 0.5–4 Hz, theta: 4–12 Hz, low-frequency gamma: 25–48 Hz, and high-frequency gamma: 60–90 Hz. To analyze LFP
changes in multiple frequency domains, the Morlet wavelet transform was calculated with the wavelet software package65. We plotted spectrograms of MEC LFP for both wakefulness and NREM
sleep, and aligned them to timestamps of reactivation events during NREM sleep to observe characteristic LFP during relevant events. In the closed-loop optical inhibition experiment, we
calculated spectral values for a 2-s time window around each marker by using NeuroExplorer Perievent Spectrograms features. These spectrogram data were then exported to MATLAB 2021a for
further processing. ISOLATED THETA WAVE DETECTION To detect theta waves, we firstly downsampled the LFP to 200 Hz. Then we calculated both the frequency and the amplitude of the signals
using a Morlet wavelet65 and computed the amplitude of the theta wave (4–12 Hz) within a sliding window of 0.1 s using MATLAB 2021a. If the amplitude of one sliding window is larger than the
mean plus one standard deviations of the whole period, then this window is classified as a theta event. For these theta events detected, we calculated the distribution of average time and
theta power (%) that characterize theta events during post-training NREM sleep. Theta power (%) was calculated as the proportion value of LFP power (4–12 Hz) / LFP power (0.5–90 Hz). THETA
POWER-DELTA PHASE COUPLING ANALYSIS To measure the strength of MEC theta-delta coupling during NREM sleep, delta phases were binned into π/20 intervals (−180° - +540°) and the mean power of
theta waves (4–12 Hz) in each phase bin was calculated. The phase of the filtered LFP was computed using the Hilbert transform. To calculate the comodulogram between delta phase and theta
power, bands of delta activity was band-pass filtered (centers at 0.5–4 Hz) with a zero-phase filter and phase-power coupling was measured for wavelet power between 4–12 Hz. To depict the
strength of theta-delta coupling, MI was calculated as described previously66,67. The Kullback–Leibler (KL) distance, a variable which was widely used to measure how much the phase-power
distribution deviates from a uniform distribution. The MI is obtained by dividing the KL distance by a constant factor [the logarithm of the number of phase bins], which takes the assume
values of MI between 0 (no coupling) and 1 (perfect coupling). In case of data overfitting, raw LFP signals were randomly arranged and MI values were obtained for the shuffled group.
Additionally, to further analyze the characteristic LFP during reactivation, the reactivation strength in each phase bin of delta wave and the theta power around reactivation peak were
calculated. LFP COHERENCE AND SPIKE-THETA PHASE-LOCKING ANALYSIS For LFP coherence analysis, native MEC and RE LFP signals first imported into the software NeuroExplorer 5.312 (Nex
Technologies), and then processed to get the LFP power spectrum using the wavelet transform code. With the coherence analysis method, LFP coherence was computed ranging multiple frequency
bands (0.5–90 Hz) during both wakefulness and NREM sleep (number of tapers = 5, time-bandwidth product = 3). The reference channel recording general signals was set as the reference channel
for recording the MEC signal. For spike-theta phase-locking analysis, every spike of RE was assigned to its corresponding theta phase. Rayleigh’s test for circular uniformity was applied to
test the significance of phase-locking. The preferred phase and the locking strength were the argument and modulus, respectively, of the average vector of all spike events corresponding to
the theta phase5,68,69. Inclusion in the analysis was exclusively limited to spikes of RE observed during NREM sleep. CA2+ SIGNAL AND THETA WAVE SYNCHRONY ANALYSIS To analyze the correlation
of RE Ca2+ signal and MEC LFP during NREM sleep, Ca2+ peaks of RE neurons projecting to MEC were manually marked. _ΔF/F_ (%) was used to present the value of GCaMP7b fluorescence signals70.
The normalized _ΔF/F_ reflects the changes in the _ΔF/F_ values relative to the baseline, which is defined as the period from −2 to −1 s before the peak of the Ca2+ signal. The theta ratio
represents the proportion of theta power in relation to both theta and delta band power. The average value of the theta ratio during −2 to −1 s before the peak of the Ca2+ signal serves as a
baseline, and any deviation from this baseline is calculated as Δtheta ratio. CAUSALITY ANALYSIS Causality analysis was conducted to analyze the temporal directionality of RE and MEC
occurrences of theta events. LFP of RE and MEC were preprocessed with Morlet wavelet transform. Theta events of MEC was defined as the time series _X_, and theta events of RE was defined as
the the time series _Y_. The significance level was set 0.05. The null hypothesis posits that the _Y_ does not exert a Grangerian influence on _X_. Based on the Bayesian Information
Criterion to choose the optimal lag length. _F_-statistic and critical value was calculated. We reject the null hypothesis if critical value is smaller than _F_-statistic. STATISTICAL
ANALYSIS The statistical analyses were conducted utilizing SigmaPlot 14.0 (Systat Software), GraphPad Prism 8.0 (GraphPad Software), SPSS Statistics 25.0 (International Business Machines
Corporation) and MATLAB 2021a (Mathworks). Normality and equal variances were formally tested for each group of data. For data with normal distribution and equal variances, two-tailed paired
or unpaired _t_ tests, and analysis of variance (ANOVA) with post hoc test were performed for the comparisons between groups. Welch’s _t_ test was employed for normally distributed data
with non-homogeneous variances. If data did not conform to the normal distribution, nonparametric tests were performed. Significant differences were accepted when _P_ < 0.05. REPORTING
SUMMARY Further information on research design is available in the Nature Portfolio Reporting Summary linked to this article. DATA AVAILABILITY All data generated in this study are provided
within the article, Supplementary Information and Source Data file. Further information regarding to the findings in the present study are available from the corresponding authors upon
request. Source data are provided with this paper. CODE AVAILABILITY Custom made codes for reactivation, isolated theta wave detection, theta power-delta phase coupling analysis, spike-theta
phase-locking analysis and mouse route tracking are available on GitHub (https://github.com/hechaochongqing/NC-RE-MEC-matlab-code-2024). REFERENCES * Buzsaki, G. The hippocampo-neocortical
dialogue. _Cereb. Cortex_ 6, 81–92 (1996). Article CAS PubMed Google Scholar * Buzsaki, G. & Moser, E. I. Memory, navigation and theta rhythm in the hippocampal-entorhinal system.
_Nat. Neurosci._ 16, 130–138 (2013). Article CAS PubMed PubMed Central Google Scholar * Colgin, L. L. Rhythms of the hippocampal network. _Nat. Rev. Neurosci._ 17, 239–249 (2016).
Article CAS PubMed PubMed Central Google Scholar * Liao, Y. et al. Spatial memory requires hypocretins to elevate medial entorhinal gamma oscillations. _Neuron_ 112, 155–173.e158
(2024). Article CAS PubMed Google Scholar * Chen, Q. H. et al. Histamine enhances theta-coupled spiking and gamma oscillations in the medial entorhinal cortex consistent with successful
spatial recognition. _Cereb. Cortex_ 28, 2439–2457 (2018). Article PubMed Google Scholar * Haam, J. & Yakel, J. L. Cholinergic modulation of the hippocampal region and memory
function. _J. Neurochem_ 142, 111–121 (2017). Article CAS PubMed PubMed Central Google Scholar * Gu, Z., Alexander, G. M., Dudek, S. M. & Yakel, J. L. Hippocampus and entorhinal
cortex recruit cholinergic and NMDA receptors separately to generate hippocampal theta oscillations. _Cell Rep._ 21, 3585–3595 (2017). Article CAS PubMed PubMed Central Google Scholar *
Teles-Grilo Ruivo, L. M. & Mellor, J. R. Cholinergic modulation of hippocampal network function. _Front. Synaptic Neurosci._ 5, 2 (2013). Article PubMed PubMed Central Google Scholar
* Chen, J. et al. Control of emotion and wakefulness by neurotensinergic neurons in the parabrachial nucleus. _Neurosci. Bull._ 39, 589–601 (2023). Article CAS PubMed Google Scholar *
Born, J. & Wilhelm, I. System consolidation of memory during sleep. _Psychol. Res._ 76, 192–203 (2012). Article PubMed Google Scholar * Staresina, B. P. et al. Hierarchical nesting of
slow oscillations, spindles and ripples in the human hippocampus during sleep. _Nat. Neurosci._ 18, 1679–1686 (2015). Article CAS PubMed PubMed Central Google Scholar * Marshall, L.,
Cross, N., Binder, S. & Dang-Vu, T. T. Brain rhythms during sleep and memory consolidation: neurobiological insights. _Physiology_ 35, 4–15 (2020). Article CAS PubMed Google Scholar
* Ohno, M. Failures to reconsolidate memory in a mouse model of Alzheimer’s disease. _Neurobiol. Learn Mem._ 92, 455–459 (2009). Article PubMed PubMed Central Google Scholar * Mander, B.
A. et al. Beta-amyloid disrupts human NREM slow waves and related hippocampus-dependent memory consolidation. _Nat. Neurosci._ 18, 1051–1057 (2015). Article CAS PubMed PubMed Central
Google Scholar * Hao, Y. et al. Resveratrol and Sir2 reverse sleep and memory defects induced by amyloid precursor protein. _Neurosci. Bull._ 39, 1117–1130 (2023). Article CAS PubMed
PubMed Central Google Scholar * Steriade, M. Cholinergic blockage of network- and intrinsically generated slow oscillations promotes waking and REM sleep activity patterns in thalamic and
cortical neurons. _Prog. Brain Res._ 98, 345–355 (1993). Article CAS PubMed Google Scholar * Steriade, M., Nunez, A. & Amzica, F. Intracellular analysis of relations between the slow
(<1 Hz) neocortical oscillation and other sleep rhythms of the electroencephalogram. _J. Neurosci._ 13, 3266–3283 (1993). Article CAS PubMed PubMed Central Google Scholar * Stroh,
A. et al. Making waves: initiation and propagation of corticothalamic Ca2+ waves in vivo. _Neuron_ 77, 1136–1150 (2013). Article CAS PubMed Google Scholar * Fiath, R. et al. Laminar
analysis of the slow wave activity in the somatosensory cortex of anesthetized rats. _Eur. J. Neurosci._ 44, 1935–1951 (2016). Article PubMed Google Scholar * Carpenter, F., Burgess, N.
& Barry, C. Modulating medial septal cholinergic activity reduces medial entorhinal theta frequency without affecting speed or grid coding. _Sci. Rep._ 7, 14573 (2017). Article ADS
PubMed PubMed Central Google Scholar * Loureiro, M. et al. The ventral midline thalamus (reuniens and rhomboid nuclei) contributes to the persistence of spatial memory in rats. _J.
Neurosci._ 32, 9947–9959 (2012). Article CAS PubMed PubMed Central Google Scholar * Dolleman-van der Weel, M. J. et al. The nucleus reuniens of the thalamus sits at the nexus of a
hippocampus and medial prefrontal cortex circuit enabling memory and behavior. _Learn Mem._ 26, 191–205 (2019). Article PubMed PubMed Central Google Scholar * Angulo-Garcia, D. et al.
Cell assemblies in the cortico-hippocampal-reuniens network during slow oscillations. _J. Neurosci._ 40, 8343–8354 (2020). Article CAS PubMed PubMed Central Google Scholar * Cholvin, T.
et al. The ventral midline thalamus contributes to strategy shifting in a memory task requiring both prefrontal cortical and hippocampal functions. _J. Neurosci._ 33, 8772–8783 (2013).
Article CAS PubMed PubMed Central Google Scholar * Hallock, H. L., Wang, A. & Griffin, A. L. Ventral midline thalamus is critical for hippocampal-prefrontal synchrony and spatial
working memory. _J. Neurosci._ 36, 8372–8389 (2016). Article CAS PubMed PubMed Central Google Scholar * Ali, M. et al. Environmental enrichment enhances systems-level consolidation of a
spatial memory after lesions of the ventral midline thalamus. _Neurobiol. Learn Mem._ 141, 108–123 (2017). Article PubMed Google Scholar * Klein, M. M. et al. Ventral midline thalamus
lesion prevents persistence of new (learning-triggered) hippocampal spines, delayed neocortical spinogenesis, and spatial memory durability. _Brain Struct. Funct._ 224, 1659–1676 (2019).
Article PubMed Google Scholar * Marshall, U. & Born, J. The contribution of sleep to hippocampus-dependent memory consolidation. _Trends Cogn. Sci._ 11, 442–450 (2007). Article
PubMed Google Scholar * Ego-Stengel, V. & Wilson, M. A. Disruption of ripple-associated hippocampal activity during rest impairs spatial learning in the rat. _Hippocampus_ 20, 1–10
(2010). Article PubMed PubMed Central Google Scholar * van de Ven, G. M., Trouche, S., McNamara, C. G., Allen, K. & Dupret, D. Hippocampal offline reactivation consolidates recently
formed cell assembly patterns during sharp wave-ripples. _Neuron_ 92, 968–974 (2016). Article PubMed PubMed Central Google Scholar * Lu, Y. et al. A critical time-window for the
selective induction of hippocampal memory consolidation by a brief episode of slow-wave sleep. _Neurosci. Bull._ 34, 1091–1099 (2018). Article CAS PubMed PubMed Central Google Scholar *
Peyrache, A., Khamassi, M., Benchenane, K., Wiener, S. I. & Battaglia, F. P. Replay of rule-learning related neural patterns in the prefrontal cortex during sleep. _Nat. Neurosci._ 12,
919–U143 (2009). Article CAS PubMed Google Scholar * Tingley, D. & Peyrache, A. On the methods for reactivation and replay analysis. _Philos. T R Soc. B_ 375, 20190231 (2020). *
Staresina, B. P., Niediek, J., Borger, V., Surges, R. & Mormann, F. How coupled slow oscillations, spindles and ripples coordinate neuronal processing and communication during human
sleep. _Nat. Neurosci._ 26, 1429–1437 (2023). Article CAS PubMed PubMed Central Google Scholar * Helfrich, R. F., Mander, B. A., Jagust, W. J., Knight, R. T. & Walker, M. P. Old
brains come uncoupled in sleep: slow wave-spindle synchrony, brain atrophy, and forgetting. _Neuron_ 97, 221–230 (2018). Article CAS PubMed Google Scholar * Zimmerman, E. C. & Grace,
A. A. Prefrontal cortex modulates firing pattern in the nucleus reuniens of the midline thalamus via distinct corticothalamic pathways. _Eur. J. Neurosci._ 48, 3255–3272 (2018). Article
PubMed PubMed Central Google Scholar * Ferraris, M. et al. The nucleus reuniens controls long-range hippocampo-prefrontal gamma synchronization during slow oscillations. _J. Neurosci._
38, 3026–3038 (2018). Article CAS PubMed PubMed Central Google Scholar * Ferraris, M., Cassel, J. C., de Vasconcelos, A. P., Stephan, A. & Quilichini, P. P. The nucleus reuniens, a
thalamic relay for cortico-hippocampal interaction in recent and remote memory consolidation. _Neurosci. Biobehav. R._ 125, 339–354 (2021). Article CAS Google Scholar * Lopez-Madrona, V.
J. et al. Different theta frameworks coexist in the rat hippocampus and are coordinated during memory-guided and novelty tasks. _eLife_ 9, e57313 (2020). * Heys, J. G., Schultheiss, N. W.,
Shay, C. F., Tsuno, Y. & Hasselmo, M. E. Effects of acetylcholine on neuronal properties in entorhinal cortex. _Front. Behav. Neurosci._ 6, 32 (2012). * Palacios-Filardo, J. et al.
Acetylcholine prioritises direct synaptic inputs from entorhinal cortex to CA1 by differential modulation of feedforward inhibitory circuits. _Nat. Commun._ 12, 5475 (2021). * Cardin, J. A.
et al. Driving fast-spiking cells induces gamma rhythm and controls sensory responses. _Nature_ 459, 663–U663 (2009). Article ADS CAS PubMed PubMed Central Google Scholar * Buzsáki, G.
& Wang, X. J. Mechanisms of gamma oscillations. _Annu. Rev. Neurosci._ 35, 203–225 (2012). Article PubMed PubMed Central Google Scholar * Brodt, S., Inostroza, M., Niethard, N.
& Born, J. Sleep-A brain-state serving systems memory consolidation. _Neuron_ 111, 1050–1075 (2023). Article CAS PubMed Google Scholar * Klinzing, J. G., Niethard, N. & Born, J.
Mechanisms of systems memory consolidation during sleep. _Nat. Neurosci._ 22, 1598–1610 (2019). Article CAS PubMed Google Scholar * Maingret, N., Girardeau, G., Todorova, R., Goutierre,
M. & Zugaro, M. Hippocampo-cortical coupling mediates memory consolidation during sleep. _Nat. Neurosci._ 19, 959–964 (2016). Article CAS PubMed Google Scholar * Latchoumane, C. F.
V., Ngo, H. V. V., Born, J. & Shin, H. S. Thalamic spindles promote memory formation during sleep through triple phase-locking of cortical, thalamic, and hippocampal rhythms. _Neuron_
95, 424–435 (2017). Article CAS PubMed Google Scholar * Girardeau, G., Benchenane, K., Wiener, S. I., Buzsáki, G. & Zugaro, M. B. Selective suppression of hippocampal ripples impairs
spatial memory. _Nat. Neurosci._ 12, 1222–1223 (2009). Article CAS PubMed Google Scholar * Vertes, R. P., Linley, S. B. & Hoover, W. B. Limbic circuitry of the midline thalamus.
_Neurosci. Biobehav. Rev._ 54, 89–107 (2015). Article PubMed PubMed Central Google Scholar * Griffin, A. L. The nucleus reuniens orchestrates prefrontal-hippocampal synchrony during
spatial working memory. _Neurosci. Biobehav. Rev._ 128, 415–420 (2021). Article PubMed PubMed Central Google Scholar * Maisson, D. J. N., Gemzik, Z. M. & Griffin, A. L. Optogenetic
suppression of the nucleus reuniens selectively impairs encoding during spatial working memory. _Neurobiol. Learn Mem._ 155, 78–85 (2018). Article PubMed Google Scholar * Hauer, B. E.,
Pagliardini, S. & Dickson, C. T. The reuniens nucleus of the thalamus has an essential role in coordinating slow-wave activity between neocortex and hippocampus. eN_euro_ 6,
ENEURO.0365-19.2019 (2019). * Mei, H., Logothetis, N. K. & Eschenko, O. The activity of thalamic nucleus reuniens is critical for memory retrieval, but not essential for the early phase
of “off-line” consolidation. _Learn Mem._ 25, 129–137 (2018). Article CAS PubMed PubMed Central Google Scholar * Joo, H. R. & Frank, L. M. The hippocampal sharp wave-ripple in
memory retrieval for immediate use and consolidation. _Nat. Rev. Neurosci._ 19, 744–757 (2018). Article CAS PubMed PubMed Central Google Scholar * Girardeau, G. & Lopes-dos-Santos,
V. Brain neural patterns and the memory function of sleep. _Science_ 374, 560–564 (2021). Article ADS CAS PubMed PubMed Central Google Scholar * Fuchs, E. C. et al. Local and distant
input controlling excitation in layer II of the medial entorhinal cortex. _Neuron_ 89, 194–208 (2016). Article CAS PubMed PubMed Central Google Scholar * Trettel, S. G., Trimper, J. B.,
Hwaun, E., Fiete, I. R. & Colgin, L. L. Grid cell co-activity patterns during sleep reflect spatial overlap of grid fields during active behaviors. _Nat. Neurosci._ 22, 609–617 (2019).
Article CAS PubMed PubMed Central Google Scholar * Cordon, I. et al. Theta-phase closed-loop stimulation induces motor paradoxical responses in the rat model of Parkinson disease.
_Brain Stimul._ 11, 231–238 (2018). Article PubMed Google Scholar * Li, Y. et al. Adenosine modulates the excitability of layer II stellate neurons in entorhinal cortex through A1
receptors. _Hippocampus_ 21, 265–280 (2011). Article PubMed Google Scholar * He, C. et al. Superficial layer-specific histaminergic modulation of medial entorhinal cortex required for
spatial learning. _Cereb. Cortex_ 26, 1590–1608 (2016). Article PubMed Google Scholar * Ren, S. et al. The paraventricular thalamus is a critical thalamic area for wakefulness. _Science_
362, 429–434 (2018). Article ADS CAS PubMed Google Scholar * Peyrache, A., Benchenane, K., Khamassi, M., Wiener, S. I. & Battaglia, F. P. Principal component analysis of ensemble
recordings reveals cell assemblies at high temporal resolution. _J. Comput Neurosci._ 29, 309–325 (2010). Article PubMed Google Scholar * Marčenko, V. A. & Pastur, L. A. Distribution
of eigenvalues for some sets of random matrices. _Matematicheskii Sbornik_ 1, 457–483 (1967). Article ADS Google Scholar * Sengupta, A. M. & Mitra, P. P. Distributions of singular
values for some random matrices. _Phys. Rev._ 60, 3389–3392 (1999). ADS CAS Google Scholar * Müller, R. et al. Automatic detection of highly organized theta oscillations in the murine
EEG. _J. Vis. Exp._ 121, 55089 (2017). * Tort, A. B. L. et al. Dynamic cross-frequency couplings of local field potential oscillations in rat striatum and hippocampus during performance of a
T-maze task. _Proc. Natl. Acad. Sci. USA_ 105, 20517–20522 (2008). Article ADS CAS PubMed PubMed Central Google Scholar * Tort, A. B. L., Komorowski, R. W., Manns, J. R., Kopell, N.
J. & Eichenbaum, H. Theta-gamma coupling increases during the learning of item-context associations. _Proc. Natl. Acad. Sci. USA_ 106, 20942–20947 (2009). Article ADS CAS PubMed
PubMed Central Google Scholar * Tang, Q. S. et al. Pyramidal and stellate cell specificity of grid and border representations in layer 2 of medial entorhinal cortex. _Neuron_ 84, 1191–1197
(2014). Article CAS PubMed PubMed Central Google Scholar * Tang, Q. S. et al. Anatomical organization and spatiotemporal firing patterns of layer 3 neurons in the rat medial entorhinal
cortex. _J. Neurosci._ 35, 12346–12354 (2015). Article CAS PubMed PubMed Central Google Scholar * Yi, T. T. et al. A sleep-specific midbrain target for sevoflurane anesthesia. _Adv.
Sci_. 10, 2300189 (2023). Download references ACKNOWLEDGEMENTS This research was supported by grants from the National Natural Science Foundation of China (32371038 to C.H., and 31921003 to
Z.A.H.), the National Major Project of China Science and Technology Innovation 2030 for Brain Science and Brain-Inspired Technology (2021ZD0203201 to C.H., and 2021ZD0203400 to Z.A.H.) and
the Natural Science Foundation of Chongqing (2022NSCQ-JQX0019 to C.H.). AUTHOR INFORMATION Author notes * These authors contributed equally: Qin Xiao, Minmin Lu. AUTHORS AND AFFILIATIONS *
Department of Physiology, Third Military Medical University, Chongqing, China Qin Xiao, Minmin Lu, Xiaolong Zhang, Xin Li, Ruyi Wen, Na Wang, Ling Qian, Yixiang Liao, Shuancheng Ren, Jianxia
Xia, Fenlan Luo, Zhian Hu & Chao He * Department of Neurosurgery, General Hospital of Chinese PLA Central Theater Command, Wuhan, China Jiangheng Guan * Department of Physiology,
College of Basic Medical Sciences of Jilin University, Changchun, China Zehui Zhang * Center for Neurointelligence, School of Medicine, Chongqing University, Chongqing, China Xiang Liao *
Department of Sleep and Psychology, Chongqing Health Center for Women and Children, Chongqing, China Chenggang Jiang * Sleep and Psychology Center, Bishan Hospital of Chongqing Medical
University, Chongqing, China Faguo Yue * Department of Neurology, Southwest Hospital, Third Military Medical University, Chongqing, China Jun Hu * Chongqing Institute for Brain and
Intelligence, Guangyang Bay Laboratory, Chongqing, China Zhian Hu Authors * Qin Xiao View author publications You can also search for this author inPubMed Google Scholar * Minmin Lu View
author publications You can also search for this author inPubMed Google Scholar * Xiaolong Zhang View author publications You can also search for this author inPubMed Google Scholar *
Jiangheng Guan View author publications You can also search for this author inPubMed Google Scholar * Xin Li View author publications You can also search for this author inPubMed Google
Scholar * Ruyi Wen View author publications You can also search for this author inPubMed Google Scholar * Na Wang View author publications You can also search for this author inPubMed Google
Scholar * Ling Qian View author publications You can also search for this author inPubMed Google Scholar * Yixiang Liao View author publications You can also search for this author inPubMed
Google Scholar * Zehui Zhang View author publications You can also search for this author inPubMed Google Scholar * Xiang Liao View author publications You can also search for this author
inPubMed Google Scholar * Chenggang Jiang View author publications You can also search for this author inPubMed Google Scholar * Faguo Yue View author publications You can also search for
this author inPubMed Google Scholar * Shuancheng Ren View author publications You can also search for this author inPubMed Google Scholar * Jianxia Xia View author publications You can also
search for this author inPubMed Google Scholar * Jun Hu View author publications You can also search for this author inPubMed Google Scholar * Fenlan Luo View author publications You can
also search for this author inPubMed Google Scholar * Zhian Hu View author publications You can also search for this author inPubMed Google Scholar * Chao He View author publications You can
also search for this author inPubMed Google Scholar CONTRIBUTIONS C.H., Z.A.H., J.H., S.C.R. and J.X.X. conceived the study. Z.A.H., C.H., F.L.L., J.X.X., and S.C.R. designed the
experiments. Q.X., M.M.L., X.L.Z., J.H.G., X.L., R.Y.W., N.W., L.Q., Y.X.L., Z.H.Z., X.L. and C.H. executed the experiments and conducted statistical analysis. C.H., M.M.L., Q.X. and Z.A.H.
wrote the paper with the help of C.G.J., F.G.Y. and J.H.. All authors read and commented on the manuscript. CORRESPONDING AUTHORS Correspondence to Fenlan Luo, Zhian Hu or Chao He. ETHICS
DECLARATIONS COMPETING INTERESTS The authors declare no competing interests. PEER REVIEW PEER REVIEW INFORMATION _Nature Communications_ thanks Xiao Yu and the other, anonymous, reviewer(s)
for their contribution to the peer review of this work. A peer review file is available. ADDITIONAL INFORMATION PUBLISHER’S NOTE Springer Nature remains neutral with regard to jurisdictional
claims in published maps and institutional affiliations. SUPPLEMENTARY INFORMATION SUPPLEMENTARY INFORMATION REPORTING SUMMARY SOURCE DATA SOURCE DATA TRANSPARENT PEER REVIEW FILE RIGHTS
AND PERMISSIONS OPEN ACCESS This article is licensed under a Creative Commons Attribution-NonCommercial-NoDerivatives 4.0 International License, which permits any non-commercial use,
sharing, distribution and reproduction in any medium or format, as long as you give appropriate credit to the original author(s) and the source, provide a link to the Creative Commons
licence, and indicate if you modified the licensed material. You do not have permission under this licence to share adapted material derived from this article or parts of it. The images or
other third party material in this article are included in the article’s Creative Commons licence, unless indicated otherwise in a credit line to the material. If material is not included in
the article’s Creative Commons licence and your intended use is not permitted by statutory regulation or exceeds the permitted use, you will need to obtain permission directly from the
copyright holder. To view a copy of this licence, visit http://creativecommons.org/licenses/by-nc-nd/4.0/. Reprints and permissions ABOUT THIS ARTICLE CITE THIS ARTICLE Xiao, Q., Lu, M.,
Zhang, X. _et al._ Isolated theta waves originating from the midline thalamus trigger memory reactivation during NREM sleep in mice. _Nat Commun_ 15, 9231 (2024).
https://doi.org/10.1038/s41467-024-53522-9 Download citation * Received: 17 January 2024 * Accepted: 11 October 2024 * Published: 25 October 2024 * DOI:
https://doi.org/10.1038/s41467-024-53522-9 SHARE THIS ARTICLE Anyone you share the following link with will be able to read this content: Get shareable link Sorry, a shareable link is not
currently available for this article. Copy to clipboard Provided by the Springer Nature SharedIt content-sharing initiative