Long-term, in toto live imaging of cardiomyocyte behaviour during mouse ventricle chamber formation at single-cell resolution
- Select a language for the TTS:
- UK English Female
- UK English Male
- US English Female
- US English Male
- Australian Female
- Australian Male
- Language selected: (auto detect) - EN
Play all audios:

ABSTRACT Mapping of the holistic cell behaviours sculpting the four-chambered mammalian heart has been a goal or previous studies, but so far only success in transparent invertebrates and
lower vertebrates with two-chambered hearts has been achieved. Using a live-imaging system comprising a customized vertical light-sheet microscope equipped with a mouse embryo culture
module, a heartbeat-gated imaging strategy and a digital image processing framework, we realized volumetric imaging of developing mouse hearts at single-cell resolution and with
uninterrupted cell lineages for up to 1.5 d. Four-dimensional landscapes of Nppa+ cardiomyocyte cell behaviours revealed a blueprint for ventricle chamber formation by which biased outward
migration of the outermost cardiomyocytes is coupled with cell intercalation and horizontal division. The inner-muscle architecture of trabeculae was developed through dual mechanisms: early
fate segregation and transmural cell arrangement involving both oriented cell division and directional migration. Thus, live-imaging reconstruction of uninterrupted cell lineages affords a
transformative means for deciphering mammalian organogenesis. Access through your institution Buy or subscribe This is a preview of subscription content, access via your institution ACCESS
OPTIONS Access through your institution Access Nature and 54 other Nature Portfolio journals Get Nature+, our best-value online-access subscription $29.99 / 30 days cancel any time Learn
more Subscribe to this journal Receive 12 print issues and online access $209.00 per year only $17.42 per issue Learn more Buy this article * Purchase on SpringerLink * Instant access to
full article PDF Buy now Prices may be subject to local taxes which are calculated during checkout ADDITIONAL ACCESS OPTIONS: * Log in * Learn about institutional subscriptions * Read our
FAQs * Contact customer support SIMILAR CONTENT BEING VIEWED BY OTHERS AN ORGAN-WIDE SPATIOTEMPORAL TRANSCRIPTOMIC AND CELLULAR ATLAS OF THE REGENERATING ZEBRAFISH HEART Article Open access
19 April 2025 SPATIOTEMPORAL SINGLE-CELL RNA SEQUENCING OF DEVELOPING CHICKEN HEARTS IDENTIFIES INTERPLAY BETWEEN CELLULAR DIFFERENTIATION AND MORPHOGENESIS Article Open access 19 March 2021
SPATIALLY ORGANIZED CELLULAR COMMUNITIES FORM THE DEVELOPING HUMAN HEART Article Open access 13 March 2024 DATA AVAILABILITY Additional raw images of key experiments have been deposited in
Figshare (https://figshare.com/projects/Long-term_live_imaging_of_mouse_embryonic_heart/74532). All of the other data supporting the findings of this study are available from the
corresponding author upon reasonable request. CODE AVAILABILITY Codes for image pre-processing are available at https://sourceforge.net/projects/grapebio/. REFERENCES * Meilhac, S. M.,
Lescroart, F., Blanpain, C. & Buckingham, M. E. Cardiac cell lineages that form the heart. _Cold Spring Harb. Perspect. Med._ 4, a013888 (2014). Article Google Scholar * Kelly, R. G.,
Buckingham, M. E. & Moorman, A. F. Heart fields and cardiac morphogenesis. _Cold Spring Harb. Perspect. Med._ 4, a015750 (2014). Article Google Scholar * Vincent, S. D. &
Buckingham, M. E. How to make a heart: the origin and regulation of cardiac progenitor cells. _Curr. Top. Dev. Biol._ 90, 1–41 (2010). Article Google Scholar * Sedmera, D., Pexieder, T.,
Vuillemin, M., Thompson, R. P. & Anderson, R. H. Developmental patterning of the myocardium. _Anat. Rec._ 258, 319–337 (2000). Article CAS Google Scholar * Hoffman, J. I. E., Kaplan,
S. & Liberthson, R. R. Prevalence of congenital heart disease. _Am. Heart J._ 147, 425–439 (2004). Article Google Scholar * Keller, P. J., Schmidt, A. D., Wittbrodt, J. & Stelzer,
E. H. K. Reconstruction of zebrafish early embryonic development by scanned light sheet microscopy. _Science_ 322, 1065–1069 (2008). Article CAS Google Scholar * Ichikawa, T. et al. Live
imaging and quantitative analysis of gastrulation in mouse embryos using light-sheet microscopy and 3D tracking tools. _Nat. Protoc._ 9, 575–585 (2014). Article CAS Google Scholar * Amat,
F. et al. Fast, accurate reconstruction of cell lineages from large-scale fluorescence microscopy data. _Nat. Methods_ 11, 951–958 (2014). Article CAS Google Scholar * McDole, K. et al.
In toto imaging and reconstruction of post-implantation mouse development at the single-cell level. _Cell_ 175, 859–876.e33 (2018). Article CAS Google Scholar * Chen, B. C. et al. Lattice
light-sheet microscopy: imaging molecules to embryos at high spatiotemporal resolution. _Science_ 346, 1257998 (2014). Article Google Scholar * Royer, L. A. et al. Adaptive light-sheet
microscopy for long-term, high-resolution imaging in living organisms. _Nat. Biotechnol._ 34, 1267–1278 (2016). Article CAS Google Scholar * Udan, R. S., Piazza, V. G., Hsu, C. W.,
Hadjantonakis, A. K. & Dickinson, M. E. Quantitative imaging of cell dynamics in mouse embryos using light-sheet microscopy. _Development_ 141, 4406–4414 (2014). Article CAS Google
Scholar * Skylaki, S., Hilsenbeck, O. & Schroeder, T. Challenges in long-term imaging and quantification of single-cell dynamics. _Nat. Biotechnol._ 34, 1137–1144 (2016). Article CAS
Google Scholar * Massarwa, R. & Niswander, L. In toto live imaging of mouse morphogenesis and new insights into neural tube closure. _Development_ 140, 226–236 (2013). Article CAS
Google Scholar * Tyser, R. C. et al. Calcium handling precedes cardiac differentiation to initiate the first heartbeat. _eLife_ 5, e17113 (2016). Article Google Scholar * Ivanovitch, K.,
Temino, S. & Torres, M. Live imaging of heart tube development in mouse reveals alternating phases of cardiac differentiation and morphogenesis. _eLife_ 6, e30668 (2017). Article Google
Scholar * Udan, R. S. & Dickinson, M. E. Imaging mouse embryonic development. _Methods Enzymol._ 476, 329–349 (2010). Article Google Scholar * Kelly, D. P. & Scarpulla, R. C.
Transcriptional regulatory circuits controlling mitochondrial biogenesis and function. _Genes Dev._ 18, 357–368 (2004). Article CAS Google Scholar * Zamir, L. et al. Nkx2.5 marks
angioblasts that contribute to hemogenic endothelium of the endocardium and dorsal aorta. _eLife_ 6, e20994 (2017). Article Google Scholar * Tian, X. et al. Identification of a hybrid
myocardial zone in the mammalian heart after birth. _Nat. Commun._ 8, 87 (2017). Article Google Scholar * De Boer, B. A., van den Berg, G., de Boer, P. A. J., Moorman, A. F. M. &
Ruijter, J. M. Growth of the developing mouse heart: an interactive qualitative and quantitative 3D atlas. _Dev. Biol._ 368, 203–213 (2012). Article CAS Google Scholar * MacGrogan, D.,
Nus, M. & de la Pompa, J. L. Notch signaling in cardiac development and disease. _Curr. Top. Dev. Biol._ 92, 333–365 (2010). Article CAS Google Scholar * Grego-Bessa, J. et al. Notch
signaling is essential for ventricular chamber development. _Dev. Cell_ 12, 415–429 (2007). Article CAS Google Scholar * Del Monte-Nieto, G. et al. Control of cardiac jelly dynamics by
NOTCH1 and NRG1 defines the building plan for trabeculation. _Nature_ 557, 439–445 (2018). Article CAS Google Scholar * Li, J. et al. Single-cell lineage tracing reveals that oriented
cell division contributes to trabecular morphogenesis and regional specification. _Cell Rep._ 15, 158–170 (2016). Article CAS Google Scholar * Chen, H. et al. BMP10 is essential for
maintaining cardiac growth during murine cardiogenesis. _Development_ 131, 2219–2231 (2004). Article CAS Google Scholar * Harris, L., Zalucki, O. & Piper, M. BrdU/EdU dual labeling to
determine the cell-cycle dynamics of defined cellular subpopulations. _J. Mol. Histol._ 49, 229–234 (2018). Article CAS Google Scholar * Christoffels, V. M. et al. Chamber formation and
morphogenesis in the developing mammalian heart. _Dev. Biol._ 223, 266–278 (2000). Article CAS Google Scholar * Foudi, A. et al. Analysis of histone 2B-GFP retention reveals slowly
cycling hematopoietic stem cells. _Nat. Biotechnol._ 27, 84–90 (2009). Article CAS Google Scholar * Liebling, M., Forouhar, A. S., Gharib, M., Fraser, S. E. & Dickinson, M. E.
Four-dimensional cardiac imaging in living embryos via postacquisition synchronization of nongated slice sequences. _J. Biomed. Opt._ 10, 054001 (2005). Article Google Scholar * Taylor, J.
M. Optically gated beating-heart imaging. _Front. Physiol._ 5, 481 (2014). PubMed PubMed Central Google Scholar * Takahashi, M., Makino, S., Kikkawa, T. & Osumi, N. Preparation of
rat serum suitable for mammalian whole embryo culture. _J. Vis. Exp._ 2014, e51969 (2014). Google Scholar * Yue, Y. et al. Long-term, in toto live imaging of the developing mouse heart.
_Protoc. Exch._ https://doi.org/10.21203/rs.2.21499/v1 (2020). * Liu, Z. et al. Fscn1 is required for the trafficking of TGF-β family type I receptors during endoderm formation. _Nat.
Commun._ 7, 12603 (2016). Article CAS Google Scholar * Reinhard, E. et al. _High Dynamic Range Imaging: Acquisition, Display, and Image-Based Lighting_ (Elsevier Science, 2010). * Barber,
C. B., Dobkin, D. P. & Huhdanpaa, H. The quickhull algorithm for convex hulls. _ACM Trans. Math. Softw._ 22, 469–483 (1996). Article Google Scholar * Schroeder, W., Martin, K. &
Lorensen, B. _The Visualization Toolkit: An Object-oriented Approach to 3D Graphics_ (Kitware, 2006). Download references ACKNOWLEDGEMENTS We thank R. H. Harvey for reviewing this
manuscript, I. C. Bruce for manuscript editing, and Y. Xu, L. Yuan and E. Yao for technical assistance. A.H. was supported by grants from the National Basic Research Program of China
(2017YFA0103402 and 2019YFA0801802), National Natural Science Foundation of China (31571487, 31771607 and 31327901), Peking-Tsinghua Center for Life Sciences and 1000 Youth Talents Program
of China. H.C. was supported by grants from the National Key Technologies R&D Program (SQ2011SF11B01041), National Basic Research Program of China (2016YFA0500403) and National Natural
Science Foundation of China (31521062). W.Z. was supported by grants from the National Key Technologies R&D Program (2018YFA0109600). R.W. was supported by grants from the National
Postdoctoral Program for Innovative Talents (8206200030). AUTHOR INFORMATION Author notes * These authors contributed equally: Yanzhu Yue, Weijian Zong, Xin Li, Jinghang Li, Youdong Zhang,
Runlong Wu. AUTHORS AND AFFILIATIONS * State Key Laboratory of Membrane Biology, Beijing Key Laboratory of Cardiometabolic Molecular Medicine, Institute of Molecular Medicine,
Peking-Tsinghua Center for Life Sciences, Peking University, Beijing, China Yanzhu Yue, Weijian Zong, Xin Li, Jinghang Li, Youdong Zhang, Runlong Wu, Qianhao Wang, Yunkun Bian, Xianhong Yu,
Liangyi Chen, Heping Cheng & Aibin He * State Key Laboratory of Advanced Optical Communication Systems and Networks, School of Electronic Engineering and Computer Science, Peking
University, Beijing, China Runlong Wu & Yunfeng Zhang * School of Mechanical Engineering and Automation, Beihang University, Beijing, China Yazui Liu, Jiahao Cui, Gang Zhao & Wenlei
Xiao * Institute of Computing Technology, Chinese Academy of Sciences, Beijing, China Yao Liu & Guangming Tan * State Key Laboratory of Cell Biology, CAS Center for Excellence in
Molecular Cell Science, Institute of Biochemistry and Cell Biology, University of the Chinese Academy of Sciences, Shanghai, China Bin Zhou Authors * Yanzhu Yue View author publications You
can also search for this author inPubMed Google Scholar * Weijian Zong View author publications You can also search for this author inPubMed Google Scholar * Xin Li View author publications
You can also search for this author inPubMed Google Scholar * Jinghang Li View author publications You can also search for this author inPubMed Google Scholar * Youdong Zhang View author
publications You can also search for this author inPubMed Google Scholar * Runlong Wu View author publications You can also search for this author inPubMed Google Scholar * Yazui Liu View
author publications You can also search for this author inPubMed Google Scholar * Jiahao Cui View author publications You can also search for this author inPubMed Google Scholar * Qianhao
Wang View author publications You can also search for this author inPubMed Google Scholar * Yunkun Bian View author publications You can also search for this author inPubMed Google Scholar *
Xianhong Yu View author publications You can also search for this author inPubMed Google Scholar * Yao Liu View author publications You can also search for this author inPubMed Google
Scholar * Guangming Tan View author publications You can also search for this author inPubMed Google Scholar * Yunfeng Zhang View author publications You can also search for this author
inPubMed Google Scholar * Gang Zhao View author publications You can also search for this author inPubMed Google Scholar * Bin Zhou View author publications You can also search for this
author inPubMed Google Scholar * Liangyi Chen View author publications You can also search for this author inPubMed Google Scholar * Wenlei Xiao View author publications You can also search
for this author inPubMed Google Scholar * Heping Cheng View author publications You can also search for this author inPubMed Google Scholar * Aibin He View author publications You can also
search for this author inPubMed Google Scholar CONTRIBUTIONS A.H. and H.C. supervised the study. A.H. designed the experiments. W.Z. and R.W. designed the vLSFM and heartbeat-gated imaging
system under the supervision of L.C., Yunfeng Z., A.H. and H.C. Y.Y., X.L. and W.Z. designed the advanced embryo culture system under the supervision of A.H. Y.Y., X.L., Q.W., Y.B. and X.Y.
performed the experiments. J.L., Youdong Z., Yazui L., J.C. and G.Z. developed the computational algorithms under the supervision of W.X., H.C. and A.H. Yao L. and G.T. contributed to the
integration of TGMM. B.Z. provided the reagents. A.H., H.C., Y.Y., X.L. and YoudongZ. wrote the paper with input from all other authors. All authors participated in data discussion and
interpretation. CORRESPONDING AUTHORS Correspondence to Wenlei Xiao, Heping Cheng or Aibin He. ETHICS DECLARATIONS COMPETING INTERESTS The authors declare no competing interests. ADDITIONAL
INFORMATION PUBLISHER’S NOTE Springer Nature remains neutral with regard to jurisdictional claims in published maps and institutional affiliations. EXTENDED DATA EXTENDED DATA FIG. 1 THE
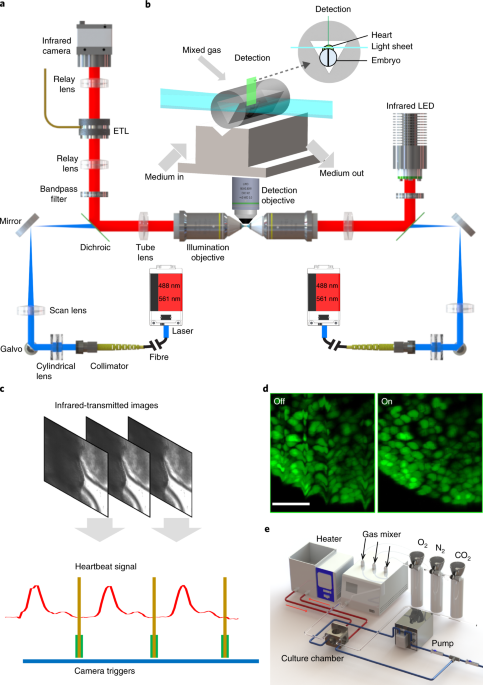
VLSFM MICROSCOPE EQUIPPED WITH EMBRYO CULTURE SYSTEM AND IMAGING SYNCHRONIZATION MODULE. A, Close-up of the vLSFM imaging system, including the laser light source (1), two illumination arms
(2), one detection arm with a sCMOS camera (3), near infrared heart-beating detection path (4), embryo culture and imaging chamber (5), and the 3-axis stage (6). B, 3D model about how to
image a mouse embryo by vLSFM. The anterior, posterior and dorsal view of the mouse sheltered the light path so only the lateral and ventral view of the heart could use for illumination and
detection. C, Schematic of the optical tracking of heartbeats using near infrared (850 nm) bright-field imaging at 50 Hz. D, On-line processing to sum absolute pixel intensity changes
between two temporally adjacent images. A trigger for light-sheet fluorescence image acquisition was sent when the sum was below a designated threshold, indicating that the heart was
entering diastole. For a volumetric image stack of 160 layers at 2.5-μm steps, the entire stack was completed within 2 min at a heart rate of 107 ± 18 bpm. EXTENDED DATA FIG. 2 AGAROSE
HOLDER WITH TRIANGULAR HOLLOW DESIGNED FOR MOUSE EMBRYONIC HEART CULTURE AND IMAGING. A, Component B inserted with component A is filled with 2% low melting-temperature agarose. Triangular
hollow is formed after removing component A. B, Sucking the mouse embryo with culture medium to the hollow in the agarose holder. C, Comparison of embryos cultured in a Petri dish (n = 19)
versus in a triangular hollow agarose (n = 11). Embryonic hearts were evaluated by two parameters, the morphology and size. Hearts at 3.0 exhibited the similar morphology and size with the
freshly dissected counterparts. Heart at 2.0 exhibited either the similar morphology or size with the freshly dissected counterparts. Hearts at 1.0 exhibited less developmental progression
compared with the freshly dissected counterparts. Data are mean ± s.d. Source data for c are available online. Source data EXTENDED DATA FIG. 3 CONTROLLING AND MONITORING OF TEMPERATURE AND
OXYGEN IN CULTURE MEDIUM. A, Real-time monitoring of the dissolved oxygen (green) and temperature (orange) of culture medium for a long period of time. Data are representative of three
independent experiments. O2 is added to 5%, 10%, 20% and 40% at the indicated time of 5 h, 8 h, 11 h and 14 h. The medium is heated to 37 °C at 0.8 h. B, A close-up as shown in (A). The
medium temperature goes up to 37 °C in 0.2 h. C, Dissolved oxygen concentration in the culture medium. A good linear relationship has been observed when increasing oxygen concentration from
5% to 40%. Source data for A–C are available online. Source data EXTENDED DATA FIG. 4 CHARACTERIZATION OF NPPA REPORTER MICE AT DIFFERENT DEVELOPMENTAL STAGES. A, Schematic of the
cardiomyocyte-nuclei (H2B-GFP) induction scheme in the Nppa reporter mouse line. Doxycycline (2 mg, _i.p_.) was injected into pregnant mice 6 h prior to embryo harvesting. B–I,
Immunofluorescence staining of mouse embryos from E8.0 to E10.5. The images are representative of three independent experiments. Transverse sections 5 μm thick were stained for the
cardiomyocyte marker TNNI3 and nuclei were counterstained with DAPI. OFT, out flow tract. RV, right ventricle. LV, left ventricle. RA, right atrium. LA, left atrium. S, somites. E, embryo
stage. Scale bars, 200 μm in embryos and 100 μm in sections. EXTENDED DATA FIG. 5 COMPARISON BETWEEN THE IMAGED AND FRESHLY DISSECTED EMBRYONIC HEARTS. A, The chart showing the imaging
duration from 14 imaged mouse embryos in this study. The bars with the darker shades indicate the embryos shown as representative images. B, Quality control of imaged embryos. This
evaluation is based on scoring long axis length, short axis length and cell number of left ventricle (LV) by arbitrary value (highest to lowest, 4.0 to 1.0) (Online methods). C, Quantitative
analysis of imaged and freshly dissected embryos by the long axis, short axis and cell number of LV. Of note, E8.5 + 24 h (after 24 h imaging, n = 3) embryos closely matched E9.5 mouse
heart (n = 3) from these aspects. Data are mean ± s.d. D, 3D-reconstructions of a representative E8.5 + 24 h imaged embryo and a freshly dissected E9.5 counterpart. The images are
representative of three independent experiments. E, Comparison of optical sections from live imaging data and cryo-sections of mouse heart at the corresponding developmental stages.
Representative immunostaining of cryo-sections of three independent experiments at indicated developmental stages matching imaging time points (right panels). Gray spheres, cell nuclei from
raw image data; blue spheres, digital nuclei of outer layer cells (left panels); red spheres, digital nuclei of inner layer cells (middle panels); magenta in the cryosections, cytoplasmic
cardiomyocytes (right panel); green spheres, Nppa positive nuclei. Z-stack at 5 μm. For C, n represents the number of independent animals. Source data for C are available online. Scale bars,
50 μm. Source data EXTENDED DATA FIG. 6 IMAGING PRE-PROCESSING FRAMEWORK AND EVALUATION OF ERRORS IN CELL SEGMENTATION AND LINEAGE TRACKING. A, Types of imaging analysis challenges
(magenta, segmented image results) on orthogonal image slices. SNR, signal-to-noise. B, The image pre-processing framework comprising background subtraction, median filter de-noising, single
image HDR (siHDR), light balance among stacks, and spatio-temporal alignment in between layers and between stacks. HDR, high dynamic range. C, Examples of segmentation errors, including
missing-segmentation, false-segmentation, over- and under-segmentations represented. D–G, Different types of lineaging errors. The xy, xz and yz planes are shown in the figures. The higher
magnification image is on the top left corner. Lineaging error due to adding one irrelevant cell to the lineage (D). Lineaging error owing to missing one cell at either non-dividing (E) or
dividing phase (F). Lineaging error due to erroneously linking to a different lineage (G). Note, evaluation of these errors is applied only when obvious image drift is observed during
imaging. Source data for B are available online. Scale bars, 10 μm in A,C, 100 μm in D–G. Source data EXTENDED DATA FIG. 7 EDU/BRDU DUAL LABELING OF COMPACT AND TRABECULAR CARDIOMYOCYTES. A,
Schematic of EdU and BrdU sequential labeling experimental design. Pregnant wildtype animals at E9.5 and E10.0 were sequentially pulsed using 5-ethynyl-2′-deoxyuridine (EdU) and
5-bromo-2′-deoxyuridine (BrdU), two thymidine analogs, spaced 1 h apart. B, Immunofluorescence of EdU+ (magenta) and BrdU+ (green) cells in compact (Com) and trabecular (Tra) layers. TNNI3
(gray) and DAPI (blue) were used to identify cardiomyocytes. The representative images of three independent experiments depict cardiomyocytes at different phases of cell cycle containing
EdU+ (magenta arrowhead), BrdU+ (green arrowhead) and EdU+ BrdU+ (white arrow). C, Quantification of the TNNI3 + cells (cardiomyocytes) that were EdU+ (left), BrdU+ (middle) or EdU+BrdU+
(right) in compact and trabecular layers of E9.5 (n = 4) and E10.0 embryos (n = 5). Two-tailed Student’s t test was used to determine the statistical significance. **, P < 0.05; ***, P
< 0.001. Source data for C are available online. Scale bars, 100 μm. Source data SUPPLEMENTARY INFORMATION SUPPLEMENTARY INFORMATION Supplementary Notes. REPORTING SUMMARY SUPPLEMENTARY
TABLE 1 This table provides the different characteristics about our vLSFM and other light sheet microscopes, containing light path, sample types, imaging mode, z depth, circulation system,
mounting methods, imaging periods, sample monitoring and imaging beating heart. SUPPLEMENTARY TABLES 2 Table showing the advantages and disadvantages about real-time gating and image
registration (our work), retrospective gating and prospective gating. SUPPLEMENTARY VIDEO 1 VLSFM RECORDING OF E7.75 MOUSE EMBRYO CARDIOGENESIS. Representative video showing the early
developing heart of _Nkx2–5_Cre::_Rosa26_H2B-mCherry mice from the cardiac crescent stage (E7.75) to heart tube formation. Images were recorded at 3-min intervals, at an imaging depth of 400
μm, starting from E7.75 for an imaging time of ~12 h. The maximum-intensity _Z_ projections were made to demonstrate the process of early mouse development. Scale bar: 100 μm. SUPPLEMENTARY
VIDEO 2 3D RECONSTRUCTIONS OF CULTURED AND FRESHLY DISSECTED EMBRYOS. Representative video showing the 3D morphology of _Nkx2–5_Cre::_Rosa26_H2B-mCherry embryonic hearts under cultured and
freshly dissected conditions. Images were acquired at an imaging depth of 550 μm and a step size of 1 μm, using our vLSFM. The 3D reconstructions showed the marker gene expression pattern
and heart gross morphology of E8.5 + 24 h imaged embryos and freshly dissected E9.5 counterparts. Scale bar: 100 μm. SUPPLEMENTARY VIDEO 3 VLSFM RECORDING OF E8.5 MOUSE EMBRYONIC HEART
VENTRICLE MORPHOGENESIS. Representative video showing the early developing heart of _Npp_artTA::_Col1a1_tetO-H2BGFP/+ mice. This inducible reporter is CM specific, predominantly in the left
ventricle and sporadically in the right ventricle for this imaging time of 32 h, starting at E8.5. The volumetric images were recorded at 3-min intervals and nuclear GFP was excited at 488
nm. Image stacks of 160 planes encompassing the embryo heart were acquired at a step size of 2.5 μm. In total, 644 time points are shown in this video. The movie displays maximum-intensity
_Z_ and _Y_ projections corresponding to ventral and anterior views of the embryonic heart. The field of view was cropped to reduce the video size. Scale bar: 100 μm. SUPPLEMENTARY VIDEO 4
COMPARISON BETWEEN SPATIOTEMPORAL ALIGNMENT DATA AND RAW DATA FOR THE E8.5 MOUSE EMBRYONIC HEART. The representative video displayed both spatiotemporal alignment data after pre-processing
(left panel) related to Extended Data Fig. 6b and raw data (right panel) for the consecutive time points of imaging the early developing heart of NppartTA::Col1a1tetO-H2BGFP/+ mice. Scale
bar: 100 μm. SUPPLEMENTARY VIDEO 5 AN EXAMPLE VALIDATING THE CORRECTED CELL TRACKS IN THE ROTATED IMAGES. Two crossing cells in two-dimensional data can be recognized accurately in our 3D
image data generated from time-lapse light-sheet microscopy with high lineage linkage accuracy. SUPPLEMENTARY VIDEO 6 VISUALIZATION AND COLOUR INDEXING OF CELL LINEAGE TRACING IN EARLY MOUSE
HEART DEVELOPMENT. Semi-automated cell lineage tracing is shown in ventral, anterior and rotating views of the digital embryo from the microscopy imaging data in Supplementary Video 3. Each
cell lineage is encoded with one random colour at the starting point, and the colours are propagated forwards based on the automated cell lineage information. The solid lines indicate cell
movements within ten time points (0.5 h). SUPPLEMENTARY VIDEO 7 VISUALIZATION AND COLOUR INDEXING OF CELL MOVEMENT DIRECTIONS IN EARLY MOUSE HEART DEVELOPMENT. Visualization of cell movement
directions at different time points from the microscopy imaging data in Supplementary Video 3. The directions were analysed at 3-min intervals (movements: yellow: anterior; red: posterior;
cyan: left; green: right; magenta: ventral; blue: dorsal). SUPPLEMENTARY VIDEO 8 VISUALIZATION AND COLOUR INDEXING OF CELL MOVEMENT SPEED IN EARLY MOUSE HEART DEVELOPMENT. Visualization of
speeds of cell movement at different time points from the microscopy imaging data in Supplementary Video 3. Speeds ranged from 0–2 μm min−1. SUPPLEMENTARY VIDEO 9 VISUALIZATION AND COLOUR
INDEXING OF CELL DIVISION RATES IN EARLY MOUSE HEART DEVELOPMENT. Visualization of cell division rates at different time points from the microscopy imaging data in Supplementary Video 3.
Colour codes indicate the rates of cell division. SUPPLEMENTARY VIDEO 10 REPRESENTATION OF SEMI-AUTOMATIC COMPUTATIONAL SEPARATION OF TRABECULAR (INNER LAYER) AND COMPACT (OUTER LAYER)
CELLS. Microscopy imaging data from Supplementary Video 3 were used. Trabecular cells are shown in red and compact cells are shown in blue. Scale bar: 100 μm. SUPPLEMENTARY VIDEO 11 AN
EXAMPLE OF THE INTERCALATION (TYPE I) MECHANISM BY WHICH THE SURFACE LAYER IS FILLED. The cells from the secondary outer layer were intercalated to the surface layer. SUPPLEMENTARY VIDEO 12
AN EXAMPLE OF THE HORIZONTAL DIVIDING (TYPE II) MECHANISM BY WHICH THE SURFACE LAYER IS FILLED. The cells from the surface layer divided horizontally to fill the surface layer. SUPPLEMENTARY
VIDEO 13 AN EXAMPLE OF TRABECULATION VIA THE TYPE I MECHANISM. One cell inhabits the trabecular layer and self-expands through cell division, indicating the earlier segregation of
differentiated CMs from cardiac progenitor cells. SUPPLEMENTARY VIDEO 14 AN EXAMPLE OF TRABECULATION VIA THE TYPE 2A MECHANISM. One trabecular cell originated from the compact layer. Shortly
after division, one daughter cell stayed in the compact layer while the other contributed to the trabecular layer. SUPPLEMENTARY VIDEO 15 AN EXAMPLE OF TRABECULATION VIA THE TYPE 2B
MECHANISM. Two daughter cells did not invade the inner layer immediately after the last cell division of their parental cell in the compact layer, but subsequently migrated into and
populated trabecular cells, suggesting that the cellular mechanism of directional cell migration contributes to trabecular formation. SOURCE DATA SOURCE DATA FIG. 2 Statistical source data
SOURCE DATA FIG. 3 Statistical source data SOURCE DATA FIG. 4 Statistical source data SOURCE DATA FIG. 5 Statistical source data SOURCE DATA FIG. 6 Statistical source data SOURCE DATA FIG. 7
Statistical source data SOURCE DATA EXTENDED DATA FIG. 2 Statistical source data SOURCE DATA EXTENDED DATA FIG. 3 Statistical source data SOURCE DATA EXTENDED DATA FIG. 5 Statistical source
data SOURCE DATA EXTENDED DATA FIG. 6 Statistical source data SOURCE DATA EXTENDED DATA FIG. 7 Statistical source data RIGHTS AND PERMISSIONS Reprints and permissions ABOUT THIS ARTICLE
CITE THIS ARTICLE Yue, Y., Zong, W., Li, X. _et al._ Long-term, in toto live imaging of cardiomyocyte behaviour during mouse ventricle chamber formation at single-cell resolution. _Nat Cell
Biol_ 22, 332–340 (2020). https://doi.org/10.1038/s41556-020-0475-2 Download citation * Received: 09 September 2019 * Accepted: 31 January 2020 * Published: 02 March 2020 * Issue Date: March
2020 * DOI: https://doi.org/10.1038/s41556-020-0475-2 SHARE THIS ARTICLE Anyone you share the following link with will be able to read this content: Get shareable link Sorry, a shareable
link is not currently available for this article. Copy to clipboard Provided by the Springer Nature SharedIt content-sharing initiative