Near-term transition and longer-term physical climate risks of greenhouse gas emissions pathways
- Select a language for the TTS:
- UK English Female
- UK English Male
- US English Female
- US English Male
- Australian Female
- Australian Male
- Language selected: (auto detect) - EN
Play all audios:

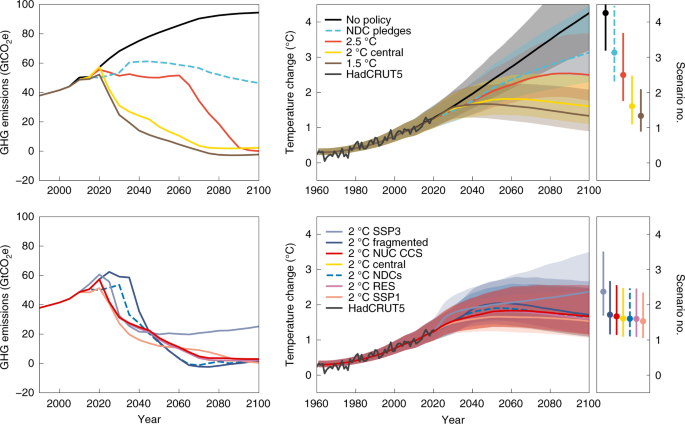
ABSTRACT Policy, business, finance and civil society stakeholders are increasingly looking to compare future emissions pathways across both their associated physical climate risks stemming
from increasing temperatures and their transition climate risks stemming from the shift to a low-carbon economy. Here, we present an integrated framework to explore near-term (to 2030)
transition risks and longer-term (to 2050) physical risks, globally and in specific regions, for a range of plausible greenhouse gas emissions and associated temperature pathways, spanning
1.5–4 °C levels of long-term warming. By 2050, physical risks deriving from major heatwaves, agricultural drought, heat stress and crop duration reductions depend greatly on the temperature
pathway. By 2030, transition risks most sensitive to temperature pathways stem from economy-wide mitigation costs, carbon price increases, fossil fuel demand reductions and coal plant
capacity reductions. Considering several pathways with a 2 °C target demonstrates that transition risks also depend on technological, policy and socio-economic factors. Access through your
institution Buy or subscribe This is a preview of subscription content, access via your institution ACCESS OPTIONS Access through your institution Access Nature and 54 other Nature Portfolio
journals Get Nature+, our best-value online-access subscription $29.99 / 30 days cancel any time Learn more Subscribe to this journal Receive 12 print issues and online access $209.00 per
year only $17.42 per issue Learn more Buy this article * Purchase on SpringerLink * Instant access to full article PDF Buy now Prices may be subject to local taxes which are calculated
during checkout ADDITIONAL ACCESS OPTIONS: * Log in * Learn about institutional subscriptions * Read our FAQs * Contact customer support SIMILAR CONTENT BEING VIEWED BY OTHERS A MULTI-MODEL
ANALYSIS OF LONG-TERM EMISSIONS AND WARMING IMPLICATIONS OF CURRENT MITIGATION EFFORTS Article 22 November 2021 ESTIMATING THE TIMING OF GEOPHYSICAL COMMITMENT TO 1.5 AND 2.0 °C OF GLOBAL
WARMING Article 06 June 2022 ACHIEVING NET ZERO GREENHOUSE GAS EMISSIONS CRITICAL TO LIMIT CLIMATE TIPPING RISKS Article Open access 01 August 2024 DATA AVAILABILITY The datasets generated
during and/or analysed during the current study are available from the corresponding author on reasonable request. The GCAM data system is publicly available at
https://github.com/JGCRI/gcamdata. CODE AVAILABILITY All code used for data analysis and creating the figures is available from the corresponding author on reasonable request. REFERENCES *
Weber, C. et al. Mitigation scenarios must cater to new users. _Nat. Clim. Change_ 8, 845–848 (2018). Article Google Scholar * Carney, M. _Breaking the Tragedy of the Horizon—Climate
Change and Financial Stability_ (Bank of England, 2015); https://www.bis.org/review/r151009a.pdf * _Recommendations of the Task Force on Climate-Related Financial Disclosures_ (TCFD, 2017);
https://www.fsb-tcfd.org/wp-content/uploads/2017/06/FINAL-2017-TCFD-Report-11052018.pdf * Rudebusch, G. D. _Climate Change is a Source of Financial Risk_ (Federal Reserve Bank of San
Francisco, 2021); https://www.frbsf.org/economic-research/publications/economic-letter/2021/february/climate-change-is-source-of-financial-risk/ * Setzer, J. & Vanhala, L. C. Climate
change litigation: a review of research on courts and litigants in climate governance. _WIREs Clim. Change_ 10, e580 (2019). Article Google Scholar * Franta, B. Litigation in the fossil
fuel divestment movement. _Law Policy_ 39, 393–411 (2017). Article Google Scholar * IPCC _Climate Change 2021: The Physical Science Basis_ (eds Masson-Delmotte, V. et al.) (Cambridge Univ.
Press, in the press). * _Origin and Purpose of the Network for Greening the Financial System_ (NGFS, 2019); https://www.ngfs.net/en/about-us/governance/origin-and-purpose * _NGFS Climate
Scenarios for Central Banks and Supervisors_ (NGFS, 2020); https://www.ngfs.net/sites/default/files/medias/documents/820184_ngfs_scenarios_final_version_v6.pdf * _GCAM v5.1 Documentation:
GCAM Model Overview_ (JGCRI, accessed June 2021); http://jgcri.github.io/gcam-doc/v5.1/overview.html * Lowe, J. A. et al. How difficult is it to recover from dangerous levels of global
warming? _Environ. Res. Lett._ 4, 014012 (2009). Article Google Scholar * Arnell, N. W. et al. The global and regional impacts of climate change under Representative Concentration Pathway
forcings and Shared Socioeconomic Pathway socioeconomic scenarios. _Environ. Res. Lett._ 14, 084046 (2019). Article Google Scholar * Arnell, N. W., Lowe, J. A., Challinor, A. J. &
Osborn, T. J. Global and regional impacts of climate change at different levels of global temperature increase. _Clim. Change_ 155, 377–391 (2019). Article Google Scholar * Grant, N.,
Hawkes, A., Napp, T. & Gambhir, A. The appropriate use of reference scenarios in mitigation analysis. _Nat. Clim. Change_ 10, 605–610 (2020). Article Google Scholar * Fawcett, A. A. et
al. Can Paris pledges avert severe climate change? _Science_ 350, 1168–1169 (2015). Article CAS Google Scholar * Riahi, K. et al. The Shared Socioeconomic Pathways and their energy, land
use, and greenhouse gas emissions implications: an overview. _Glob. Environ. Change_ 42, 153–168 (2017). Article Google Scholar * _Macroeconomic and Financial Stability: Implications of
Climate Change_ (NGFS, 2019); https://www.ngfs.net/sites/default/files/medias/documents/ngfs-report-technical-supplement_final_v2.pdf * Gambhir, A., Rogelj, J., Luderer, G., Few, S. &
Napp, T. Energy system changes in 1.5 °C, well below 2 °C and 2 °C scenarios. _Energy Strategy Rev._ 23, 69–80 (2019). Article Google Scholar * Rogelj, J. et al. Scenarios towards limiting
global mean temperature increase below 1.5 °C. _Nat. Clim. Change_ 8, 325–332 (2018). Article CAS Google Scholar * Peters, G. P. et al. Key indicators to track current progress and
future ambition of the Paris Agreement. _Nat. Clim. Change_ 7, 118–122 (2017). Article Google Scholar * Gambhir, A. et al. Assessing the feasibility of global long-term mitigation
scenarios. _Energies_ 10, 89 (2017). Article Google Scholar * Dietz, S., Bowen, A., Dixon, C. & Gradwell, P. ‘Climate value at risk’ of global financial assets. _Nat. Clim. Change_ 6,
676–679 (2016). Article Google Scholar * Stern, N. Economics: current climate models are grossly misleading. _Nature_ 530, 407–409 (2016). Article Google Scholar * Pindyck, R. S. Climate
change policy: what do the models tell us? _J. Econ. Lit._ 51, 860–872 (2013). Article Google Scholar * Roelfsema, M. et al. Taking stock of national climate policies to evaluate
implementation of the Paris Agreement. _Nat. Commun._ 11, 2096 (2020). Article CAS Google Scholar * Hof, A. F. et al. Global and regional abatement costs of nationally determined
contributions (NDCs) and of enhanced action to levels well below 2 °C and 1.5 °C. _Environ. Sci. Policy_ 71, 30–40 (2017). Article Google Scholar * Mercure, J.-F. et al. Modelling
innovation and the macroeconomics of low-carbon transitions: theory, perspectives and practical use. _Clim. Policy_ 19, 1019–1037 (2019). Article Google Scholar * _NGFS Scenario Explorer_
(IIASA, 2020); https://data.ene.iiasa.ac.at/ngfs/#/about * Gambhir, A. Planning a low-carbon energy transition: what can and can’t the models tell us? _Joule_ 3, 1795–1798 (2019). Article
Google Scholar * McCollum, D. L., Gambhir, A., Rogelj, J. & Wilson, C. Energy modellers should explore extremes more systematically in scenarios. _Nat. Energy_ 5, 104–107 (2020).
Article Google Scholar * Luderer, G. et al. Economic mitigation challenges: how further delay closes the door for achieving climate targets. _Environ. Res. Lett._ 8, 034033 (2013). Article
Google Scholar * Fiedler, T. et al. Business risk and the emergence of climate analytics. _Nat. Clim. Change_ 11, 87–94 (2021). Article Google Scholar * Bernstein, A., Gustafson, M. T.
& Lewis, R. Disaster on the horizon: the price effect of sea level rise. _J. Financ. Econ._ 134, 253–272 (2019). Article Google Scholar * Kõberle, A. C., Ganguly, G. & Ostrovnaya,
A. _A Guide to Building Climate-Financial Scenarios for Financial Institutions_ (Grantham Institute, 2021);
https://www.imperial.ac.uk/grantham/publications/all-publications/a-guide-to-building-climate-financial-scenarios-for-financial-institutions.php * Bingler, J. A. & Colesanti Senni, C.
_Taming the Green Swan: How to Improve Climate-Related Financial Risk Assessments_ (CER-ETH, 2020); https://econpapers.repec.org/paper/ethwpswif/20-340.htm * Carlin, D., Peters, G. P. &
Sognnaes, I. _Pathways to Paris: A Practical Guide to Climate Transition Scenarios for Financial Professionals_ (UNEP FI, 2021);
https://www.unepfi.org/publications/banking-publications/pathways-to-paris/ * Battiston, S., Mandel, A., Monasterolo, I., Schütze, F. & Visentin, G. A climate stress-test of the
financial system. _Nat. Clim. Change_ 7, 283–288 (2017). Article Google Scholar * _Financial Stability Review, May 2021_ (European Central Bank, 2021);
https://www.ecb.europa.eu/pub/financial-stability/fsr/html/ecb.fsr202105~757f727fe4.en.html * _The 2021 Biennial Exploratory Scenario on the Financial Risks from Climate Change_ (Bank of
England, 2019); http://www.bankofengland.co.uk/paper/2019/biennial-exploratory-scenario-climate-change-discussion-paper * Fricko, O. et al. The marker quantification of the Shared
Socioeconomic Pathway 2: a middle-of-the-road scenario for the 21st century. _Glob. Environ. Change_ 42, 251–267 (2017). Article Google Scholar * van Vuuren, D. P. et al. Energy, land-use
and greenhouse gas emissions trajectories under a green growth paradigm. _Glob. Environ. Change_ 42, 237–250 (2017). Article Google Scholar * Fujimori, S. et al. SSP3: AIM implementation
of Shared Socioeconomic Pathways. _Glob. Environ. Change_ 42, 268–283 (2017). Article Google Scholar * Monteith, S. & Menon, S. _Achieving Global Climate Goals by 2050: Actionable
Opportunities for this Decade_ (ClimateWorks, 2020); https://www.climateworks.org/report/achieving-global-climate-goals-by-2050-actionable-opportunities-for-this-decade/ * _IPCC AR5
Database—Version 1.0.2_ (IIASA, 2014); https://secure.iiasa.ac.at/web-apps/ene/AR5DB/ * Sato, M., Neuhoff, K., Graichen, V., Schumacher, K. & Matthes, F. Sectors under scrutiny:
evaluation of indicators to assess the risk of carbon leakage in the UK and Germany. _Environ. Resour. Econ._ 60, 99–124 (2015). Article Google Scholar * _TPI Tool—Sector Data_ (Transition
Pathways Initiative, 2021); https://www.transitionpathwayinitiative.org/sectors * Dessens, O., Anandarajah, G. & Gambhir, A. Limiting global warming to 2 °C: what do the latest
mitigation studies tell us about costs, technologies and other impacts? _Energy Strategy Rev._ 13–14, 67–76 (2016). Article Google Scholar * _Expect the Unexpected: The Disruptive Power of
Low-Carbon Technology_ (Carbon Tracker & Grantham Institute, 2017); http://www.carbontracker.org/wp-content/uploads/2017/02/Expect-the-Unexpected_CTI_Imperial.pdf * Bertram, C. et al.
Carbon lock-in through capital stock inertia associated with weak near-term climate policies. _Technol. Forecast. Soc. Change_ 90, 62–72 (2015). Article Google Scholar * Johnson, N. et al.
Stranded on a low-carbon planet: implications of climate policy for the phase-out of coal-based power plants. _Technol. Forecast. Soc. Change_ 90, 89–102 (2015). Article Google Scholar *
Rogelj, J. et al. Energy system transformations for limiting end-of-century warming to below 1.5 °C. _Nat. Clim. Change_ 5, 519–527 (2015). Article Google Scholar * Calvin, K. et al.
Trade-offs of different land and bioenergy policies on the path to achieving climate targets. _Clim. Change_ 123, 691–704 (2014). Article Google Scholar * Calvin, K. et al. GCAM v5.1:
representing the linkages between energy, water, land, climate, and economic systems. _Geosci. Model Dev._ 12, 677–698 (2019). Article CAS Google Scholar * Thomson, A. M. et al. RCP4.5: a
pathway for stabilization of radiative forcing by 2100. _Clim. Change_ 109, 77 (2011). Article CAS Google Scholar * McCollum, D. L. et al. Energy investment needs for fulfilling the
Paris Agreement and achieving the Sustainable Development Goals. _Nat. Energy_ 3, 589–599 (2018). Article Google Scholar * Kaufman, N., Barron, A. R., Krawczyk, W., Marsters, P. &
McJeon, H. A near-term to net zero alternative to the social cost of carbon for setting carbon prices. _Nat. Clim. Change_ 10, 1010–1014 (2020). Article CAS Google Scholar * Iyer, G. et
al. Implications of sustainable development considerations for comparability across nationally determined contributions. _Nat. Clim. Change_ 8, 124–129 (2018). Article Google Scholar *
Wise, M. et al. Implications of limiting CO2 concentrations for land use and energy. _Science_ 324, 1183–1186 (2009). Article CAS Google Scholar * Huppmann, D. et al. _IAMC 1.5_ _C
Scenario Explorer and Data Hosted by IIASA_ (Integrated Assessment Modeling Consortium & International Institute for Applied Systems Analysis, 2018).
https://doi.org/10.22022/SR15/08-2018.15429 * Spencer, T. et al. The 1.5 °C target and coal sector transition: at the limits of societal feasibility. _Clim. Policy_ 18, 335–351 (2018).
Article Google Scholar * Monasterolo, I., Zheng, J. I. & Battiston, S. Climate transition risk and development finance: a carbon risk assessment of China’s overseas energy portfolios.
_China World Econ._ 26, 116–142 (2018). Article Google Scholar * Kriegler, E. et al. Diagnostic indicators for integrated assessment models of climate policy. _Technol. Forecast. Soc.
Change_ 90, 45–61 (2015). Article Google Scholar * Harmsen, M. et al. Integrated assessment model diagnostics: key indicators and model evolution. _Environ. Res. Lett._ 16, 054046 (2021).
Article Google Scholar * Forster, P. M. et al. Evaluating adjusted forcing and model spread for historical and future scenarios in the CMIP5 generation of climate models. _J. Geophys. Res.
Atmos._ 118, 1139–1150 (2013). Article Google Scholar * Friedlingstein, P. et al. Climate–carbon cycle feedback analysis: results from the C4MIP model intercomparison. _J. Clim._ 19,
3337–3353 (2006). Article Google Scholar * Jones, B. & O’Neill, B. C. Spatially explicit global population scenarios consistent with the Shared Socioeconomic Pathways. _Environ. Res.
Lett._ 11, 084003 (2016). Article Google Scholar * Harris, I., Jones, P. D., Osborn, T. J. & Lister, D. H. Updated high-resolution grids of monthly climatic observations—the CRU TS3.10
dataset. _Int. J. Climatol._ 34, 623–642 (2014). Article Google Scholar * Osborn, T. J., Wallace, C. J., Lowe, J. A. & Bernie, D. Performance of pattern-scaled climate projections
under high-end warming. Part I: Surface air temperature over land. _J. Clim._ 31, 5667–5680 (2018). Article Google Scholar * Gosling, S. N. & Arnell, N. W. A global assessment of the
impact of climate change on water scarcity. _Clim. Change_ 134, 371–385 (2016). Article Google Scholar * Arnell, N. W. & Gosling, S. N. The impacts of climate change on river flood
risk at the global scale. _Clim. Change_ 134, 387–401 (2016). Article Google Scholar * Shukla, S. & Wood, A. W. Use of a standardized runoff index for characterizing hydrologic
drought. _Geophys. Res. Lett_. 35, L02405 (2008). * Vicente-Serrano, S. M., Beguería, S. & López-Moreno, J. I. A multiscalar drought index sensitive to global warming: the standardized
precipitation evapotranspiration index. _J. Clim._ 23, 1696–1718 (2010). Article Google Scholar * _NGFS Climate Scenarios for Central Banks and Supervisors_ (NGFS, 2021);
https://www.ngfs.net/sites/default/files/media/2021/08/27/ngfs_climate_scenarios_phase2_june2021.pdf * Vermeulen, R. et al. _An Energy Transition Risk Stress Test for the Financial System of
the Netherlands_ (De Nederlandsche Bank, 2018); https://www.dnb.nl/media/pdnpdalc/201810_nr-_7_-2018-_an_energy_transition_risk_stress_test_for_the_financial_system_of_the_netherlands.pdf *
Ho, E., Budescu, D. V., Bosetti, V., van Vuuren, D. P. & Keller, K. Not all carbon dioxide emission scenarios are equally likely: a subjective expert assessment. _Clim. Change_ 155,
545–561 (2019). Article CAS Google Scholar * _Global Update: Paris Agreement Turning Point_ (Climate Action Tracker, 2020);
https://climateactiontracker.org/publications/global-update-paris-agreement-turning-point/ Download references ACKNOWLEDGEMENTS The study was funded by ClimateWorks Foundation. A.C.K. and S.
Mittal acknowledge the H2020 European Commission Project ‘PARIS REINFORCE’ under grant agreement no. 820846. We would like to thank G. Ganguly for constructive comments on the scenario
design and draft manuscript. AUTHOR INFORMATION AUTHORS AND AFFILIATIONS * Grantham Institute - Climate Change and the Environment, Imperial College London, London, UK Ajay Gambhir, Shivika
Mittal, Alexandre C. Köberle & Joeri Rogelj * Center for Global Sustainability, University of Maryland, College Park, MD, USA Mel George & Haewon McJeon * Joint Global Change
Research Institute, Pacific Northwest National Laboratory, College Park, MD, USA Mel George & Haewon McJeon * Department of Meteorology, University of Reading, Reading, UK Nigel W.
Arnell * Met Office Hadley Centre, Exeter, UK Daniel Bernie & Jason Lowe * Faculty of Health Sciences, University of Bristol, Bristol, UK Daniel Bernie * Priestley International Centre
for Climate, University of Leeds, Leeds, UK Jason Lowe * International Institute for Applied Systems Analysis (IIASA), Laxenburg, Austria Joeri Rogelj * Centre for Environmental Policy,
Imperial College London, London, UK Joeri Rogelj * ClimateWorks Foundation, San Francisco, CA, USA Seth Monteith Authors * Ajay Gambhir View author publications You can also search for this
author inPubMed Google Scholar * Mel George View author publications You can also search for this author inPubMed Google Scholar * Haewon McJeon View author publications You can also search
for this author inPubMed Google Scholar * Nigel W. Arnell View author publications You can also search for this author inPubMed Google Scholar * Daniel Bernie View author publications You
can also search for this author inPubMed Google Scholar * Shivika Mittal View author publications You can also search for this author inPubMed Google Scholar * Alexandre C. Köberle View
author publications You can also search for this author inPubMed Google Scholar * Jason Lowe View author publications You can also search for this author inPubMed Google Scholar * Joeri
Rogelj View author publications You can also search for this author inPubMed Google Scholar * Seth Monteith View author publications You can also search for this author inPubMed Google
Scholar CONTRIBUTIONS A.G. and S. Monteith conceived the study. A.G., D.B., J.L., H.M., J.R., M.G., N.W.A. and S. Monteith designed the scenarios and modelling protocol. H.M. and M.G. ran
GCAM. D.B. ran MAGICC. N.W.A. ran the climate impact models. S. Mittal undertook all scenario data analysis and visualization. A.C.K. advised on financial risk analysis and literature. A.G.
wrote the manuscript, with input from all authors. CORRESPONDING AUTHOR Correspondence to Ajay Gambhir. ETHICS DECLARATIONS COMPETING INTERESTS The authors declare no competing interests.
ADDITIONAL INFORMATION PEER REVIEW INFORMATION _Nature Climate Change_ thanks Benjamin Leibowicz and the other, anonymous, reviewer(s) for their contribution to the peer review of this work.
PUBLISHER’S NOTE Springer Nature remains neutral with regard to jurisdictional claims in published maps and institutional affiliations. EXTENDED DATA EXTENDED DATA FIG. 1 MODEL SET-UP TO
PRODUCE PHYSICAL AND TRANSITION RISK-RELATED OUTPUT INDICATORS FOR EACH SCENARIO. The different scenarios are set up in the GCAM integrated assessment model, considering the specific GDP and
population growth characteristics of the scenarios, the temperature goals, the scenario variants in terms of policy action, and any technological and behavioural constraints or
availability. The GCAM model outputs a range of energy, agricultural and land system metrics which are used to specify the transition risk-related output indicators. The emissions (spanning
all GHGs, aerosols and other climate forcers) are fed into the probabilistic climate model MAGICC, whose range of temperature outputs are then fed into the suite of impacts models. These
produce measures of physical hazard which form the physical risk-related output metrics. EXTENDED DATA FIG. 2 PHYSICAL AND TRANSITION RISK METRICS FOR FIVE ADDITIONAL REGIONS. Each heat map
shows 7 physical hazard metrics on the left-hand panel and 7 transition risk metrics on the right-hand panel. The metrics are expressed as a ratio of each scenario’s value and the value for
the 2 C Central scenario. For the physical hazard metrics, this is the median ratio across the uncertainty range. Each transition risk metric is for the year 2030, whereas each physical risk
metric is for the year 2050. Circle size indicates 2100 median temperature increase on pre-industrial (1850–1900) levels in each temperature scenario. SSA = Sub-Saharan Africa. These
indicators reflect the key findings for the USA, EU + UK, India and China, in terms of (in general) the increasing severity of 2050 physical hazards for the higher long-term temperature
scenarios, contrasted with the lower transition risks for these scenarios. One notable exception is Japan, which, like the USA and EU + UK, has a relatively stringent NDC to 2030, with
commensurately higher transition risks in this period, compared to the GCAM-modelled cost-optimal pathways targeting 2–2.5oC warming by 2100. EXTENDED DATA FIG. 3 HIGH (A) AND MEDIAN (B)
PHYSICAL RISK METRICS FOR WORLD AND FOUR REGIONS. Each heat map shows 7 physical hazard metrics, with the right-hand side (B) showing the median ratio of hazard values for each scenario
compared to the 2 C Central scenario, and the left-hand side (A) showing the high (90th centile) ratio of each scenario compared to the 2 C Central scenario. Each physical risk metric is for
the year 2050. The relative physical hazard of the higher temperature scenarios is more severe compared to the 2 C Central scenarios when using the high (90th) centile values in the
distribution. This is shown by the deeper green and blue colours for each scenario and physical hazard metric in panel A), compared to its equivalent in panel B). SUPPLEMENTARY INFORMATION
SUPPLEMENTARY INFORMATION Supplementary Sections 1–4 containing Figs. 1, 2.1, 2.2, 3.1–3.25, 4.1–4.10 and Table 2.1. REPORTING SUMMARY RIGHTS AND PERMISSIONS Reprints and permissions ABOUT
THIS ARTICLE CITE THIS ARTICLE Gambhir, A., George, M., McJeon, H. _et al._ Near-term transition and longer-term physical climate risks of greenhouse gas emissions pathways. _Nat. Clim.
Chang._ 12, 88–96 (2022). https://doi.org/10.1038/s41558-021-01236-x Download citation * Received: 07 June 2021 * Accepted: 04 November 2021 * Published: 13 December 2021 * Issue Date:
January 2022 * DOI: https://doi.org/10.1038/s41558-021-01236-x SHARE THIS ARTICLE Anyone you share the following link with will be able to read this content: Get shareable link Sorry, a
shareable link is not currently available for this article. Copy to clipboard Provided by the Springer Nature SharedIt content-sharing initiative