Dopamine receptor D2 confers colonization resistance via microbial metabolites
- Select a language for the TTS:
- UK English Female
- UK English Male
- US English Female
- US English Male
- Australian Female
- Australian Male
- Language selected: (auto detect) - EN
Play all audios:

The gut microbiome has major roles in modulating host physiology. One such function is colonization resistance, or the ability of the microbial collective to protect the host against enteric
pathogens1,2,3, including enterohaemorrhagic Escherichia coli (EHEC) serotype O157:H7, an attaching and effacing (AE) food-borne pathogen that causes severe gastroenteritis, enterocolitis,
bloody diarrhea and acute renal failure4,5 (haemolytic uremic syndrome). Although gut microorganisms can provide colonization resistance by outcompeting some pathogens or modulating host
defence provided by the gut barrier and intestinal immune cells6,7, this phenomenon remains poorly understood. Here, we show that activation of the neurotransmitter receptor dopamine
receptor D2 (DRD2) in the intestinal epithelium by gut microbial metabolites produced upon dietary supplementation with the essential amino acid l-tryptophan protects the host against
Citrobacter rodentium, a mouse AE pathogen that is widely used as a model for EHEC infection8,9. We further find that DRD2 activation by these tryptophan-derived metabolites decreases
expression of a host actin regulatory protein involved in C. rodentium and EHEC attachment to the gut epithelium via formation of actin pedestals. Our results reveal a noncanonical
colonization resistance pathway against AE pathogens that features an unconventional role for DRD2 outside the nervous system in controlling actin cytoskeletal organization in the gut
epithelium. Our findings may inspire prophylactic and therapeutic approaches targeting DRD2 with dietary or pharmacological interventions to improve gut health and treat gastrointestinal
infections, which afflict millions globally.
Next-generation sequencing reads have been deposited at NCBI BioProject under accession number PRJNA1049399. Source data are provided with this paper.
R script for statistical analysis, box pots, and QIIME2 code are available at https://zenodo.org/records/10535214.
The authors thank the Arnold and Mabel Beckman Foundation (Beckman Young Investigator Award to P.V.C.) and a President’s Council for Cornell Women Affinito-Stewart Grant (P.V.C.) for
support. This work was supported in part by a grant from the National Institutes of Health (NIH R35GM133501). J.F. was supported by a Cornell Institute of Host-Microbe Interactions and
Disease (CIHMID) Postdoctoral Fellowship. Imaging data was acquired through the Cornell Institute of Biotechnology BRC Imaging Facility (RRID:SCR_021741), with NYSTEM (C029155) and NIH
(S10OD018516) funding for the shared Zeiss LSM 880 confocal/multiphoton microscope. We thank the Weill Institute for Cell and Molecular Biology for additional resources and reagents.
Department of Microbiology, Cornell University, Ithaca, NY, USA
Department of Microbiology and Immunology, Cornell University, Ithaca, NY, USA
Department of Chemistry and Chemical Biology, Cornell University, Ithaca, NY, USA
Cornell Center for Immunology, Cornell University, Ithaca, NY, USA
Cornell Institute of Host-Microbe Interactions and Disease, Cornell University, Ithaca, NY, USA
S.A.S. and P.V.C. conceptualized the study. S.A.S., J.F. and P.V.C. designed the experiments. J.F. performed the targeted metabolomic studies. S.A.S. carried out all other studies and
bioinformatic analyses. S.A.S., J.F. and P.V.C. wrote the manuscript.
Nature thanks Vanessa Sperandio and the other, anonymous, reviewer(s) for their contribution to the peer review of this work.
Publisher’s note Springer Nature remains neutral with regard to jurisdictional claims in published maps and institutional affiliations.
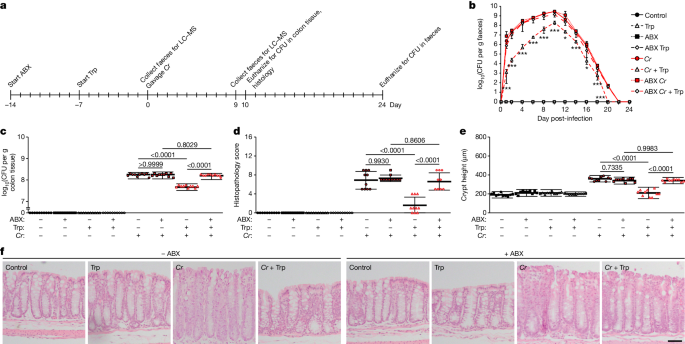
C57Bl/6 mice were pre-treated with antibiotics (ABX) for 7 d, followed by Trp metabolites, I3A (1000 mg/kg), IPyA (2900 mg/kg), or IEt (600 mg/kg) by oral gavage daily for 2 d. The mice were
then administered C. rodentium (CR, oral gavage, 108 CFU) with continued ABX (except neomycin) and metabolite treatment for 10 d. Colon sections were stained with H&E. Shown are
representative images. Scale bar: 50 μm. Data are representative of at least 3 independent experiments, n = 10 mice per group.
C. rodentium (CR) (a–e) and EHEC O157:H7 (f–k) were cultured in the presence of I3A, IPyA, or IEt (100 μM). a, f, Growth was monitored by measuring OD600 absorbance readings over 24 h. b, g,
Cultures were plated after 24 h, and CFUs were counted. (c–e, h–k) Bacteria were cultured in low glucose DMEM under anaerobic (ana), microaerophilic (micro), and aerobic (aero) conditions
to activate locus of enterocyte effacement-pathogenicity island expression with I3A, IPyA, or IEt (100 μM). RNA was isolated after cultures reached late-log phase (OD600 = 0.6–0.8), and cDNA
was synthesized and analyzed by qPCR for the indicated genes. Relative expression of mRNA transcripts was normalized to the RNA polymerase subunit alpha rpoA. Data are represented as the
fold induction over control samples, bars = mean, error bars = standard deviation. Statistical analysis was performed using a two-tailed Student’s t-test (a–b, f–g), or one-way ANOVA,
followed by post-hoc Tukey multiple comparison test (c–e, h–k), n = 3 biological replicates examined over 3 independent experiments.
a–b, Polarized Caco-2 monolayers were pre-treated with haloperidol (HAL, 10 μM) for 24 h, followed by metabolites (I3A, IPyA, or IEt, 100 μM) for 2 d, and then infection with EHEC O157:H7
for 16 h. b, Representative images of pedestals (denoted by arrows) from Caco-2 cells stained with DAPI and Alexa Fluor 647-phalloidin and imaged by confocal microscopy. Shown are maximum
intensity z-projections. Scale bar: 5 μm. c, Western blot analysis of Caco-2 monolayers to verify CRISPR/Cas9-mediated knockout (KO) of Drd2, Drd3, and Drd4. GAPDH is shown as a loading
control. d–f, Caco-2 monolayers (WT vs. KO) were pre-treated with metabolites (I3A, IPyA, or IEt, 100 μM) for 2 d and then infected with EHEC O157:H7 for 16 h. (a, d–f) Pedestal formation =
# of pedestals per Caco-2 cell (HAL: I3A, n = 955; IPyA, n = 970; IEt, n = 1024; Drd3 KO: I3A, n = 1089; IPyA, n = 1094; IEt, n = 1012; Drd4 KO: I3A, n = 1032; IPyA, n = 887; IEt, n = 1026;
Drd2 KO: I3A, n = 1032; IPyA, n = 1026; IEt, n = 1073 cells examined over 3 independent experiments). For box plots, interquartile ranges (IQRs, boxes), median values (line within box),
whiskers (lowest and highest values within 1.5 times IQR from the first and third quartiles), and outliers beyond whiskers (dots), are shown. g-m, Caco-2 cells (WT vs KO) were pre-treated
with metabolites (I3A, IPyA, or IEt, 100 μM) for 24 h and then infected with EHEC O157:H7 for 12 h. Cell lysates were analyzed by Western blotting with the indicated antibodies. Source data
are provided in Supplementary Fig. 9. (h, j, l, m) Densitometry was performed using FIJI, bars = mean, error bars = standard deviation. Data are representative of at least 3 independent
experiments, n = 3 biological replicates. Statistical analysis was performed using one-way ANOVA, followed by post-hoc Tukey multiple comparison test.
a, c–f, HEK 293 T cells overexpressing either DRD2 and a split luciferase-based cAMP sensor (GloSensor) or b, DRD2-Tango and a β-arrestin-TEV fusion were incubated with dopamine (DA), I3A,
IPyA, or IEt (1 mM each in a–b; concentrations indicated in c–f) for 15 min (a, c–f) or 24 h (b), after which luminescence was measured to quantify ligand-induced (a) decrease in cAMP or (b)
increase in β-arrestin recruitment. RLU = relative luminescence units. EC50 and Kd values were calculated using GraphPad Prism. (g–h) Drd2fl/fl x Villin (Vil)-Cre or Drd2fl/fl mice were fed
a conventional (2 g Trp/kg diet, ad libitum) or Trp (42 g Trp/kg diet, ad libitum) diet for 7 d and then infected with C. rodentium (CR, oral gavage, 108 CFU) with continued Trp feeding.
Ten days post-infection, intestinal cryosections were stained with DAPI and an anti-DRD2 antibody, followed by an anti-mouse Alexa Fluor 594 antibody. (g) Shown are representative z-slices.
Scale bar: 20 μm. (h) Image brightness was quantified using FIJI. Statistical analysis was performed using one-way ANOVA, followed by post-hoc Tukey multiple comparison test; bars = mean,
error bars = standard deviation, (a–f) n = 3 biological replicates and (g–h) n = 10 mice per group examined over 3 independent experiments.
Drd2fl/fl x Villin (Vil)-Cre or Drd2fl/fl mice were treated with Trp metabolites, I3A (1000 mg/kg), IPyA (2900 mg/kg), or IEt (600 mg/kg), by oral gavage daily for 2 d, and then infected
with C. rodentium (CR, oral gavage, 108 CFU) with continued metabolite treatment. Ten days post-infection, intestinal cryosections were stained with DAPI and an anti-DRD2 antibody, followed
by an anti-mouse Alexa Fluor 594 antibody. (a) Shown are representative z-slices. Scale bar: 20 μm. (b–d) Image brightness was quantified using FIJI. Data are representative of at least 3
independent experiments, n = 10 mice per group, bars = mean, error bars = standard deviation. Statistical analysis was performed using one-way ANOVA, followed by post-hoc Tukey multiple
comparison test.
Drd2fl/fl x Villin (Vil)-Cre or Drd2fl/fl mice were fed a conventional (2 g Trp/kg diet, ad libitum) or Trp (42 g Trp/kg diet, ad libitum) diet for 7 d or Trp metabolites, I3A (1000 mg/kg),
IPyA (2900 mg/kg), or IEt (600 mg/kg), by oral gavage daily for 2 d, and then infected with C. rodentium (CR, oral gavage, 108 CFU) with continued Trp feeding or metabolite treatment. a–b,
Bacterial load in (a) feces and (b) colon tissue was measured (a) every 1–2 d for 24 d post-infection and (b) at the peak of infection, 10 d post-infection. c–e, Colon sections were stained
with H&E and (c) blindly scored for submucosal edema (0-3), goblet cell depletion (0-3), epithelial hyperplasia (0-3), epithelial integrity (0-4), and neutrophil and mononuclear cell
infiltration (0-3). Data are expressed as the sum of these individual scores (0-16). See Methods for full description of scoring rubric. (d) Crypt heights were measured. (e) Representative
images. Scale bar: 50 μm. (f) Representative images of pedestals from Fig. 4a (denoted by arrows) stained with DAPI and Alexa Fluor 647-phalloidin and imaged by confocal microscopy. Shown
are maximum intensity z-projections. Scale bar: 5 μm. (g) Pedestal formation = # of pedestals per host cell (I3A, n = 1079; IPyA, n = 1027 cells examined over 3 independent experiments). For
box plots, interquartile ranges (IQRs, boxes), median values (line within box), whiskers (lowest and highest values within 1.5 times IQR from the first and third quartiles), and outliers
beyond whiskers (dots), are shown. h, i, Intestinal epithelial cells were isolated, and cell lysates were analyzed by Western blotting with the indicated antibodies. Source data are provided
in Supplementary Fig. 9. (i) Densitometry was performed using FIJI, n = 3 biological replicates. Data are representative of at least 3 independent experiments, n = 10 mice per group, bars =
mean, error bars = standard deviation. Statistical analysis was performed using the two-tailed Student’s t-test (a) or one-way ANOVA, followed by post-hoc Tukey multiple comparison test: *p