In vivo manipulation of human gut bacteroides fitness by abiotic oligosaccharides
- Select a language for the TTS:
- UK English Female
- UK English Male
- US English Female
- US English Male
- Australian Female
- Australian Male
- Language selected: (auto detect) - EN
Play all audios:

ABSTRACT Synthetic glycans (SGs) containing glycosidic linkages and structures not identified in nature offer a means for deliberately altering microbial community properties. Here pools of
SG oligosaccharides were generated via polymerization of monosaccharides and screened for their ability to increase saccharolytic _Bacteroides_ in ex vivo cultures of human fecal samples. A
lead SG preparation was orally administered to gnotobiotic mice harboring a consortium of 56 cultured, phylogenetically diverse human gut bacteria and fed a Western diet. The abundances of 3
of 15 _Bacteroides_ strains increased, most prominently _B. intestinalis_. Underlying mechanisms were characterized by analyzing in vivo expression of the carbohydrate utilization
machinery, using retrievable microscopic paramagnetic particles with bound SG oligosaccharides and assaying SG degradation by individual purified _B. intestinalis_ glycoside hydrolases. The
results reveal that SGs can selectively co-opt carbohydrate utilization machinery in different human gut _Bacteroides_ and demonstrate a means for identifying artificial carbohydrate
structures for targeted bacterial manipulation. SIMILAR CONTENT BEING VIEWED BY OTHERS HUMAN GUT MICROBES EXPRESS FUNCTIONALLY DISTINCT ENDOGLYCOSIDASES TO METABOLIZE THE SAME _N_-GLYCAN
SUBSTRATE Article Open access 15 June 2024 HIERARCHICAL GLYCOLYTIC PATHWAYS CONTROL THE CARBOHYDRATE UTILIZATION REGULATOR IN HUMAN GUT _BACTEROIDES_ Article Open access 14 May 2025
SYNTHETIC GLYCANS CONTROL GUT MICROBIOME STRUCTURE AND MITIGATE COLITIS IN MICE Article Open access 10 March 2022 MAIN In nature, glycans are synthesized in a template-independent process
that employs specific glycosyltransferases and activated monosaccharide donor sugars as substrates1,2. The structural diversity of naturally occurring glycans is limited by several
mechanisms, including the pattern of expression of genes encoding glycosyltransferases, the linkage specificities of these enzymes, and the generation and availability of activated
monosaccharide donors and suitable acceptors. Members of the phylum Bacteroidota are adept at metabolizing polysaccharides and have, through lateral gene transfer and/or genetic
recombination, functionally diversified their genomes for utilization of various natural polysaccharides3. While estimates of natural glycan structural diversity are difficult to derive,
estimates based on the number and diversity of degradative carbohydrate-active enzyme (CAZyme) gene clusters encoded in Bacteroidota genomes suggest that there are several thousand unique,
naturally occurring structures4. This value is multiple orders of magnitude less than what is theoretically possible5, emphasizing the constraints on biosynthetic processes that operate in
and on living systems. Glycans that are generated synthetically can contain structures and linkage combinations not previously identified in nature. A recently developed and generalizable
approach for generating synthetic glycans (SGs) involves monosaccharide building blocks and a zwitterionic resin that catalyzes glycosidic bond formation between the reducing end of a
monosaccharide and an acceptor hydroxyl on the growing SG6,7. By changing the monosaccharide starting material and reaction conditions, a pool of nonidentical, nonrepetitive oligosaccharides
can be obtained in a fashion agnostic to biocatalysis or biocompatibility, but instead driven by principles of thermodynamics (monosaccharide ring conformation and anomer) and kinetics
(formation of a given glycosidic bond)7,8. This synthetic approach can capture immense chemical diversity where a given monosaccharide is (1) represented in distinct ring confirmations (for
example, pyranose versus furanose), (2) linked via an α- or β-anomeric bond and (3) covalently bound to any hydroxyl on a growing oligosaccharide. Furthermore, the approach can be used to
optimize the types of structures produced and yield the kilogram quantities needed to support translation of results obtained from preclinical models to proof-of-concept human studies.
Dietary carbohydrates and glycoconjugates associated with the intestinal mucosa are consumed by members of the gut microbiota; the products of their degradation/metabolism have wide-ranging
effects, both direct and indirect, on host physiology9,10,11. One potential application of SGs is as therapeutic agents for selectively altering the composition and expressed functions of
the human gut microbiota12,13. In previous studies, SGs were added to ex vivo cultures of human fecal communities or administered to conventionally raised mice and their effects on the
relative abundances of bacterial taxa characterized by culture-independent methods7,14. In the present study, we examine the mechanisms by which certain human gut _Bacteroides_ respond to a
SG preparation in vitro and in gnotobiotic mice. Our results not only demonstrate that SGs can alter gut microbiota composition and function through their utilization as a carbon source, but
also suggest a roadmap for optimizing their selective biological effects. RESULTS SGS AFFECT HUMAN GUT BACTERIAL GROWTH IN VITRO We selected eight SG pools from a collection of several
hundred previously reported pools; selection was based on their occupancy within distinct chemical space as defined by unsupervised clustering of glycosyl linkage data collected from the SGs
and natural glycans7. The eight SG pools were each generated from one to three monosaccharide building blocks, contained <3% of their monosaccharide starting material and had a median
average degree of polymerization (DP) of 12.45 (range 8.09–15.03). Each of the eight pools contained oligosaccharides of varying length and structural composition as indicated by their
polydispersity index (PDI; range 1.29–2.10) (Supplementary Table 1). An ex vivo fermentation experiment with intact human fecal samples obtained from five healthy donors was used to
initially characterize the effects of each of the eight SG pools on bacterial growth (defined by changes in optical density at 600 nm (OD600) measurements or changes in the pH of the
cultures). Arabinan isolated from sugar beet (SBABN) was used as a reference control. Based on the minimum pH documented (a biomarker of fermentation), we concluded that all of the SG pools
were fermented to a lesser extent than SBABN (Supplementary Tables 2 and 3). After 45 h of incubation, the stationary phase was achieved, and polymerase chain reaction (PCR) was used to
amplify variable region 4 (V4) of bacterial 16S ribosomal RNA (rRNA) genes present in the community. Compared with unsupplemented controls, only SG pool 10 (SG10) produced an increase in the
fractional representation of the genus _Bacteroides_ (four of the five fecal communities; median _Bacteroides_ log2 fold change in these communities = 0.13 ± 0.15 (mean ± standard deviation
(s.d.)); _n_ = 3 replicates per community) (Fig. 1a). SBABN increased the fractional abundance of _Bacteroides_ in all five communities (median log2 fold change; 0.57 ± 0.02 (mean ± s.d.);
_n_ = 3 replicates per community) (see Extended Data Fig. 1a and Source data Fig. 1 for data concerning increases and decreases in the representation of additional taxa documented when
comparing individual fecal community–SG pool pairs; for example, the other SGs increased the fractional abundance of the genus _Parabacteroides_ as has been observed previously7). SG10 is a
structurally complex pool of nonidentical oligosaccharides derived exclusively from l-arabinose (Supplementary Table 1). Each of the 11 possible glycosyl linkages (including ring
conformation, excluding anomer) are present, and pyranosides are more abundant than the furanose ring form (for example, compare the fractional abundance of t-Ara_p_ versus t-Ara_f_ in
Extended Data Fig. 1b). The preference for the pyranose ring structure agrees with equilibrium l-arabinose monosaccharide mutarotation data8. Furthermore, two-dimensional nuclear magnetic
resonance spectroscopy supports the diverse chemical composition of SG10 with multiple peaks populating the anomeric region of a (1H,13C)-heteronuclear single quantum coherence (HSQC)
spectra consistent with α- or β-glycosidic bonds15,16,17 (Extended Data Fig. 1c). SG10 SUPPLEMENTATION AFFECTS _BACTEROIDES_ FITNESS IN VIVO Based on the results from our ex vivo
fermentation experiment, we selected SG10 for a secondary screen to examine the specificity of its effects on _Bacteroides_ in vivo. To do so, we introduced a 92-member consortium of human
gut-derived bacterial isolates that possessed diverse taxonomic features and contained a total of 326,186 known or predicted protein-coding genes18 (Supplementary Table 4) into adult
germ-free mice. Two days after gavage of the consortium, animals were divided into two groups. Both groups were monotonously fed a diet that represented the upper tertile of saturated fat
consumption and lower tertile of fruits and vegetables consumption (HiSF-LoFV) in the United States19. One group of mice received drinking water supplemented with a preparation of SG10 that
had been purified by ethanol precipitation (5% wt:wt; equivalent to approximately 250 mg of SG10 per day per mouse); this preparation, which contained trace l-arabinose starting material
(1.7% wt:wt; Supplementary Table 1), was administered for 7 days. A second group received unsupplemented water. A third group of mice was maintained in a germ-free state throughout the
duration of the experiment while consuming this diet plus SG10-supplemented water (_n_ = 8 mice per treatment arm; Fig. 1b). The absolute abundances of bacterial taxa were determined by
shotgun sequencing of microbial community DNA isolated from fecal samples serially collected at 2, 6 and 8 days post-gavage (dpg) and from cecal contents obtained at the time of euthanasia
(dpg 9)20,21,22. Of the 92 strains introduced to mice, 56 satisfied our criteria for colonization (mean percent relative abundance >0.05% at any one time point in members of the two
treatment groups). The absolute abundances of 30 bacteria were significantly different in the cecal contents of SG10-treated compared with untreated mice (false discovery rate
(FDR)-corrected _P_ value <0.01, one-way analysis of variance (ANOVA)) (Fig. 1c and Extended Data Fig. 2a). Of these 30 strains, 8 increased their absolute abundance ≥1.5-fold with SG10
supplementation, while 20 strains decreased ≥1.5-fold. The responses in the cecal community were similar to the fecal community (29 taxa with significant differences in abundances; linear
mixed-effects model (Gaussian), FDR-corrected _P_ value <0.01; Extended Data Fig. 2b). The absolute biomass of the community did not differ between the two colonized groups of mice in
either the cecum (FDR-corrected _P_ value 0.32, one-way ANOVA) or feces (FDR-corrected _P_ value 0.026, linear mixed-effects model (Gaussian)). Previous studies had found propionate to be
the most responsive short-chain fatty acid (SCFA) when different SG preparations were added to ex vivo cultures of human fecal samples or administered to conventionally raised mice7,14.
Consistent with these reports, gas chromatography–mass spectrometry (GC–MS) of cecal contents revealed that the fractional representation of propionate among total SCFAs increased in
SG10-supplemented mice, while the representation of other SCFAs decreased (most prominently, acetate). These alterations in the relative proportions of SCFAs, which occurred without a change
in the total cecal community biomass, did not result from a net change in the absolute levels of propionate (_P_ = 0.45, one-way ANOVA with Tukey’s honestly significant difference (HSD);
Extended Data Fig. 3). Of the 17 members of _Bacteroides_ represented in the 92-member gavage mixture, 15 were colonizers and 9 exhibited statistically significant differences in their
absolute abundances in the cecum with SG10 treatment. Three of the nine _Bacteroides_ had significant increases in their abundance: _B. intestinalis_ DSM 17393 (10.1-fold), _B. ovatus_
American Type Culture Collection (ATCC) 8483 (7.1-fold) and _B. caccae_ ATCC 43185 (1.5-fold) (FDR-corrected _P_ value <0.01, one-way ANOVA; Extended Data Fig. 2a). _B. intestinalis_ was
the predominant member of the cecal microbiota of SG10-treated mice (14.6 ± 4.8 × 10⁹ (mean ± s.d.) genome equivalents per gram of cecal contents; 23.6 ± 5.8 (mean ± s.d.) percent relative
abundance). Other _Bacteroides_ in the community underwent substantial and rapid decreases in their absolute abundances, including _B. xylanisolvens_ XB1A, _B. eggerthii_ DSM 20697 and _B.
thetaiotaomicron_ VPI-5482 (Extended Data Fig. 2b). SG10 ALTERS EXPRESSION OF POLYSACCHARIDE UTILIZATION LOCI An open question before this study was whether abiotic glycans could induce the
expression of polysaccharide utilization loci (PULs) that members of Bacteroidota use for sensing, acquiring and metabolizing naturally occurring glycans. PULs are defined as having at least
one adjacent pair of _susC_/_susD_-like genes that encode proteins that bind extracellular glycans and import them into the periplasm. PULs also encode various CAZymes responsible for
glycan depolymerization (glycoside hydrolases (GHs), polysaccharide lyases and carbohydrate esterases) as well as transcriptional regulators23,24. As such, patterns of PUL gene expression,
and the known or predicted functions of their encoded CAZymes, can be used to infer structure/activity relationships in glycans being utilized by _Bacteroides_25,26,27,28. Therefore, we
began our mechanistic analysis by comparing the results of microbial RNA sequencing (RNA-seq) of cecal contents collected from colonized mice belonging to the two treatment groups. Of the 56
colonizing bacterial strains, 33 met our criteria for sequencing depth and coverage and were analyzed for differential gene expression (Methods and Supplementary Table 4). Each of these
community member’s genomes was initially annotated with rapid annotation using subsytems technology (RAST)29,30 with additional annotation focused on carbohydrate-active enzymes (CAZymes,
Carbohydrate-Active EnZYmes Database (CAZy)31), polysaccharide-utilization loci (PULs, Polysaccharide-Utilization Loci DataBase (PULDB)24) and metabolic pathways that we reconstructed in
silico using a comparative genomics approach implemented in the Sequence Annotation and Exploration Database (SEED) platform (microbial community SEED (mcSEED)32). Of the 82,708 annotated
genes in the 33 organisms, 15,421 (18.6%) exhibited statistically significant differences in their expression with SG10 treatment (DESeq2 (ref. 33) FDR-corrected _P_ value <0.01; Source
Data Fig. 2). The 33 community members’ genomes encode 571 predicted PULs. Gene set enrichment analysis (GSEA) disclosed that, among PULs that contain at least five open reading frames (_n_
= 316), 63 were significantly enriched in genes upregulated during SG10-treatment while 59 were significantly enriched in genes that were downregulated (FDR-corrected _P_ value <0.05;
fgsea34). _B. intestinalis_ encodes a large number of predicted CAZymes belonging to diverse CAZyme families, albeit less than in the glycobiomes of either of the SG10 nonresponsive _B.
cellulosilyticus_ strains (Extended Data Fig. 4a). Of the 1,281 genes exhibiting statistically significant differential expression in _B. intestinalis_, 284 specified predicted CAZymes or
were located within PULs (DESeq2 FDR-corrected _P_ value <0.01). GSEA revealed five _B. intestinalis_ PULs (out of the 53 PULs composed of at least 5 genes) that were significantly
enriched in genes with increased expression during SG10 supplementation (Fig. 2a; FDR-adjusted _P_ value <0.05; fgsea34). PUL8 (Fig. 2b) exhibited the greatest upregulation among all _B.
intestinalis_ PULs (normalized enrichment score (NES) 2.43; FDR-corrected _P_ value 2.41 × 10⁻¹²). Moreover, this PUL had the highest NES among all 63 upregulated PULs in the community with
an average 4.2 ± 0.92 log2 fold change (mean ± s.d.) for its 13 upregulated genes (DESeq2 FDR-corrected _P_ value <0.01) (Extended Data Fig. 4b,c). The natural substrate(s) for _B.
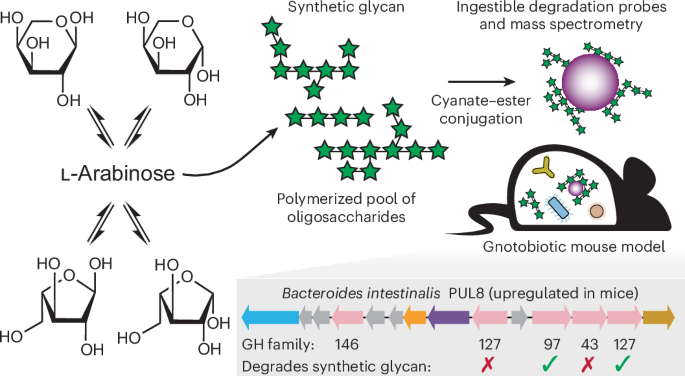
intestinalis_ PUL8, or PULs in other _Bacteroides_ with syntenic orthologs to PUL8, is currently unknown. _B. intestinalis_ PUL8 encodes five enzymes from four CAZy GH families; four of
these five enzymes belong to CAZyme families with experimentally characterized β-l-arabinose targeting activity (GH127, GH146 and GH97). β-l-Arabinose is a low-abundance structure in plant
glycans; it is present as a sparse terminal epitope of some arabinans or arabinogalactans and is found in hydroxyproline-rich glycoproteins35,36. GH127 and GH146 family enzymes have
characterized β-l-arabinofuranosidase activity36,37,38, while GH97 enzymes have been reported to cleave terminal β-l-arabinopyranosides39. Among these four CAZymes in PUL8, all but the GH146
encoded by _BACINT_00515_ (predicted β-l-arabinofuranosidase activity) have signal peptides that would enable their secretion either into the periplasmic space or extracellularly40. PUL43
is another SG10-induced _B. intestinalis_ PUL that is highly expressed with SG10 treatment (Fig. 2a). It contains multiple enzymes from GH families with predicted α- or β-l-arabinosidase or
arabinanase activity, plus an l-arabinose utilization operon specifying mutarotase, permease, isomerase, kinase and epimerase activities critical for shunting liberated arabinose into
central carbon metabolism41 (Fig. 2b). PUL43’s annotated gene content and its similarity to _B. thetaiotaomicron_ VPI-5482 PUL7 suggest that it is employed to degrade plant arabinans25,26.
Additional evidence for the contribution of SG10-derived arabinose to community responses comes from the finding that mcSEED metabolic pathways involved in the utilization of arabinose or
arabino-oligosaccharides were enriched among the SG10-induced genes in _B. intestinalis_, other _Bacteroides_ (_B. cellulosilyticus_ WH2 and _B. uniformis_ ATCC 8492) and other community
members (Supplementary Tables 5 and 6). The latter include _Enterocloster_ (formerly _Clostridium_) _bolteae_ ATCC BAA-613, a prominent community member whose absolute abundance increases
significantly with SG10 treatment (Fig. 1c and Extended Data Fig. 2); it upregulates multiple metabolic pathways involved in utilizing monosaccharides or carbon sources produced by other
community members following carbohydrate catabolism, including arabinose, hexuronates, rhamnose, xylose and propanediol42 (Supplementary Tables 5 and 6). The response of _B. intestinalis_
can be further contextualized by considering that syntenic orthologs of _B. intestinalis_ PUL8 genes are found in only two other PULs represented in the genomes of the _Bacteroides_ that
colonized mice: PUL26 in _B. cellulosilyticus_ WH2 and PUL42 in _B. cellulosyliticus_ DSM14838 (Supplementary Fig. 1). Of these two PULs, only _B. cellulosilyticus_ WH2 PUL26 is upregulated
during SG10 supplementation (it has the fifth highest NES among all 63 upregulated PULs in the entire community; Extended Data Fig. 4b). Despite the SG10-associated increase in expression of
its PUL26, _B. cellulosilyticus_ WH2 did not demonstrate a statistically significant increase in its absolute abundance in this cecal community, diet and SG context (FDR-corrected _P_ value
0.8, one-way ANOVA) (Extended Data Fig. 2a). Together these findings prompted additional mechanistic studies that focused on developing and applying analytic methods that would provide
details of how oligosaccharide components of SG10 were processed by _B. intestinalis_. BEAD-BASED ASSAYS OF OLIGOSACCHARIDE DEGRADATION In a previous study, we have monitored polysaccharide
degradation in vivo by oral gavage of defined mixtures of microbiota function activity biosensors (MFABs) into gnotobiotic mice43. MFABs are microscopic (10 μm diameter) paramagnetic silica
beads whose surfaces contain covalently bound carbohydrates of interest plus a bound fluorogenic marker to facilitate their isolation from complex mixtures (Fig. 3a). Beads were recovered
from intestinal contents on the basis of their magnetic properties and fluorescence, and the amount of carbohydrate remaining on their surfaces quantified (relative to the amount on beads
before their gavage)26,43. For the current study, we describe additional MFAB analyses for quantifying individual glycosyl linkages represented in, and the length distribution of, retained
MFAB-bound oligosaccharides. We first performed neutral monosaccharide composition analysis to establish the dependence on 1-cyano-4-dimethylaminopyridinium (CDAP) activation of
oligosaccharides44 for immobilization of SG10 glycans to surface amines present on MFABs (Fig. 3b). We then developed a protocol for glycosyl linkage analysis of oligosaccharides bound to
these beads. The results indicated that the structures attached to the bead are representative of structures contained in free SG10; one notable difference was the increased proportional
abundance of 2,3,4-branched arabinopyranose (Ara_p_)/2,3,5-branched arabinofuranose (Ara_f_) in bead-immobilized SG10 (Fig. 3c). We speculate that the increase in this fully branched
monosaccharide is the result of incomplete permethylation at the interface between SG10 and the bead. We subsequently developed methods for releasing bound SG10 oligosaccharides in an intact
form to determine the length distribution of the immobilized structures. To do so, we targeted the isourea-like bond or the carbamyl bond formed between the activated carbohydrate cyanate
ester and primary amines on the MFAB surface (Fig. 3d). Treatment with 1 M NH4OH at 70 °C for 3.5 h released 93.4 ± 0.7% (mean ± s.d.; _n_ = 5 independent sample preparations) of the
immobilized SG10 arabinose (Extended Data Fig. 5a). Following release and a cation-exchange cleanup step, SG10 was readily ionized by matrix-assisted laser desorption/ionization
time-of-flight mass spectrometry (MALDI-TOF MS), producing a characteristic +132.04 Da ladder, with the ladder representing each additional arabinose monomer (Extended Data Fig. 5b). We
found that the released SG10 oligosaccharides were free of any linker (Fig. 3e), which supports our proposed mechanism of release described in Fig. 3d. The DP of released SG10
oligosaccharides was similar to what was found in the starting soluble SG10 preparation, with DP6 being the predominant oligomer (Extended Data Fig. 5c). Based on these findings, we
concluded that the release conditions do not result in destruction of immobilized glycan and that the cyanate-ester immobilization used in synthesizing MFAB-SG10 beads does not bias the
composition or length distribution of SG10 oligosaccharides immobilized on the bead surface. MFAB QUANTIFICATION OF SG10 DEGRADATION IN VIVO In a series of control experiments, MFAB-bound
SG10 or free SG10 was incubated with excess amounts of single purified GHs in vitro. An α-arabinanase removed 26.8 ± 10.2% of MFAB-bound arabinose (mean ± s.d.; _n_ = 6 independent sample
preparations; Fig. 4a). However, an α-L-arabinofuranosidase and a β-xylanase failed to significantly degrade SG10 from the particle surface (_P_ = 0.18 and 0.7, respectively, two-sided
Mann–Whitney _U_ test) (Fig. 4a). Biochemical analysis demonstrated the ability of the α-arabinanase and the α-l-arabinofuranosidase to degrade SG10 (Extended Data Fig. 6a,b, FDR-corrected
_P_ value <0.01, one-sided Mann–Whitney _U_ test). MALDI-TOF MS of the DP profiles of oligosaccharides released from SG10-MFABs following enzyme treatment revealed a modest shift toward
shorter oligomers (Fig. 4b). We performed glycosyl linkage analysis comparing free SG10 with SG10-MFABs after treatment with each of these purified enzymes. The coefficient of variation was
improved when analyzing MFAB-bound SG10 compared with free SG10 (three-way ANOVA; FDR-corrected _P_ value 0.0005 for the SG10 source (free versus MFAB-bound) component; _n_ = 3 independent
sample preparations; Supplementary Table 7). We attribute this analytical precision benefit of MFABs to wash steps that are applied before sample derivatization and subsequent linkage
analysis by GC–MS. These washes remove (1) liberated enzymatic products and (2) salt ions that contribute to inconsistent sample derivatization and volatilization. We compared these SG10
results with those obtained with MFABs containing similar amounts of bound maltodextrin. The preparation of maltodextrin had a length distribution similar to SG10 (13–17 dextrose
equivalents; estimated molecular number ~1,300 Da). Maltodextrin-MFABs were incubated with excess amounts of enzymes with known specificity for the α(1,4) and α(1,6) linkages in this
oligosaccharide. Monosaccharide composition analysis revealed that, after digestion with α-amylase plus amyloglucosidase, 66.5 ± 11.8% of immobilized maltodextrin could be removed (mean ±
s.d.; _n_ = 6 independent sample preparations) (Fig. 4c). MALDI–MS of released maltodextrin demonstrated that the predominant oligomer was reduced from DP5 to DP3 after digestion (Fig. 4d).
Having established the accessibility of MFAB immobilized oligosaccharides to soluble degradative enzymes in vitro, we subsequently gavaged each mouse in each of the three treatment arms with
25 × 106 SG10-MFABs. Four hours after gavage, the majority of MFABs reside within the cecum. At this time point, the mice were euthanized and MFABs were collected from their cecal contents
by magnetism and purified (Methods). Monosaccharide composition analysis by GC–MS revealed there were no statistically significant differences in the absolute mass of arabinose remaining on
the MFAB surface between any of three groups of mice compared with input beads (_P_ value >0.5; two-sided Mann–Whitney _U_ test) (Fig. 4e). However, glycosyl linkage analysis of recovered
MFABs revealed statistically significant preferential removal of t-Ara_p_, 3-Ara_f_, 4-Ara_p_/5-Ara_f_, 3-Ara_p_ and 2-Ara_p_ in colonized animals (_P_ value <0.05; one-way ANOVA with
Tukey’s HSD) (Fig. 4f). We did not expect the entirety of any given linkage represented in SG10 oligosaccharides to be degraded given that (1) both anomers (α- or β-) are probably present,
(2) SGs are not constrained by enzymatic catalysis so the structure adjacent to a given linkage can vary and (3) there are not repetitive structures. Thus, our ability to precisely quantify
glycosyl linkages remaining bound to MFABs (see above) proved to be critical for identifying what we had postulated would be subtle differences in proportional abundances of the remaining
bound linkages. INDUCED _B. INTESTINALIS_ GHS DEGRADE SG10 The induction of genes encoded by _B. intestinalis_ PUL8 and PUL43 and the modest changes in MFAB-bound SG10 recovered from the
cecums of mice prompted us to quantify the enzymatic activities of the induced GHs using SG10 or SBABN as a substrate. Four GHs (of five total) from PUL8 and all seven from PUL43 were
expressed in _Escherichia coli_ and purified in sufficient quantities for biochemical analysis. Glycan degradation was characterized by quantifying reaction product reducing ends45 and
released l-arabinose. Together, these two assays can quantify and differentiate endo- from exo-hydrolysis activity. Commercially available enzymes with known activities were used as
controls. As expected, an α-arabinanase and two α-l-arabinofuranosidases degraded SBABN. Each of these enzymes was also able to degrade SG10, albeit to a lesser extent (Extended Data Fig.
6a,b, FDR-corrected _P_ value <0.01, one-sided Mann–Whitney _U_ test). When incubated with α-amylase or β-xylanase, no significant degradation of SBABN or SG10 was observed (FDR-corrected
_P_ value >0.01, one-sided Mann–Whitney _U_ test). We identified multiple GHs encoded by PUL8 and PUL43 that can degrade SG10 (Fig. 5). Within PUL8, BACINT_00526 (GH127) and BACINT_00520
(GH97) degraded SG10 with a significantly higher amount of l-arabinose detected in the reaction products compared with control incubations where no enzyme was added (Fig. 5a and Extended
Data Fig. 6c; FDR-corrected _P_ value <0.01, one-sided Mann–Whitney _U_ test). Of the seven GHs encoded by PUL43, degradation of SG10 was catalyzed by five enzymes with diverse CAZy
family annotations and predicted activities (Fig. 5b and Extended Data Fig. 6d; FDR-corrected _P_ value <0.01, one-sided Mann–Whitney _U_ test). Enzymes predicted to target β-l-arabinose
linkages (GH127, GH146 and select GH97 enzymes) generated more l-arabinose reaction product during incubation with SG10 compared with SBABN (BACINT_00526 and BACINT_002784). Individual
α-l-arabinofuranosidases either preferred SBABN as a substrate (BACINT_02766 and BACINT_02786) or degraded both arabinan and SG10 (BACINT_02767) to a similar extent. None of the predicted
α-l-arabinofuranosidases preferred SG10. While both endo-l-arabinanases in PUL43 degraded arabinan, neither showed appreciable enzymatic activity with SG10 as the substrate (Fig. 5b and
Extended Data Fig. 6d). Together, these results establish the susceptibility of SG10 to degradation by single GHs whose genes are expressed in vivo by _B. intestinalis_ and demonstrate that
most SG10 hydrolysis results from exo-activity and the release of l-arabinose (compare bar height of detected l-arabinose versus reducing ends in Fig. 5). The latter point is important as
the arabinose utilization loci encoded in PUL43 can facilitate its use as a carbon source (Fig. 2)41. SG10 DEGRADATION BY _B. INTESTINALIS_ IN MONOCULTURE The significant increase in _B.
intestinalis_ abundance within the defined community during SG10 supplementation, together with the ability of genes in its PUL8 or PUL43 encoding GHs that degrade SG10, prompted us to
further investigate SG10 utilization in vitro. To do so, we monitored the growth of monocultures of _Bacteroides_ strains in a defined _Bacteroides_ culture medium46 supplemented with either
glucose, SBABN or one of two SG10 preparations. Preparation 1 was purified by column chromatography to remove low-molecular-weight oligomers and monosaccharide starting material and was
used for all in vitro experiments and for the SG10-MFABs tested in vivo. Preparation 2 was not column purified and had only been used to supplement the drinking water in the mouse
experiments (Methods and Supplementary Table 1). SBABN was selected as a reference control plant polysaccharide given the arabinan mimetic-like properties of SG10 disclosed by in vivo
expression of _B. intestinalis_ PUL43 and in vitro degradation of SG10 by purified GHs. _B. intestinalis_ was able to grow in medium containing either of the two SG10 preparations, although
in both cases it achieved a lower maximum OD600 compared with growth on glucose or SBABN (_n_ = 3 technical replicates/condition; 2 independent experiments) (Fig. 6a). We tested five other
_Bacteroides_ species present in the colonized mice (_B. cellulosyliticus_ WH2, _B. xylanisolvens_ XB1A, _B. thetaiotaomicron_ VPI-5482, _B. ovatus_ ATCC 8483 and _B. caccae_ ATCC 43185) as
well as the noncolonizing _Phocaeicola vulgatus_ ATCC 8482 strain for their ability to grow on SG10. Only the two strains that possess a PUL with genes orthologous to genes encoding
β-l-arabinose targeting enzymes in _B. intestinalis_ PUL8 grew on SG10 (see _B. cellulosilyticus_ WH2, and _P. vulgatus_ in Fig. 6b and Supplementary Fig. 1). Surprisingly, PUL8 expression
was not induced in _B. intestinalis_ during in vitro growth on SG10 (Extended Data Fig. 7). Instead, we found that SG10 or SBABN as a sole carbon source induce similar levels of PUL43
expression. Thus, the contribution of _B. intestinalis_ PUL8, or similar PULs, to in vitro growth on SG10 remains uncertain. This highlights the importance of combining biochemical, in vitro
and in vivo approaches and suggests a yet-to-be-identified mechanism is responsible for inducing PUL8 expression in vivo. Of the seven _Bacteroides_ tested, only _B. caccae_ was unable to
grow on SBABN as a sole carbon source3, suggesting the ability to grow on SBABN is not, in of itself, predictive of growth on SG10. Quantitative monosaccharide composition analysis of
conditioned culture medium collected from these monocultures at the time of first evidence of growth saturation revealed similar utilization kinetics for glucose, or for the arabinose
contained in SBABN (21.4 ± 1% glucose remaining (mean ± s.d.); 17.1 ± 1.7% arabinose remaining (mean ± s.d.); _n_ = 3 independent sample preparations) (Fig. 6c,d). In contrast, 92.1 ± 2.3%
of arabinose from SG10 remained in the culture at first evidence of saturation (42 h time point), and 85.8 ± 1.3% after 96 h (mean ± s.d., _n_ = 3 independent sample preparations; Fig. 6e).
The amount of arabinose monosaccharide remaining at each of the time points surveyed was used to normalize glycosyl linkage data collected from the same samples. Comparing linkage abundance
throughout growth of _B. intestinalis_ on SG10 disclosed a statistically significant reduction in the abundance of 3-Ara_f_ (_P_ = 0.008; one-way ANOVA) and a trend toward reduced abundance
of 3-Ara_p_, 2,4-Ara_p_/2,5-Ara_f_ and 4-Ara_p_/5-Ara_f_ (_P_ = 0.07, 0.07 and 0.09, respectively; one-way ANOVA; _n_ = 3 independent sample preparations at each time point) (Fig. 6f).
Notably, 3-Ara_f_, 3-Ara_p_ and 4-Ara_p_/5-Ara_f_ were also preferentially removed from MFAB-bound SG10 that had been administered to colonized mice (Fig. 4f). DISCUSSION The synthesis of
natural glycans is structurally beholden to biocatalysis in living systems, while the generation of abiotic carbohydrates ‘simply’ reflects the physical principles of thermodynamics and
kinetics. The current study represents a mechanistic exploration of how human gut microbes respond to and utilize abiotic oligosaccharides that can be produced at scale. The addition of
different SG pools to ex vivo cultures of different human fecal samples identified SG10’s distinctive capacity to increase the proportional abundance of _Bacteroides_. We proceeded to show
that SG10 can selectively modulate the composition and expressed functions in a phylogenetically diverse 56-member community of cultured human gut bacteria that had colonized gnotobiotic
mice. Of the 15 _Bacteroides_ strains present in the mouse colonizing community, only 3 increased in absolute abundance, most notably _B. intestinalis_. In vivo supplementation of the diet
with SG10 modulated the expression of several _B. intestinalis_ PULs, including significant increases in expression of its PUL8. This PUL encodes multiple CAZymes predicted to target natural
low-abundance β-l-arabinose linkages and, to our knowledge, had no reported experimentally validated natural target1,35. Our in vitro biochemical analyses demonstrated that GH enzymes
encoded by this PUL, plus enzymes encoded by an arabinan-targeting PUL (PUL43), can degrade SG10. SG10 was predominantly degraded via an exo-mechanism resulting in an l-arabinose product
that can support central carbon metabolism via the arabinose utilization machinery encoded in PUL4341. Surprisingly, PUL8 was not induced by _B. intestinalis_ during in vitro growth with
SG10 as a sole carbon source, suggesting that a yet-to-be-identified mechanism (including, for example, degradation intermediate) is responsible for inducing its expression in vivo. We
speculate loci that target apparently rare or heretofore unidentified natural glycans may provide an advantage in severely carbon-limiting conditions or that they process microbial
polysaccharides that are structurally distinct and more diverse than those found in plants or mammals47. The chemistry used for SG synthesis provides a powerful approach for generating
nonnatural structural diversity but does not result in a single pure product. This feature required that we develop analytic approaches for defining carbohydrate degradation both in vivo and
in vitro, including the use of microscopic retrievable glass beads with bound SG10. When combined with data about PUL gene expression and the activity of their encoded GHs (for example,
PUL8 in the case of SG10), this information could provide a path forward for generating synthetic oligosaccharide preparations with enhanced representation of bioactive linkages and anomers
and, thus, increased specific activity43. Our results with SG10 describe (1) a selective benefit derived by a limited number of species (notably _B. intestinalis_), (2) failure of SG10
supplementation to increase total community biomass, (3) maintenance of cecal propionate levels but a decrease in other microbial fermentation endproducts7,14, and (4) modest degradation of
SG10 in vivo. Based on these observations, we speculate that some SGs may enable more precise manipulation of gut microbial community structure and function than many naturally occurring,
currently available prebiotic glycans—although this conjecture will require experimental validation with purified SGs and/or structurally defined pools of SGs. A recent study of genetically
engineered PUL deletions in _B. uniformis_ established that PULs can be detrimental to fitness in vitro and in vivo48. The observed reduction in absolute abundances of a subset of
_Bacteroides_ in our model human gut microbial community raises the question of whether nonnatural abiotic oligosaccharides may be exploited for antimicrobial activities. We propose that
some SGs may function as a ‘dead-end agonist’ for certain species, including pathogenic strains. Dead-end agonists can be conceptualized as producing a similar outcome as an antagonist but
instead of inhibiting function they induce a fitness cost to the organism. An example would be a _Bacteroides_ species that derives no benefit from its PULs induced by an SG and could thus
be ‘distracted’ from other more accessible glycans49. Genetic ablation of PUL8 in _B. intestinalis_ will be required to determine if it alone is responsible for the in vivo fitness benefit
during SG10 supplementation. It remains to be determined whether SG utilization also involves a newly reported glycan degradation pathway with broad substrate specificity that is present in
_B. intestinalis_ (_BACINT_01140_ – _01143_)50. Long-term dosing will be required to determine whether the fitness effects (positive or negative) of SGs on specific _Bacteroides_ are
durable, and whether the ability of a given species to utilize SGs can be acquired/evolved over meaningful timescales3. METHODS PREPARATION AND CHARACTERIZATION OF SYNTHETIC OLIGOSACCHARIDES
SYNTHESIS SGs were synthesized according to procedures detailed in ref. 7. Monosaccharides (percent wt:wt ratio as described in Supplementary Table 1 to a final weight of 100 g) were
combined with Dowex Marathon C (7.0 g, 5% dry weight ratio to monosaccharides, 29% moisture content) and 30 ml deionized water in a 1,000 ml three-necked round-bottom flask equipped with an
overhead stirrer, thermocouple plug and short-path distillation head. The mixture was stirred continuously at 100 rpm using a glass stirring shaft equipped with a Teflon halfmoon paddle. The
reaction mixture was run at 130 °C for 4 h. To quench the reaction, 60 ml deionized water was added to the mixture. The Dowex resin was removed by vacuum filtration through a fritted-glass
filter. For SG1-7, the resulting solutions were diluted to 25 degree Brix (°Bx) and purified by ethanol precipitation. To do so, each solution was slowly poured into absolute ethanol to form
a cloudy solution with a final water:ethanol ratio of 1:9 (vol:vol). The cloudy solution was then centrifuged (2,100_g_, 2 h, 5 °C). The supernatant was removed, and the precipitate was
collected and dissolved in water. Residual ethanol was removed under reduced pressure. The solution was frozen at −20 °C and lyophilized to yield the final product as a white powder. For
SG10, a 25 °Bx solution (100 ml, deionized water) was poured into vigorously stirred United States Pharmacopeia-grade ethanol (900 ml) at a rate no greater than 10 ml min−1. After the
addition was completed, the precipitated solids were allowed to stir for an additional 15 min at room temperature. The suspension was centrifuged (2,100_g_, 4 h, 5 °C), and the resulting
pellet was isolated by decanting supernatant. The pellet was redissolved in deionized water to a final concentration of 25 °Bx and reconcentrated on a rotatory evaporator to >65 °Bx to
remove ethanol. This process was repeated to ensure removal of residual ethanol. The resulting syrup was diluted to 20 °Bx, cooled to −78 °C and lyophilized to yield SG10 preparation 2 as a
white powder. Next, SG10 preparation 2 (~4 g, ~50 °Bx) was loaded onto a Teledyne ISCO RediSep Rf Gold Amine column (55 g stationary phase) using a luer tip syringe. The sample was purified
on a Biotage Isolera equipped with an evaporative light scattering detector using a 20/80 to 50/50 (vol/vol) deionized water/acetonitrile mobile phase gradient over 55 column volumes. After
the monomer fraction completely eluted at ~16 column volumes, the mobile phase was set to 100% deionized water until the remainder of the oligosaccharide composition eluted and was
collected. The monomer-free fractions were concentrated by rotary evaporation to ~20 °Bx, cooled to −78 °C and lyophilized to yield the SG10 as a white powder (preparation 1). DETERMINATION
OF THE PHYSICOCHEMICAL PROPERTIES OF THE EIGHT SG POOLS Each SG was redissolved in deionized water to 30 mg ml−1. The solution was filtered (0.2 mm), and 10 μl was injected to an Agilent
1100 HPLC system equipped with a refractive index detector, a guard column (Agilent PL aquagel-OH (7.5 × 50 mm, 5 µm); PL1149-1530) and two SEC columns (Agilent PL aquagel-OH (7.5 × 300 mm,
5 µm); PL1120-6520) connected in tandem. The mobile phase was 0.1 M NaNO3, the run time was 28 min, the flow rate was 0.9 ml min−1 and the column and refractive index detector were kept at
40 °C. Sample peak areas were integrated, and the weight-average molecular mass, number average molecular mass, mean DP, PDI and purity (in terms of percentage of oligosaccharide with a DP
of at least 2) were determined using Agilent Cirrus GPC/SEC software (v3.4.2). A calibration curve was generated from polymer standard solutions (10 mg ml−1) of d-(+)-glucose (peak molecular
weight (Mp) 180), maltose (Mp 342), maltohexaose (Mp 990), nominal Mp 6100 pullulan standard, nominal Mp 9600 pullulan standard, nominal Mp 22000 pullulan standard and nominal Mp 43000
pullulan standard (Carbosynth). EX VIVO FERMENTATION STUDIES OF SGS WITH HUMAN FECAL SAMPLES Fecal biospecimens were collected with informed consent from donors7. Briefly, donors collected
feces in a sample collection unit that was immediately sealed and placed on ice. Within 4 h, the sample collection units were transferred into an anaerobic chamber, unsealed, and the fecal
biospecimen was transferred into filtered blender bags (Interscience) where they were diluted in phosphate-buffered saline and glycerol to a 20% slurry (wt:wt) containing 15% glycerol
(wt:wt). Diluted samples were homogenized (Interscience, 032230), cooled to −78 °C and stored at −80 °C. Fecal communities were cultured under anaerobic conditions at 37 °C in Clostridial
Minimal 3 (ref. 7) in 96-well plates (Corning, 3860) that had been sealed using a Breathe-Easy sealing membrane (Sigma-Aldrich, Z380059), with a sole carbon source supplemented at 5 mg ml−1.
Growth was monitored by repeated measurements of optical density at 600 nm and culture pH51 using a Biotek Synergy H1 multimode plate reader outfitted with a Biostack 4 plate stacker. After
a 45 h incubation, community DNA was extracted using a Qiagen DNeasy PowerSoil extraction kit (cat. no. 12955-4). The 16S rRNA libraries were prepared by PCR amplification with a 515F/806R
primer set (16SrRNA_515F: GTG CCA GCM GCC GCG GTA A and 16SrRNA_806R: GGA CTA CHV GGG TWT CTA AT)52 and amplicons sequenced using an Illumina platform to a target depth of 25,000 reads per
sample. Sequencing data were analyzed by UNOISE clustering53 (USEARCH v10) and denoising of raw sequences followed by genus-level taxonomic assignments (DADA2/RDP54 v1.6). GNOTOBIOTIC MOUSE
EXPERIMENTS All gnotobiotic mouse experiments were performed following Institutional Animal Care and Use Committee and Institutional Biosafety Committee protocols that were approved by the
Washington University Animal Studies and Environmental Health and Safety Committees. PREPARATION OF THE 92-STRAIN BACTERIAL CONSORTIUM All organisms were cultured in an anaerobic growth
chamber (Coy Laboratory Products) under an atmosphere of 77% N2, 20% CO2 and 3% H2. The identity of bacterial stocks was confirmed by sequencing of full-length amplicons generated by PCR of
their 16S rRNA genes55 (primers: 8F (AGA GTT TGA TCC TGG CTC AG) and 1391R (GAC GGG CGG TGT GTR CA)). The source and catalog number for each bacterial strain is available in Supplementary
Table 4. Organisms were clonally arrayed in a 96-well plate (Sigma-Aldrich, Z707902) and stored at −80 °C in a supplemented Tryptone-Yeast extract-Glucose (TYGs) medium (Supplementary Table
10) containing 15% (vol:vol) glycerol56. The plate was moved into the anaerobic chamber, and a 20 µl aliquot from each well was transferred to 600 µl of TYGs medium in a 96-well deep-well
plate (Thermo Fisher, 260251). The deep-well plate was sealed with an aluminum foil cap and incubated anaerobically at 37 °C for 24 h. Growth in each well was assessed by measuring the
optical density of aliquots at 600 nm. A 120 µl aliquot from each well was collected, and aliquots were pooled before transfer into 1.8 ml crimp-top sealing glass vials (Wheaton). The sealed
gavage mixture was immediately introduced into gnotobiotic isolators after surface sterilization with chlorine dioxide in the transfer sleeve. COLONIZATION Germ-free male C57BL/6J mice (24
mice total; The Jackson Laboratory (000664); 20 weeks of age) were maintained within flexible plastic gnotobiotic isolators (Class Biologically Clean) at 22 °C under a strict 12 h light
cycle (lights on at 6:00) and fed an autoclavable mouse chow (Envigo, 2018S) ad libitum. Autoclaved bedding (aspen wood chips, Northeastern Products) was changed weekly. Two days before
colonization, mice were switched to the HiSF-LoFV diet19. This diet was produced using cooked human foods as described in a previous publication19, freeze-dried, milled (D90 particle size
980 μm) and pelleted. The diet was sterilized by gamma irradiation (20–50 kGy, Steris). Sterility was confirmed by culturing the diet in TYG medium under aerobic and anaerobic conditions.
Mice (_n_ = 4 animals per cage; total of 8 mice per treatment group) were given the HiSF-LoFV diet ad libitum. SG10 (preparation 2) was dissolved in drinking water to a final concentration
of 5% (wt:vol). Supplemented water was sterilized by filtration (0.22 μm diameter polyether sulfone filters; Millipore) and introduced to gnotobiotic isolators after surface sterilization
with chlorine dioxide in the transfer sleeve. Mice consumed an average of 5 ml drinking water per day, yielding an average daily dose of 250 mg. Fecal samples were collected directly into
sterile 2 ml O-ring sealing screw-top plastic vials (Axygen) and frozen immediately in liquid nitrogen. The percent water in cecal samples collected from colonized mice was determined by the
difference in their mass before and after lyophilization (74.7 ± 6.2% in SG10 treated versus 82.0 ± 1.8% in untreated animals (mean ± s.d.; _P_ = 0.0064; two-sided unpaired Welch’s
_t_-test)). A third group of mice were maintained in a germ-free state and treated with the HiSF-LoFV diet and water supplemented with SG10 throughout the experiment. GAVAGE AND RECOVERY OF
SG10-COATED MFABS FROM MICE SG10-MFABs were introduced to mice on the morning that they were to be euthanized (9 days after gavage of the bacterial consortium). SG10-MFABs were sterilized in
70% ethanol (vol:vol) twice on a magnetic tube stand before resuspension in HNTB (20 mM 4-(2-hydroxyethyl)-1-piperazineethanesulfonic acid (HEPES, pH 7.2), 50 mM NaCl, 0.05% (vol:vol)
Tween-20 and 0.01% (wt:wt) bovine serum albumin (BSA; Sigma-Aldrich, A7906)). A pool of 25 × 106 beads in 350 μl of HNTB was prepared for each mouse and the mixture was aliquoted into 1.8 ml
crimp-top sealing glass vials. The sealed MFAB solution was immediately introduced into gnotobiotic isolators after sterilization of the vial surface with chlorine dioxide in the transfer
sleeve. MFABs were introduced to mice via oral gavage of a 350 μl aliquot. Beads were recovered at the time of euthanasia 4 h after gavage. Cecal contents were gently squeezed into a 50 ml
conical tube and then resuspended in 10 ml of HNTB by pipetting and subsequently by vortexing. The resulting slurry was passed through a 100 μm Nylon filter (Corning, 352360). Beads were
isolated from the cecal suspension by centrifugation (500_g_, 5 min) through Percoll Plus (Cytiva, 17544502) in a 50 ml conical tube. Pelleted beads from each animal were distributed into
separate 5 ml sterile Eppendorf tubes and washed at least three times with HNTB on a custom magnetic tube rack until macroscopic particulate debris from intestinal contents were no longer
observed. Purified beads were filtered through a cell strainer flow cytometry snap cap (Corning, 352235) and stored in HNTB containing 0.01% (wt:wt) sodium azide at 4 °C until use. Input
beads were removed from gnotobiotic isolators after all animals had been gavaged, and stored at 37 °C for 4 h with rotation before their isolation (as above). Glycosyl linkage analysis was
performed directly after recovery of beads from the cell strainer. Beads for neutral monosaccharide composition analysis were purified by fluorescence-activated sorting (FACSAriaIII, BD
Biosciences). Aliquots of input beads were sorted throughout the procedure to quantify and monitor sort yield and purity. Sorted beads were centrifuged (1,500_g_, 5 min), the supernatant was
removed and the pelleted beads were transferred to wells of a 0.2 ml 96-well skirted PCR plate (Multimax, 2668). Beads were washed with HNTB using a magnetic plate rack, counted and stored
at 4 °C in HNTB plus 0.01% (wt:wt) sodium azide until analysis. Bead aliquots (15 × 103) were subjected to neutral monosaccharide composition analysis by GC–MS (see ‘Neutral monosaccharide
composition analysis of MFABs by GC–MS’). The order of analysis was randomized with respect to mouse treatment group. Each sample was subjected to two hydrolyses, derivatizations and
analyses. MICROBIAL COMMUNITY ANALYSIS DETERMINATION OF ABSOLUTE ABUNDANCES OF COMMUNITY MEMBERS Mouse fecal and cecal samples were snap-frozen in liquid nitrogen and stored at −80 °C until
use. Microbial community DNA was extracted as described previously43. Sequencing libraries were generated from purified DNA by tagmentation using the Nextera DNA Library Prep Kit (Illumina,
20018705) and custom barcoded primers57. Balanced libraries were sequenced on an Illumina NextSeq instrument (unidirectional 75 nt reads; 3.18 × 10⁶ ± 2.11 × 10⁵ (mean ± s.d.) reads per
sample). Reads were demultiplexed and mapped to (1) genomes from the 92-member input bacterial community, (2) two ‘spike-in’ bacterial genomes for absolute abundance calculation (see
directly below) and (3) three ‘distractor’ genomes (_Bacteroides fragilis_ NCTC 9343, National Center for Biotechnology Information (NCBI) accession NC_003228.3; _Clostridium perfringens_
ATCC 13124, NCBI accession NC_008261.1; _E. coli_ D9, NCBI accession ACDL01000000). These steps were performed using custom Perl scripts adapted to use Bowtie 2 in a procedure termed
community profiling by sequencing (COPRO-Seq)18,20. To calculate each bacterial strain’s absolute abundance, an aliquot of two bacterial strains not found in mammalian gut communities or the
diet was added to each fecal or cecal sample before DNA extraction21,22 (30 µl of a 2.22 × 10⁸ cells ml−1 suspension of _Alicyclobacillus acidiphilus_ DSM 14558 (Deutsche Sammlung von
Mikroorganismen und Zellkulturen GmbH (DSMZ), 14558) (GenBank assembly accession GCA_001544355.1) and 30 µl of a 9.93 × 10⁸ cells ml−1 suspension of _Agrobacterium radiobacter_ DSM 30147
(DSMZ, 30147) (GenBank assembly accession GCA_000421945.1)). COPRO-Seq outputs a counts table that is normalized to the informative genome size of each bacterial genome; this is used to
generate a normalized relative abundance table. The calculated percent relative abundances of the spike-in genomes were 0.52 ± 0.41% and 0.37 ± 0.29% (mean ± s.d.), respectively. For a given
taxon _i_ in sample _j_, the absolute abundance, expressed as genome equivalents per gram of feces/cecum, was calculated using the normalized relative abundance and the _A. acidiphilus_
spike-in (A. a) $${{{\mathrm{taxa}}}}_{i,\,j}=\frac{{{{\mathrm{relative}}\; {\mathrm{abundance}}}}_{i,\,j}}{{{{\mathrm{relative}}\; {\mathrm{abundance}}\,{\rm{A.}{\,a}}}}_{j}}\times
\frac{{{\rm{A.}{\,a}}\;{{\rm{cells}}\; {\mathrm{added}}\; {\mathrm{to}}\; {\mathrm{sample}}}}_{j}}{{{{\mathrm{sample}}\; {\mathrm{mass}}}\,({\mathrm{g}})}_{j}}.$$ Fifty-six community members
were identified as having a mean percent relative abundance greater than 0.05% at any one time point in either group and were defined as having colonized the mice. The most abundant
distractor genome at any time point in either group was _E. coli_ D9 (0.0003 ± 0.0001 (mean ± s.d.) percent relative abundance). Total community abundance was calculated as the sum of all 56
members. Bacteria with statistically significant SG10 treatment-associated changes in their absolute abundance in the cecal microbiota were identified using one-way ANOVA with the R
(v4.1.0) package Stats (v4.1.0). Bacteria with SG10 treatment-associated changes in their fecal levels were identified using a linear mixed-effects model (Gaussian) of absolute abundance
data (R package lme4 (v1.1-27.1); using ‘abs abundance ~ group*day + [1|mouse]’). The dependence of bacterial abundance on ‘diet by day’ was tested, and ‘mouse’ was included as a random
variable. Tukey’s HSD _P_ values from the linear models were corrected for multiple hypotheses by the Benjamini–Hochberg method. Estimated marginal means of the model were calculated using
the R package emmeans (v1.7.2). ANNOTATION OF CAZYMES AND MCSEED METABOLIC PATHWAYS REPRESENTED IN THE GENOMES OF BACTERIAL COLONIZERS OF GNOTOBIOTIC MICE CAZymes were annotated following
the CAZy classification scheme31. PULs in _Bacteroides_ were annotated on the basis of the presence of adjacent _susC_/_susD_-like genes and retrieved from the PULDB database (September
2022)24. To predict PUL substrates, individual CAZymes were subjected to NCBI BLASTp against UniProtKB/Swiss-Prot, a curated resource of experimentally characterized proteins58 and
PaperBLAST, a regularly updated database of proteins described in published scientific articles59. The enzymatic activity of individual CAZymes were predicted on the basis of the
experimentally defined activity of the nearest neighbor (percent amino acid identity). PUL substrates were predicted on the basis of the cumulative activities within that PUL and known
glycan structures. Where possible, predicted PUL substrates were confirmed with published microbial gene expression data collected in the presence of a defined glycan carbon source. In
silico predictions of the metabolic pathways of bacterial consortium members were based on an approach, implemented in the RAST/SEED platform, that combines homology- and genome
context-based evidence with known sets of enzymatic reactions and nutrient transporters into ‘microbial community (mc) subsystems’; these mcSEED subsystems capture and project variations in
particular metabolic pathways across thousands of microbial genomes32. Using this comparative genomics approach, we identified intracellular catabolic pathways and uptake transporters for
various carbohydrates, amino acids, other energy sources and vitamins. The results of in silico reconstructions of carbohydrate catabolic pathways are summarized in Supplementary Table 6 in
the form of a binary phenotype matrix (BPM). The BPM consists of 55 columns each representing the capacity to use a carbohydrate nutrient, and rows comprising bacterial strains. Each cell in
the BPM gives a prediction, based on genomic sequence, of whether that organism possesses the capacity to perform the indicated metabolic function. As such, the BPM also provides a digital
phenotype for an organism, where ‘1’ or ‘0’ represents the ability or inability, respectively, to utilize the carbohydrate. MICROBIAL RNA-SEQ Cecal contents were collected at the time of
euthanasia, snap-frozen in liquid nitrogen and stored at −80 °C. Monocultures of _B. intestinalis_ DSM 17393 in a defined _Bacteroides_ culture medium46 supplemented with d-glucose, SBABN or
SG10 (final concentration 5 mg ml−1) were grown at 37 °C under anaerobic conditions in 12 ml round-bottom culture tubes. Growth was monitored on the basis of optical density measurements at
600 nm using a plate reader, with aliquots of the cultures placed in 96-well flat-bottom plates. At mid-log, cells were collected by centrifugation (7,000_g_, 7 min; 250 μl for d-glucose
and SBABN cultures, 500 μl for SG10 culture). Cells were washed with 500 μl RNAprotect Bacteria Reagent (Qiagen, cat. no. 76506) plus 1% (vol:vol) β-mercaptoethanol, incubated at 22 °C for 5
min and pelleted by centrifugation (7,000_g_, 7 min), and decanted cells were stored at −80 °C until RNA extraction. Cecal aliquots (8–25 mg) or collected cell pellets were thawed on ice,
and RNA was isolated by first bead beading each sample for 4 min with 250 µl of a slurry of 0.1-mm-diameter zirconia/silica beads, one 3.97 mm steel ball, 500 µl of phenol:chloroform:isoamyl
alcohol (25:24:1, pH 7.8–8.2), 210 µl of 20% (wt:wt) SDS and 500 µl of 2× Qiagen buffer A (200 mM Trizma base, 200 mM NaCl and 20 mM EDTA). Samples were then centrifuged (3,220_g_, 4 min, 4
°C), and 200 µl of the resultant aqueous phase (crude nucleic acid) was transferred to a 96-well deep-well plate along with 140 µl of isopropanol and 20 µl of 3 M sodium acetate (pH 5.5).
The solution was mixed by pipetting ten times. Crude nucleic acid was precipitated by incubation at −20 °C for 1 h and recovered by centrifugation (3,220_g_, 15 min, 4 °C). Pelleted crude
nucleic acid was resuspended in 300 µl of Qiagen Buffer RLT by pipetting up and down 50 times. The entire resuspended pellet was transferred from each well to a Qiagen AllPrep 96 DNA plate
(Qiagen, 80311). The plate was centrifuged (3,220_g_, 1 min, 22 °C), and the RNA-containing flow-through was captured and subsequently purified using a Qiagen AllPrep 96 DNA/RNA Kit
according to the manufacturer’s protocol. Purified RNA was quantified (NanoDrop) and diluted to 5 ng µl−1. RNA quality was assessed using an Agilent 4200 TapeStation with Agilent High
Sensitivity RNA ScreenTape (Agilent, 5067-5579). RNA-seq libraries were prepared using the Illumina Stranded Total RNA Prep, Ligation with Ribo-Zero Plus Kit (Illumina; 20040529) according
to the manufacturer’s protocol that was miniaturized, adapted and optimized for liquid handling robotics. For mouse cecal samples, 55 ng of input RNA was processed, while for _B.
intestinalis_ monocultures 1.2 ng of input RNA was processed. Briefly, rRNA was depleted with Ribo-Zero Plus and the rRNA-depleted RNA was isolated using RNACleanXP magnetic beads. The
resulting RNA was fragmented and denatured, and the first strand of cDNA was synthesized, followed by synthesis of the second strand; the resulting double-stranded cDNA was purified with
AMPure XP magnetic beads, 3′ adenylated, ligated with RNA index anchors, purified with AMPure XP magnetic beads and then amplified with IDT for Illumina Nextera DNA UD Indexes, Set D
(Illumina, 20025082), for 16 cycles. The amplified PCR product was purified with AMPure XP magnetic beads, quantified using the Invitrogen Qubit dsDNA BR Assay Kit (ThermoFisher Scientific,
Q32853), and libraries of equal mass generated before shallow sequencing on an Illumina MiniSeq-Mid-300 run. The library was rebalanced on the basis of uniquely mapping reads per nanogram of
input to target an equal number of uniquely mapping reads per sample, and balance was assessed with an Illumina MiniSeq-Mid-300 run. Balanced libraries were sequenced on an Illumina NovaSeq
6000 with an S4 flow cell (bidirectional 150 nt reads; 74.43 × 10⁶ ± 17.65 × 10⁶ (mean ± s.d.) total reads per cecal sample, 19.26 × 10⁶ ± 1.47 × 10⁶ total reads per _B. intestinalis_
monoculture sample). Raw sequencing reads were demultiplexed, adapter sequences were removed (Trim Galore v0.6.4; Cutadapt60 v1.16), and STAR61 (v2.7.2b) was used to map uniquely aligning
reads to the annotated genomes from the bacterial consortium gavaged into mice (20.49 × 10⁶ ± 1.97 × 10⁶ (mean ± s.d.) uniquely mapped protein-coding reads per cecal sample, 4.23 × 10⁶ ±
4.92 × 10⁵ uniquely mapped protein-coding reads per _B. intestinalis_ monoculture sample). Pre- and post-trimmed sequence quality and potential adapter contamination were assessed using
FASTQC62 (v0.11.7). Differential expression analysis was performed using the R package DESeq233 (v1.32.0) on a per-organism basis to identify gene expression levels that were significantly
different between treatment groups. Only genomes with more than 10% of their known/predicted genes having greater than 10 raw read counts in at least 4 mice in both experimental groups were
analyzed by DESeq2 (33 bacteria met these criterion). Known or predicted genes were annotated using available GFF files (Supplementary Table 4), and our reference collection of metabolic
pathways reconstructed in the SEED platform. CAZymes and PULs were annotated by employing custom scripts with manual curation. Differentially expressed PULs were identified in each organism
using GSEA from the R package fgsea34 and the 'FGSEA-simple' method (v1.18.0). DESeq2 log2 fold-change values were rank ordered and used as the input. Only PULs with more than five
quantified genes were analyzed. Loci plots were generated with the R package genoplotR63 (v0.8.11), and gene orthology was determined with reciprocal NCBI BLASTp. GC–MS OF SCFAS Frozen
cecal contents were weighed in 2 ml screw-top glass vials to which 10 μl of a mixture of internal standards was added (20 mM of acetic acid-13C2,2H4, propionic acid-2H4, butyric acid-13C4,
lactic acid-2H3 and succinic acid-13C4). The sample was acidified with 20 μl of 33% (wt:wt) hydrochloric acid. Diethyl ether (1 ml) was added, and the sample was vortexed vigorously for 10
min and then centrifuged (4,000_g_, 5 min, 22 °C) to separate the mixture into two phases. The upper organic layer was removed and transferred to a clean glass vial before the sample was
reextracted with 1 ml of diethyl ether. After combining the two ether extracts, a 60 μl aliquot was mixed with 20 μl of _N_-_tert_-butyldimethylsilyl-_N_-methyltrifluoroacetamide
derivatization reagent and allowed to react for 2 h at 22 °C in a GC autosampler vial with a 100 μl glass insert. Derivatized samples were analyzed by a split (1:100 ratio) 1 μl injection on
an Agilent 7890A GC system equipped with an Agilent HP-5MS UI capillary column (30 m × 0.25 mm inner diameter (i.d.) × 0.25 µm film thickness; 19091S-433UI) coupled to an Agilent 5977B mass
spectrometer detector using electron impact ionization (70 eV) and scanning mode. Helium was used as a carrier gas at a constant flow rate of 1 ml min−1, and the solvent delay time was 3.5
min. MFAB SYNTHESIS, IN VITRO USE AND ANALYSIS SYNTHESIS OF OLIGOSACCHARIDE-COATED MFABS Paramagnetic, 10-μm-diameter glass beads (Millipore Sigma PureProteome NHS Flexibind, LSKMAGN01) were
incubated at 22 °C overnight in a solution of 20 mM HEPES (pH 7.2) and 100 mM NaCl. Surface amine and phosphonate functional groups were installed by incubation with equal molar amounts of
(3-aminopropyl)triethoxysilane (Sigma-Aldrich, 440140) and 3-(trihydroxysilyl)propyl methylphosphonate (Sigma-Aldrich, 435716) in deionized water for 5 h at 50 °C with shaking. Beads were
derivatized at a density of 5 × 10⁶ beads ml−1, and the organosilane reagents were included at 1,000-fold excess of what would be required to coat the bead surface64. The bead surface was
labeled with 100 nM Alexa Fluor 488 NHS ester (ThermoFisher Scientific, A20000) (3 × 10⁶ beads ml−1) in 20 mM HEPES (pH 7.2) and 100 mM NaCl for 50 min at 22 °C. Oligosaccharides conjugated
to the bead surface (SG10 or maltodextrin (Sigma-Aldrich, 419680)) were resuspended at 50 mg ml−1 in 50 mM HEPES (pH 7.8) with heat and sonication. Oligosaccharides were activated to a
cyanate ester by addition of CDAP (Sigma-Aldrich, RES1458C) (0.1 mg CDAP per milligram oligosaccharide; 350 mg ml−1 dissolved in dimethyl sulfoxide (DMSO); 1 equiv.) in the presence of
triethylamine (0.5 equiv.). The oligosaccharide/CDAP/triethylamine solution was mixed for 2 min at 22 °C (refs. 43,44). Alexa Fluor 488-labeled amine plus phosphonate beads that had been
resuspended in 50 mM HEPES (pH 7.8) were added to the activated polysaccharide solution, and the reaction was allowed to proceed for 15 h at 22 °C with rotation. Bead density during
conjugation was ~20 × 106 beads ml−1, and the final polysaccharide concentration was 43 mg ml−1. Oligosaccharide-conjugated beads were resuspended by bath sonication and reduced by addition
of sodium cyanoborohydride (1 equiv.) dissolved in 20 mM HEPES (pH 7.2) and 100 mM NaCl (100 mg ml−1) and incubation for 40 min at 40 °C. Each of the reactions described above was terminated
by repeated washing with deionized water on a magnetic tube rack. Washed beads were stored in 20 mM HEPES (pH 7.2) and 100 mM NaCl at 4 °C until use. BEAD COUNTING BY FLOW CYTOMETRY Beads
were resuspended with vortexing and bath sonication. Typically, 5 μl of a bead solution were added to 200 μl of HNTB containing 2 μl of CountBright Absolute Counting Beads (ThermoFisher
Scientific, C36950). Beads were analyzed using flow cytometry on a FACSAriaIII instrument (BD Biosciences), and the data were analyzed using FlowJo (v10.8.0). Absolute bead density in the
stock solution was determined according to the manufacturer’s suggested protocol. An example of the gating strategy is shown in Supplementary Fig. 3. IN VITRO ENZYMATIC DIGESTION OF
OLIGOSACCHARIDE-COATED MFABS Porcine α-amylase (Megazyme, E-PANAA), _Aspergillus niger_ amyloglucosidase (Megazyme, E-AMGFR), _Aspergillus niger_ endo-1,5-α-arabinanase (Megazyme, E-EARAB),
_Cellvibrio japonicus_ α-L-arabinofuranosidase (Megazyme, E-ABFCJ) or _Neocallimastix patriciarum_ endo-1,4-β-xylanase (Megazyme, E-XYLNP) were added to oligosaccharide-coated MFABs (2.5 ×
106 beads ml−1 for the maltodextrin-MFAB digestion or 5 × 10⁶ beads ml−1 for the SG10-MFAB digestion). Free SG10 was digested at a concentration that equaled the concentration of MFAB-bound
SG10 (0.15 mg ml−1). All reactions contained a total of 1.2 units of enzyme (per the manufacturer’s documentation) per 1 × 10⁶ beads. For digestion of SG10 (MFAB-bound or free), reactions
were performed in 100 mM sodium acetate (pH 4.0) and 0.5 mg ml−1 BSA (wt:wt) at 37 °C for 24 h with rotation to allow maximum possible degradation. For digestion of maltodextrin-MFABs, all
reactions were performed in 50 mM sodium malate (pH 6) and 2 mM calcium chloride at 37 °C for 4 h with rotation (in the case of the arabinanase digestion, we used 100 mM sodium acetate/BSA
per the manufacturer’s recommendation). Reactions were terminated with repeated washing in 20 mM HEPES (pH 7.2) and 100 mM NaCl on a magnetic tube rack before heat inactivation at 90 °C for
15 min. Beads were then washed repeatedly in 20 mM HEPES (pH 7.2) and 100 mM NaCl on a magnetic tube rack and stored at 4 °C until analysis. Digestions of free SG10 were heat inactivated as
described above and centrifuged (15,000_g_, 15 min) to clear precipitated protein. The resulting supernatant was removed and stored at −20 °C before performing the MS analyses described
‘Neutral monosaccharide composition analysis of MFABs by GC–MS’. NEUTRAL MONOSACCHARIDE COMPOSITION ANALYSIS OF MFABS BY GC–MS An aliquot of beads (15 × 103–25 × 103) were washed repeatedly
with deionized water in a 96-well skirted PCR plate (Multimax) using a magnetic plate rack (Axygen, IMAG96P). Beads were resuspended in 175 μl of 2 M trifluoroacetic acid (TFA) containing 15
ng of D6-_myo_-inositol (CDN Isotopes, D3019) and transferred to 8 mm crimp-top sealing glass vials (Fisher Scientific, C4008-632C) before capping with Teflon-coated aluminum caps (Fisher
Scientific, C4008-2A). A 5 μl aliquot of the bead solution was removed before capping and used to count the number of beads that would be subjected to hydrolysis. Oligosaccharides were
hydrolyzed to monosaccharides by incubation at 95 °C for 2 h. Glass vials were centrifuged (3,200_g_, 5 min), the supernatant was transferred to a new glass vial, and the sample was dried
with reduced pressure using a centrifugal vacuum concentrator. Samples were oximated with addition of 20 μl of methoxyamine (15 mg ml−1 in pyridine) and incubation at 37 °C overnight. Twenty
microliters of _N_-methyl-_N_-trimethylsilyl-trifluoroacetamide plus 1% chlorotrimethylsilane (ThermoFisher Scientific, TS-48915) were added, and the solution was incubated at 70 °C for 1
h. The sample was diluted with 20 μl of heptane before analysis using an Agilent 7890A GC system equipped with an Agilent HP-5MS UI capillary column (30 m × 0.25 mm i.d. × 0.25 µm film
thickness; 19091S-433UI) coupled to an Agilent 5975C mass spectrometer detector with a splitless 1 μl injection and electron ionization (EI) in scan mode. A dilution series of l-arabinose,
d-galactose, d-glucose, d-mannose, d-rhamnose and d-xylose standards was used to identify corresponding peaks and to generate standard curves for quantitation. Raw. AIA files were exported
from the GC–MS instrument, and peaks were identified and quantitated using the R package metaMS65 (v1.28.0). Peak areas were corrected using a D6-_myo_-inositol internal standard, and
absolute quantitation was determined from linear fits of 2-fold diluted standards. The mass of oligosaccharide bound to MFABs was derived from the quotient of the absolute mass of
monosaccharide and the number of beads subjected to acid hydrolysis. The percent mass remaining was calculated as the quotient of the absolute mass of each sample and the mean of the
reference sample. Graphs were generated and statistical analysis was performed using R (v4.1.0). Independent sample preparations represent independent GC–MS derivatizations and analyses from
the same sample. CARBOHYDRATE STRUCTURAL AND QUANTITATIVE ANALYSES MONOSACCHARIDE COMPOSITION ANALYSIS OF CONDITIONED CULTURE MEDIUM BY GC–MS A 20 µl aliquot of conditioned culture medium
(corresponding to 100 µg of carbohydrate at the _t_ = 0 time point) was added to 20 µg inositol internal standard (1 mg ml−1 in deionized water) and dried using a centrifugal vacuum
concentrator. Samples were hydrolyzed in 2 M TFA for 2 h at 120 °C, reduced with sodium borodeuteride (10 mg ml−1 dissolved in 0.1 M ammonia) overnight and acetylated using acetic
anhydride/TFA. The derivatized material was extracted with dichloromethane, washed with deionized water and concentrated to a volume of ~300 µl in dichloromethane using a nitrogen gas
stream. Samples were analyzed on an Agilent 7890A gas chromatograph equipped with a 5975C mass spectrometer detector (EI mode with 70 eV). A 1 µl sample was injected in split mode (1:10
ratio), and peaks were detected by scanning an _m_/_z_ range between 30 and 450 with a scan rate of 3.4 s−1 and gain factor of 1. Independent sample preparations represent independent GC–MS
derivatizations and analyses from the same sample. Peak areas were normalized to the inositol internal standard signal from that injection, and the amount of monosaccharide remaining at each
time point was calculated relative to the _t_ = 0 time point. SOLUTION-BASED GLYCOSYL LINKAGE ANALYSIS OF FREE OLIGOSACCHARIDES Glycosyl linkage analysis of oligosaccharides was performed
as described previously with minor modifications66. Briefly, a glycan solution of 20–100 µg was lyophilized or dried using a centrifugal vacuum concentrator, dissolved in DMSO for 30 min
with gentle agitation, then freshly prepared sodium hydroxide slurry was added and incubated for 10 min followed by addition of iodomethane and incubation for 40 min. The permethylated
sample was subsequently extracted, washed and blown dry with nitrogen gas. The sample was hydrolyzed using 2 M TFA plus 1 µg inositol internal standard for 2 h at 120 °C, reduced with sodium
borodeuteride (10 mg ml−1 dissolved in 0.1 M ammonia) overnight and acetylated using acetic anhydride/TFA. The derivatized material was extracted with dichloromethane, washed with deionized
water and then concentrated to a volume of ~100 µl in dichloromethane using a nitrogen gas stream. For glycosyl linkage analysis of conditioned culture medium, 40 µl of the medium was dried
(corresponding to 200 µg of carbohydrate at the _t_ = 0 time point of the incubation) and analyzed without modification. Samples were analyzed on an Agilent 7890A gas chromatograph equipped
with a 5975C mass spectrometer detector (EI mode with 70 eV), using a 30 m RESTEK RTX-2330 capillary column (30 m × 0.25 mm i.d. × 0.25 µm film thickness). The temperature of the injector
was 250 °C. The temperatures of the detector were 230 °C for the source and 150 °C for the quadrupoles. The GC temperature program used was 80 °C for 2 min, followed by a ramp of 30 °C min−1
to 170 °C, then a second ramp of 4 °C min−1 to 245 °C and a final holding time of 5 min. The helium flow rate was 1 ml min−1, and the sample injection was 5 µl in pulsed splitless mode with
50 psi for 2 min. Linkage peak detection of samples was carried out by either selective ion monitoring mode (see ‘MFAB-based glycosyl linkage analysis’ section) or scanning an _m_/_z_ range
between 30 and 450 with a scan rate of 3.4 s−1 and a gain factor of 3. Peak areas were normalized to the inositol internal standard signal from that injection. Independent sample
preparations represent independent GC–MS derivatizations and analyses from the same sample. MFAB-BASED GLYCOSYL LINKAGE ANALYSIS SG10-MFABs were washed thoroughly with 2 ml of deionized
water five times on a magnetic tube rack. The sample was uniformly resuspended in 0.2–1.5 ml of deionized water and aliquoted into 2 ml screw-top vials containing 20–60 μg of oligosaccharide
(determined by neutral monosaccharide composition analysis). Samples were lyophilized to dryness on a magnet and stored under vacuum at 22 °C until analysis. For derivatization, an
SG10-MFAB aliquot was resuspended in 600 µl of DMSO and divided equally into three glass vials to analyze in triplicate. The MFAB–DMSO suspensions were gently agitated for 30 min with
sonication for 1 min after 15 and 30 min. Two-hundred microliters of a freshly prepared sodium hydroxide slurry66 was added to each suspension and gently agitated for 10 min, followed by
addition of 100 µl of iodomethane before incubation for 40 min with gentle agitation. Mixtures were sonicated for 1 min every 10 min. Beads were separated using a magnetic tube rack, and the
supernatant was removed. Beads were then washed once with 300 µl DMSO, followed by 300 µl of deionized water three times. Beads were transferred to a new glass vial, the liquid was removed
and the wet beads were dried with a stream of nitrogen gas. The permethylated MFAB samples were then processed as described above, except that a phase separator was used to collect the
organic layer and to remove the beads. The derivatized samples were analyzed on an Agilent 7890A gas chromatograph equipped with a 5975C mass spectrometer detector as described above with
slight modifications. The sample injection was 3 µl in pulsed splitless mode with 50 psi for 2 min. Linkage peak detection of SG10 was performed by selective ion monitoring with a gain
factor of 3 based on the signature fragments of each linkage (Supplementary Table 8). Data collection began at 9 min; at each time point, a new set of ion monitoring was enabled. Peak areas
were normalized to the inositol internal standard signal from that injection. Independent sample preparations represent independent GC–MS derivatizations and analyses from the same sample.
2D (1H,13C)-HSQC NMR A 2 mg aliquot of lyophilized SG10 was dissolved in 250 μl of deuterium oxide with 0.1% (vol:vol) acetone as the internal standard (1H-2.22 ppm, 13C-30.89 ppm) plus 0.1%
(vol/vol) acetonitrile. The solution was placed into a 3 mm NMR tube, and HSQC spectra were recorded at 25 °C on a Bruker AVANCE III 600 MHz spectrometer equipped with a 5 mm
cross-polarization quadruple resonance cryoprobe with _Z_-axis gradient using the Bruker pulse program HSQCEDETGPSISP2.3. HSQC experiments were performed with eight scans and a 1.5 s recycle
delay. Each spectrum was acquired from 7.0 to 0.0 ppm in F2 (1H) with 1024 complex data points and 120 to 0 ppm in F1 (13C) with 256 complex data points. The resulting spectra were analyzed
using Bruker TopSpin (v4.1.4) software. MALDI-TOF MS OF OLIGOSACCHARIDES Following monosaccharide composition analysis, a 15–30 µg aliquot of MFAB-bound oligosaccharide was added to 2 ml
O-ring sealing plastic screw-top vials (Axygen), washed extensively with deionized water on a magnetic tube rack, frozen in liquid nitrogen and dried by lyophilization. A total of 300 µl of
1 M NH4OH in deionized water was added to the dried MFAB sample, and the mixture was incubated at 70 °C for 3.5 h with vortexing every 30 min. Released oligosaccharide was separated from
beads on a magnetic tube rack and removed. Beads were washed twice with 150 µl of 1 M NH4OH and bath sonicated (Branson). The solution was removed using a magnetic tube rack and combined
with the initial collection of released oligosaccharides. Samples were dried under reduced pressure using a centrifugal vacuum concentrator. The sample was resuspended in deionized water and
dried again. Free oligosaccharide samples were treated identically as described above. The released oligosaccharide was resuspended in deionized water to a concentration of 0.15 µg µl−1
using heat and bath sonication. The mixture was cleared by centrifugation (12,000_g_, 10 min) and purified with cation exchange resin (Dowex Monosphere 88 H+) that had been washed with
deionized water. The mixture was incubated at 22 °C for 5 min with rotation. Supernatant was transferred to a new vial by pipette and cleared with centrifugation (12,000_g_, 5 min), and 10
µg of deionized oligosaccharide was aliquoted into glass sample vials with a fixed insert (Agilent Technologies, 5188-6591). Samples were dried with a centrifugal vacuum concentrator for 2 h
and stored at 22 °C until analysis. To quantify oligosaccharide release, recovered beads were subjected to neutral monosaccharide composition analysis and compared with input beads never
exposed to NH4OH. Dried samples were resuspended in 4 µl of 10 mg ml−1 Super DHB (Sigma-Aldrich, 50862), dissolved in a 1:1 (vol:vol) mixture of acetonitrile:water. Samples were spotted onto
a polished steel 384-spot MALDI plate. MALDI-TOF MS spectra were obtained on a Bruker ultrafleXtreme MALDI-TOF/TOF instrument run in positive reflector mode (instrument method RP 0–700)
with no ion suppression or cutoff. Laser intensity was adjusted as needed to keep the signal consistent between samples. Oligosaccharides ionized predominantly as monosodiated adducts. Data
were collected as the average of five laser shots, exported as text files and analyzed in the R package MALDIquant67 (v1.20). Using MALDIquant, data were variance stabilized and smoothed,
baseline was corrected and peak intensity was normalized. Spectra were aligned to a 0.002 Da tolerance and a signal-to-noise ratio equal to 2. Peaks were selected with a signal-to-noise
ratio greater than 5 and binned to 0.002 Da tolerance. Oligosaccharide peaks, each with one additional monosaccharide residue, were selected in R (v4.1.0) from a list of theoretical
monoisotopic masses of monosodiated adducts in a fashion that minimized the difference between theoretical mass and observed peak mass. Only peaks with a mass error less than 100 ppm were
included in the analysis; mass errors were typically 10–50 ppm. Peak intensities were normalized to the most abundant peak in each sample to represent changes in oligosaccharide length
distribution. MFAB-released oligosaccharides with a 3-aminopropyl linker were never observed in the mass spectrum. While we cannot rule out an intramolecular elimination of the linker, our
data suggest that oligosaccharide is released by hydrolysis of the isourea bond. GH ACTIVITY ASSAYS GENERATION OF RECOMBINANT GHS ENCODED BY _B. INTESTINALIS_ PUL8 AND PUL43 A culture of _B.
intestinalis_ DSM 17393 was grown overnight in a defined _Bacteroides_ culture medium46 supplemented with 5 mg ml−1 d-glucose (Supplementary Table 11). DNA was isolated from the cell
pellet, derived from 0.75 ml of the culture, by using hot shot lysis then the Qiagen PCR Purification Kit (Qiagen, 28104) before storage in deionized water at −20 °C. Oligonucleotide primers
for amplifying each open reading frame (as annotated in PATRIC (recently renamed Bacterial and Viral Bioinformatic Resource Center) ID 471870.8) were designed using SnapGene (v7.0.1) to (1)
remove predicted signal peptide sequences40 and (2) include overlap with the plasmid insertion site (Supplementary Table 9). Each gene was amplified using Q5 Taq polymerase (New England
Biolabs, M0492S), purified (Qiagen, 28104) and inserted into a pET28b vector with an N-terminal His10-tag by HiFi assembly according to the manufacturer’s suggested protocol (New England
Biolabs, E2621S). The assembly mixture was transformed into chemically competent _E. coli_ DH5α cells, and plasmid DNA was isolated from single colonies using a miniprep DNA kit (Qiagen,
27104). Plasmid identity was confirmed by whole plasmid sequencing (Plasmidsaurus). GHs were expressed as N-terminally His10-tagged fusion proteins in _E. coli_ BL21(DE3). To do so, cells
were grown in Terrific Broth (Research Products International, T15000) supplemented with 50 μg ml−1 kanamycin to mid-log phase (0.4–0.6 OD600). Protein expression was then induced by
addition of isopropyl-β-d-1-thiogalactopyranoside to 0.1 mM or 0.3 mM followed by an 18 h incubation at 20 °C with shaking (expression conditions for each protein are provided in
Supplementary Table 9). Cells were isolated by centrifugation (5,000_g_, 10 min), and the resultant cell pellets were stored at −80 °C until use. Frozen cell pellets were thawed on ice
before resuspension in 5× (wt:vol) 50 mM HEPES (pH 7.4), 5% (wt:wt) glycerol, 250 mM NaCl, 20 mM imidazole, 1 mM phenylmethylsulphonyl fluoride plus 3–5 mg lysozyme (ThermoFisher), 1 mg
RNase (Sigma) and 60 units DNase (Sigma) per gram of wet cell pellet. Cell suspensions were rotated for 30 min at 4 °C before lysis by tip sonication (Branson), and cell debris was removed
by centrifugation (11,000_g_, 40 min, 4 °C). The resulting supernatant was filtered and subjected to Ni-NTA affinity chromatography (Cytiva, 17524701) on an AKTA Pure fast protein liquid
chromatography system (Cytiva). Proteins were eluted using a linear gradient from 20 mM to 500 mM imidazole in 20 mM potassium phosphate (pH 7.4) and 500 mM NaCl. Individual fractions of
eluted protein were visualized by SDS–PAGE (Bio-Rad) and Coomassie staining (Bio-Rad, 1610786). Fractions that were >95% pure (Supplementary Fig. 2) were pooled and buffer exchanged at 4
°C for 36–48 h via dialysis (ThermoFisher, 66810) (dialysis buffer details are provided in Supplementary Table 9). Protein concentration was determined by ultraviolet–visible light
spectroscopy (Shimadzu 1900i) at 280 nm using an _ε_ value calculated from the protein’s primary sequence. Recombinant proteins were either stored at 4 °C for immediate use, or concentrated
using a Millipore centrifugal filter (10,000 Da molecular weight cutoff; UFC801024) and supplemented with glycerol to 10% (vol:vol) before storage at −80 °C. BACINT_00520, 00524, 00525,
00526, 02466, 02785 and 02768 were purified more than once due to low yield and reaction condition optimization with similar purity and biochemical results. The remaining proteins were
purified once and used for all experiments. No soluble protein was recovered from BACINT_00515 despite repeated efforts. IN VITRO DIGESTION OF ARABINAN OR SG10 BY _B. INTESTINALIS_ GHS The
recombinant His10-tagged GHs from PUL8 and PUL43, as well as commercially available enzymes (_A. niger_ endo-1,5-α-arabinanase (Megazyme, E-EARAB), _C. japonicus_ α-l-arabinofuranosidase
(Megazyme, E-ABFCJ), _A. niger_, α-l-arabinofuranosidase (Megazyme, E-AFASE), porcine α-amylase (Megazyme, E-PANAA), _N. patriciarum_ endo-1,4-β-xylanase (Megazyme, E-XYLNP)), were
individually incubated at 37 °C with 10 mg ml−1 SBABN, 10 mg ml−1 SG10 or deionized water (no glycan control) at a final enzyme concentration of 0.5 µM in an optimized reaction buffer
(Supplementary Table 9). Enzyme reactions were performed in biological triplicate, while the no enzyme, SBABN only control or SG10 only control were performed in biological duplicate.
Reactions were terminated at time points 0 min, 30 min and 4 h by heating to 95 °C for 5 min before cooling to room temperature and storage at −20 °C. The enzymatic activity of each protein
was determined using a bicinchoninic acid (BCA) assay45 (ThermoFisher Scientific, 23225) and a coupled enzyme assay that specifically detects l-arabinose or d-galactose (Megazyme, K-ARGA).
For the BCA assay, 40 μl of reaction product was added to a skirted 96-well PCR plate (Bio-Rad, HSP9601) before 120 μl of 50:1 (reagent A:reagent B) BCA working reagent was added. Plates
were sealed (Bio-Rad, MSB1001) and incubated at 80 °C for 20 min in a thermal cycler. After cooling to room temperature, a 120 μl aliquot was transferred to a 96-well half-area plate
(Greiner, 675180) and absorbance was measured at 562 nm. The l-arabinose/d-galactose coupled enzyme assay kit (Megazyme, K-ARGA) was used according to the manufacturer’s suggested protocol.
Briefly, 20 μl of the reaction was combined with 10 μl β-nicotinamide adenine dinucleotide, 20 μl reaction buffer and 190 μl water in a 96-well plate (Costar, 3370). After 3 min, 2 μl of
β-galactose dehydrogenase and galactose mutarotase was added to each well and mixed by pipette, and absorbance at 340 nm was monitored for 1 h at 1 min intervals. For both assays, (1) a
two-fold dilution series of l-arabinose in the enzyme’s corresponding reaction buffer was used to generate a standard curve on the sample plate, and (2) each biological replicate was tested
in duplicate. The number of micrograms of relative reducing ends (BCA assay) or l-arabinose (coupled enzyme assay) was calculated from the standard curve, and the 30 min and 4 h time point
data were made relative to the 0 min time point. Data were normalized to represent a 50 µl reaction. The normalized data were used for a one-sided (greater than) Mann–Whitney _U_ test
comparing product abundance for a given substrate at time 30 min or 4 h to the time-matched no enzyme control samples and corrected by the Benjamini–Hochberg method. The mean of normalized
technical replicates was calculated and graphed with ggplot2 (v3.4.4). Statistical analysis was performed in R (v4.2.0). IN VITRO BACTERIAL GROWTH ASSAYS Bacterial stocks were struck onto
agar plates containing brain–heart infusion medium (Becton Dickinson) supplemented with 10% (vol:vol) horse blood. Plates were incubated anaerobically at 37 °C for 1 day. Single colonies
were then picked and grown overnight in a defined _Bacteroides_ culture medium46 (Supplementary Table 11) containing 5 mg ml−1 d-glucose at 37 °C. Bacteria were diluted 1:250 (vol:vol) into
2× defined _Bacteroides_ culture medium and aliquoted into wells of a 384-well plate using a liquid handling robot located within a Coy chamber. Carbon sources were resuspended at 10 mg ml−1
in deionized water and sterilized by autoclaving. Tested carbon sources included d-glucose, SBABN (Megazyme, P-ARAB), SG10 preparation 1 and SG10 preparation 2. An equal volume of the stock
solution of a given carbon source was added to each well (final concentration, 5 mg ml−1). Plates were sealed with an optically clear membrane (Axygen, UC500), and growth at 37 °C under
anaerobic conditions was monitored by measuring optical density at 600 nm every 15 min (Biotek Eon instrument with a BioStack 4). All conditions were tested in triplicate. STATISTICAL
ANALYSES Details regarding statistical tests used, number and definition of replicates, means and variance are provided in the text, figure legends or tables. We employed Benjamini–Hochberg
correction, ANOVA, linear mixed-effects model (Gaussian), Tukey’s HSD (confidence level 0.95) of ANOVA results, negative binomial generalized linear model, two-sided Welch’s _t_-test and
Mann–Whitney _U_ test (one- or two-sided) statistical tests that were performed in R. Exact _P_ values are reported in the figures, figure legends or source data files. The gnotobiotic mouse
experiment was performed one time, with eight mice per group. MATERIALS AVAILABILITY Most bacterial strains used in the present study were obtained from ATCC or DSMZ. Strains from the
corresponding author’s lab can be obtained upon request. REPORTING SUMMARY Further information on research design is available in the Nature Portfolio Reporting Summary linked to this
article. DATA AVAILABILITY Shotgun microbial community DNA sequencing and microbial RNA-seq datasets generated from gnotobiotic mice have been deposited at the European Nucleotide Archive
(ENA; https://www.ebi.ac.uk/ena) under accession number PRJEB55381. MALDI-TOF MS data are available in GlycoPOST (https://glycopost.glycosmos.org/) under accession number GPST000301. Source
data are provided with this paper. CODE AVAILABILITY Code for COPRO-Seq analysis is available at https://gitlab.com/Gordon_Lab/COPRO-Seq. Code for microbial RNA-seq analysis is available at
https://gitlab.com/zbeller31/metatranscriptomics_pipeline. REFERENCES * Caffall, K. H. & Mohnen, D. The structure, function, and biosynthesis of plant cell wall pectic polysaccharides.
_Carbohydr. Res._ 344, 1879–1900 (2009). Article CAS PubMed Google Scholar * Varki, A. _Essentials of Glycobiology_ 3rd edn (Cold Spring Harbor Laboratory Press, 2017). * Pudlo, N. A. et
al. Phenotypic and genomic diversification in complex carbohydrate-degrading human gut bacteria. _mSystems_ 7, e0094721 (2022). Article PubMed Google Scholar * Lapébie, P., Lombard, V.,
Drula, E., Terrapon, N. & Henrissat, B. Bacteroidetes use thousands of enzyme combinations to break down glycans. _Nat. Commun._ 10, 2043 (2019). Article PubMed PubMed Central Google
Scholar * Laine, R. A. A calculation of all possible oligosaccharide isomers both branched and linear yields 1.05 × 10¹² structures for a reducing hexasaccharide: the isomer barrier to
development of single-method saccharide sequencing or synthesis systems. _Glycobiology_ 4, 759–767 (1994). Article CAS PubMed Google Scholar * Geremia, J. M., Liu, C. M. & Murphy, A.
V. Methods of producing glycan polymers. US Patent app 16/761115 (2020). * Tolonen, A. C. et al. Synthetic glycans control gut microbiome structure and mitigate colitis in mice. _Nat.
Commun._ 13, 1244 (2022). Article CAS PubMed PubMed Central Google Scholar * Conner, A. H. & Anderson, L. The tautomerization and mutarotation of β-l-arabinopyranose. Participation
of both furanose anomers. _Carbohydr. Res._ 25, 107–116 (1972). Article CAS Google Scholar * Desai, M. S. et al. A dietary fiber-deprived gut microbiota degrades the colonic mucus barrier
and enhances pathogen susceptibility. _Cell_ 167, 1339–1353 (2016). Article CAS PubMed PubMed Central Google Scholar * Ndeh, D. & Gilbert, H. J. Biochemistry of complex glycan
depolymerisation by the human gut microbiota. _FEMS Microbiol. Rev._ 42, 146–164 (2018). Article CAS PubMed Google Scholar * Van Treuren, W. & Dodd, D. Microbial contribution to the
human metabolome: implications for health and disease. _Annu. Rev. Pathol._ 15, 345–369 (2020). Article PubMed Google Scholar * Porter, N. T. & Martens, E. C. The critical roles of
polysaccharides in gut microbial ecology and physiology. _Annu. Rev. Microbiol._ 71, 349–369 (2017). Article CAS PubMed Google Scholar * Zhao, L. et al. Gut bacteria selectively promoted
by dietary fibers alleviate type 2 diabetes. _Science_ 359, 1151–1156 (2018). Article CAS PubMed Google Scholar * Millet, Y. A. et al. Modulation of the gut microbiome by novel
synthetic glycans for the production of propionate and the reduction of cardiometabolic risk factors. Preprint at _bioRxiv_ https://doi.org/10.1101/2022.04.04.487010 (2022). * Kochetkov, N.
K., Ott, A. Y. & Shashkov, A. S. Synthesis and 1H NMR and 13C spectroscopy of l-arabinopyranosyl biosides. _Russ. Chem. Bull._ 35, 183–192 (1986). Article Google Scholar * Wefers, D.
& Bunzel, M. NMR spectroscopic profiling of arabinan and galactan structural elements. _J. Agric. Food Chem._ 64, 9559–9568 (2016). Article CAS PubMed Google Scholar * Westphal, Y.
et al. Branched arabino-oligosaccharides isolated from sugar beet arabinan. _Carbohydr. Res._ 345, 1180–1189 (2010). Article CAS PubMed Google Scholar * Hibberd, M. C. et al. The effects
of micronutrient deficiencies on bacterial species from the human gut microbiota. _Sci. Transl. Med._ 9, eaal4069 (2017). Article PubMed PubMed Central Google Scholar * Ridaura, V. K.
et al. Gut microbiota from twins discordant for obesity modulate metabolism in mice. _Science_ 341, 1241214 (2013). Article PubMed Google Scholar * McNulty, N. P. et al. The impact of a
consortium of fermented milk strains on the gut microbiome of gnotobiotic mice and monozygotic twins. _Sci. Transl. Med._ 3, 106ra106 (2011). Article PubMed PubMed Central Google Scholar
* Stämmler, F. et al. Adjusting microbiome profiles for differences in microbial load by spike-in bacteria. _Microbiome_ 4, 28 (2016). Article PubMed PubMed Central Google Scholar *
Wolf, A. R. et al. Bioremediation of a common product of food processing by a human gut bacterium. _Cell Host Microbe_ 26, 463–477 (2019). Article CAS PubMed PubMed Central Google
Scholar * Anderson, K. L. & Salyers, A. A. Biochemical evidence that starch breakdown by _Bacteroides thetaiotaomicron_ involves outer membrane starch-binding sites and periplasmic
starch-degrading enzymes. _J. Bacteriol._ 171, 3192–3198 (1989). Article CAS PubMed PubMed Central Google Scholar * Terrapon, N. et al. PULDB: the expanded database of polysaccharide
utilization loci. _Nucleic Acids Res._ 46, D677–D683 (2018). Article CAS PubMed Google Scholar * Martens, E. C. et al. Recognition and degradation of plant cell wall polysaccharides by
two human gut symbionts. _PLoS Biol._ 9, e1001221 (2011). Article CAS PubMed PubMed Central Google Scholar * Patnode, M. L. et al. Interspecies competition impacts targeted manipulation
of human gut bacteria by fiber-derived glycans. _Cell_ 179, 59–73 (2019). Article CAS PubMed PubMed Central Google Scholar * Rogowski, A. et al. Glycan complexity dictates microbial
resource allocation in the large intestine. _Nat. Commun._ 6, 7481 (2015). Article CAS PubMed Google Scholar * Beller, Z. W. et al. Inducible CRISPR-targeted ‘knockdown’ of human gut
_Bacteroides_ in gnotobiotic mice discloses glycan utilization strategies. _Proc. Natl Acad. Sci. USA_ 120, e2311422120 (2023). Article CAS PubMed PubMed Central Google Scholar * Aziz,
R. K. et al. The RAST Server: rapid annotations using subsystems technology. _BMC Genomics_ 9, 75 (2008). Article PubMed PubMed Central Google Scholar * Davis, J. J. et al. The PATRIC
Bioinformatics Resource Center: expanding data and analysis capabilities. _Nucleic Acids Res._ 48, D606–D612 (2020). CAS PubMed Google Scholar * Drula, E. et al. The carbohydrate-active
enzyme database: functions and literature. _Nucleic Acids Res._ 50, D571–D577 (2022). Article CAS PubMed Google Scholar * Overbeek, R. et al. The SEED and the Rapid Annotation of
microbial genomes using Subsystems Technology (RAST). _Nucleic Acids Res._ 42, D206–D214 (2014). Article CAS PubMed Google Scholar * Love, M. I., Huber, W. & Anders, S. Moderated
estimation of fold change and dispersion for RNA-seq data with DESeq2. _Genome Biol._ 15, 550 (2014). Article PubMed PubMed Central Google Scholar * Korotkevich, G. et al. Fast gene set
enrichment analysis. Preprint at _bioRxiv_ https://doi.org/10.1101/060012 (2021). * Egorova, K. S., Kondakova, A. N. & Toukach, P. V. Carbohydrate Structure Database: tools for
statistical analysis of bacterial, plant and fungal glycomes. _Database_ 2015, bav073 (2015). Article PubMed PubMed Central Google Scholar * Luis, A. S. et al. Dietary pectic glycans are
degraded by coordinated enzyme pathways in human colonic _Bacteroides_. _Nat. Microbiol._ 3, 210–219 (2018). Article CAS PubMed Google Scholar * Cartmell, A. et al. A surface
endogalactanase in _Bacteroides thetaiotaomicron_ confers keystone status for arabinogalactan degradation. _Nat. Microbiol._ 3, 1314–1326 (2018). Article CAS PubMed PubMed Central Google
Scholar * Fujita, K., Takashi, Y., Obuchi, E., Kitahara, K. & Suganuma, T. Characterization of a novel beta-l-arabinofuranosidase in _Bifidobacterium longum_: functional elucidation of
a DUF1680 protein family member. _J. Biol. Chem._ 289, 5240–5249 (2014). Article CAS PubMed PubMed Central Google Scholar * Kikuchi, A. et al. A novel glycoside hydrolase family 97
enzyme: bifunctional beta-l-arabinopyranosidase/alpha-galactosidase from _Bacteroides thetaiotaomicron_. _Biochimie_ 142, 41–50 (2017). Article PubMed Google Scholar * Almagro Armenteros,
J. J. et al. Signal P 5.0 improves signal peptide predictions using deep neural networks. _Nat. Biotechnol._ 37, 420–423 (2019). Article CAS PubMed Google Scholar * Chang, C. et al. A
novel transcriptional regulator of l-arabinose utilization in human gut bacteria. _Nucleic Acids Res._ 43, 10546–10559 (2015). CAS PubMed PubMed Central Google Scholar * Bobik, T. A.,
Havemann, G. D., Busch, R. J., Williams, D. S. & Aldrich, H. C. The propanediol utilization (pdu) operon of _Salmonella enterica_ serovar Typhimurium LT2 includes genes necessary for
formation of polyhedral organelles involved in coenzyme B12-dependent 1,2-propanediol degradation. _J. Bacteriol._ 181, 5967–5975 (1999). Article CAS PubMed PubMed Central Google Scholar
* Wesener, D. A. et al. Microbiota functional activity biosensors for characterizing nutrient metabolism in vivo. _Elife_ 10, e64478 (2021). Article CAS PubMed PubMed Central Google
Scholar * Lees, A., Nelson, B. L. & Mond, J. J. Activation of soluble polysaccharides with 1-cyano-4-dimethylaminopyridinium tetrafluoroborate for use in protein–polysaccharide
conjugate vaccines and immunological reagents. _Vaccine_ 14, 190–198 (1996). Article CAS PubMed Google Scholar * Arnal, G., Attia, M. A., Asohan, J. & Brumer, H. A low-volume,
parallel copper-bicinchoninic acid (BCA) assay for glycoside hydrolases. _Methods Mol. Biol._ 1588, 3–14 (2017). Article CAS PubMed Google Scholar * McNulty, N. P. et al. Effects of diet
on resource utilization by a model human gut microbiota containing _Bacteroides cellulosilyticus_ WH2, a symbiont with an extensive glycobiome. _PLoS Biol._ 11, e1001637 (2013). Article
CAS PubMed PubMed Central Google Scholar * Al-Jourani, O. et al. Identification of d-arabinan-degrading enzymes in mycobacteria. _Nat. Commun._ 14, 2233 (2023). Article CAS PubMed
PubMed Central Google Scholar * Feng, J. et al. Polysaccharide utilization loci in _Bacteroides_ determine population fitness and community-level interactions. _Cell Host Microbe_ 30,
200–215 (2022). Article CAS PubMed PubMed Central Google Scholar * Scott, M., Gunderson, C. W., Mateescu, E. M., Zhang, Z. & Hwa, T. Interdependence of cell growth and gene
expression: origins and consequences. _Science_ 330, 1099–1102 (2010). Article CAS PubMed Google Scholar * Nasseri, S. A. et al. An alternative broad-specificity pathway for glycan
breakdown in bacteria. _Nature_ 631, 199–206 (2024). Article CAS PubMed Google Scholar * Heux, S., Philippe, B. & Portais, J. C. High-throughput workflow for monitoring and mining
bioprocess data and its application to inferring the physiological response of _Escherichia coli_ to perturbations. _Appl. Environ. Microbiol._ 77, 7040–7049 (2011). Article CAS PubMed
PubMed Central Google Scholar * Caporaso, J. G. et al. Global patterns of 16S rRNA diversity at a depth of millions of sequences per sample. _Proc. Natl Acad. Sci. USA_ 108, 4516–4522
(2011). Article CAS PubMed Google Scholar * Edgar, R. C. UNOISE2: improved error-correction for Illumina 16S and ITS amplicon sequencing. Preprint at _bioRxiv_
https://doi.org/10.1101/081257 (2016). * Callahan, B. J. et al. DADA2: high-resolution sample inference from Illumina amplicon data. _Nat. Methods_ 13, 581–583 (2016). Article CAS PubMed
PubMed Central Google Scholar * Turner, S., Pryer, K. M., Miao, V. P. & Palmer, J. D. Investigating deep phylogenetic relationships among cyanobacteria and plastids by small subunit
rRNA sequence analysis. _J. Eukaryot. Microbiol._ 46, 327–338 (1999). Article CAS PubMed Google Scholar * Goodman, A. L. et al. Identifying genetic determinants needed to establish a
human gut symbiont in its habitat. _Cell Host Microbe_ 6, 279–289 (2009). Article CAS PubMed PubMed Central Google Scholar * Adey, A. et al. Rapid, low-input, low-bias construction of
shotgun fragment libraries by high-density in vitro transposition. _Genome Biol._ 11, R119 (2010). Article CAS PubMed PubMed Central Google Scholar * Boutet, E. et al.
UniProtKB/Swiss-Prot, the manually annotated section of the UniProt KnowledgeBase: how to use the entry view. _Methods Mol. Biol._ 1374, 23–54 (2016). Article CAS PubMed Google Scholar *
Price, M. N. & Arkin, A. P. PaperBLAST: text mining papers for information about homologs. _mSystems_ 2, e00039 (2017). Article CAS PubMed PubMed Central Google Scholar * Martin,
M. Cutadapt removes adapter sequences from high-throughput sequencing reads. _EMBnet. J._ 17, 10–12 (2011). Article Google Scholar * Dobin, A. et al. STAR: ultrafast universal RNA-seq
aligner. _Bioinformatics_ 29, 15–21 (2013). Article CAS PubMed Google Scholar * Andrews, S. FastQC: a quality control tool for high throughput sequence data. _Babraham Bioinformatics_
http://www.bioinformatics.babraham.ac.uk/projects/fastqc/ (2010). * Guy, L., Kultima, J. R. & Andersson, S. G. genoPlotR: comparative gene and genome visualization in R. _Bioinformatics_
26, 2334–2335 (2010). Article CAS PubMed PubMed Central Google Scholar * Soto-Cantu, E., Cueto, R., Koch, J. & Russo, P. S. Synthesis and rapid characterization of
amine-functionalized silica. _Langmuir_ 28, 5562–5569 (2012). Article CAS PubMed Google Scholar * Wehrens, R., Weingart, G. & Mattivi, F. metaMS: an open-source pipeline for
GC-MS-based untargeted metabolomics. _J. Chromatogr. B_ 966, 109–116 (2014). Article CAS Google Scholar * Heiss, C., Klutts, J. S., Wang, Z., Doering, T. L. & Azadi, P. The structure
of _Cryptococcus neoformans_ galactoxylomannan contains beta-d-glucuronic acid. _Carbohydr. Res._ 344, 915–920 (2009). Article CAS PubMed PubMed Central Google Scholar * Gibb, S. &
Strimmer, K. MALDIquant: a versatile R package for the analysis of mass spectrometry data. _Bioinformatics_ 28, 2270–2271 (2012). Article CAS PubMed Google Scholar Download references
ACKNOWLEDGEMENTS We thank D. O’Donnell, M. Karlsson and J. Serugo for their invaluable assistance with mouse husbandry, M. Meier for generating shotgun sequencing and microbial RNA-seq
datasets, A. Krezel for processing two-dimensional nuclear magnetic resonance spectra, S. Henrissat for CAZyme predictions, J. Cheng for SCFA analysis, and K. Woolum and I. Artsimovitch for
their assistance in expressing and purifying GH enzymes. This work was supported by grants from the NIH (DK30292 and DK70977 to J.I.G.) and an academic industrial collaboration between
Washington University and Kaleido Biosciences. D.A.W. is the recipient of a career development award from the NIH (AT011374) and was a Damon Runyon Fellow supported by the Damon Runyon
Cancer Research Foundation (DRG–2303–17). Z.W.B. is the recipient of a predoctoral MD/PhD career development fellowship from the NIH (F30 DK123838) and is a member of the Washington
University Medical Scientist Training Program (supported by NIH grant GM007200). The Biomedical Mass Spectrometry Resource at Washington University is supported by NIH grants R24GM136766,
P30DK020579 and R21AI144658. AUTHOR INFORMATION AUTHORS AND AFFILIATIONS * Edison Family Center for Genome Sciences and Systems Biology, Washington University School of Medicine, St. Louis,
MO, USA Darryl A. Wesener, Zachary W. Beller & Jeffrey I. Gordon * Center for Gut Microbiome and Nutrition Research, Washington University School of Medicine, St. Louis, MO, USA Darryl
A. Wesener, Zachary W. Beller & Jeffrey I. Gordon * Department of Microbiology, The Ohio State University, Columbus, OH, USA Darryl A. Wesener & Megan F. Hill * Kaleido Biosciences,
Lexington, MA, USA Han Yuan, David B. Belanger & Johan E. T. van Hylckama Vlieg * Biomedical Mass Spectrometry Resource, Washington University School of Medicine, St. Louis, MO, USA
Cheryl Frankfater * Architecture et Fonction des Macromolecules Biologiques, CNRS, Aix-Marseille University, Marseille, France Nicolas Terrapon * Department of Biotechnology and Biomedicine
(DTU Bioengineering), Technical University of Denmark, Lyngby, Denmark Bernard Henrissat * Infectious and Inflammatory Disease Center, Sanford Burnham Prebys Medical Discovery Institute, La
Jolla, CA, USA Dmitry A. Rodionov, Semen A. Leyn & Andrei Osterman Authors * Darryl A. Wesener View author publications You can also search for this author inPubMed Google Scholar *
Zachary W. Beller View author publications You can also search for this author inPubMed Google Scholar * Megan F. Hill View author publications You can also search for this author inPubMed
Google Scholar * Han Yuan View author publications You can also search for this author inPubMed Google Scholar * David B. Belanger View author publications You can also search for this
author inPubMed Google Scholar * Cheryl Frankfater View author publications You can also search for this author inPubMed Google Scholar * Nicolas Terrapon View author publications You can
also search for this author inPubMed Google Scholar * Bernard Henrissat View author publications You can also search for this author inPubMed Google Scholar * Dmitry A. Rodionov View author
publications You can also search for this author inPubMed Google Scholar * Semen A. Leyn View author publications You can also search for this author inPubMed Google Scholar * Andrei
Osterman View author publications You can also search for this author inPubMed Google Scholar * Johan E. T. van Hylckama Vlieg View author publications You can also search for this author
inPubMed Google Scholar * Jeffrey I. Gordon View author publications You can also search for this author inPubMed Google Scholar CONTRIBUTIONS D.A.W. and J.I.G. designed the gnotobiotic
mouse experiments, which were performed by D.A.W. Shotgun sequencing and microbial RNA-seq datasets were generated by D.A.W. and analyzed by D.A.W., Z.W.B., N.T., B.H., D.A.R., S.A.L. and
A.O. D.B.B., H.Y. and J.E.T.v.H.V selected candidate SGs and collected data on their chemical properties and biological activities. D.A.W., H.Y. and C.F. developed carbohydrate analytical
procedures and performed the analyses. H.Y. collected glycosyl linkage data. C.F. collected MALDI-TOF MS data. M.F.H. expressed, purified and quantified GH activities. D.A.W. synthesized and
analyzed MFABs. D.A.W. and J.I.G. wrote this paper with invaluable assistance from co-authors. CORRESPONDING AUTHORS Correspondence to Darryl A. Wesener or Jeffrey I. Gordon. ETHICS
DECLARATIONS COMPETING INTERESTS A.O. and D.A.R. are co-founders of Phenobiome Inc., a company pursuing development of computational tools for predictive phenotype profiling of microbial
communities. H.Y., D.B.B. and J.E.T.v.H.V. were employees of Kaleido Biosciences, a company that sought to commercialize SGs as agents to manipulate human gut bacteria. H.Y. is an inventor
on a patent related to the production and use of SGs (US20200390798A1). D.A.W. and J.I.G. are listed as inventors on a patent application related to using particles to measure microbiota
enzymatic activities (WO2021016133A1). The other authors declare no competing interests. PEER REVIEW PEER REVIEW INFORMATION _Nature Chemical Biology_ thanks Sabina La Rosa and the other,
anonymous, reviewers for their contribution to the peer review of this work. ADDITIONAL INFORMATION PUBLISHER’S NOTE Springer Nature remains neutral with regard to jurisdictional claims in
published maps and institutional affiliations. EXTENDED DATA EXTENDED DATA FIG. 1 STRUCTURAL ANALYSIS OF SG10. A, Log2 fold-change in the fractional abundance of bacterial taxa (genus level)
in _ex vivo_ cultures of human fecal samples in medium supplemented with the indicated SG preparations. Each point represents the mean of triplicate fermentations from one of five human
donor communities; the shape of each point signifies the fecal community. The central bar in the box plot represents the median, the hinges represent the first and third quartiles, and the
box plot whiskers represent data points within 1.5 times the interquartile range. B, Glycosyl linkage analysis of SG10. Each data point represents an independent sample preparation (n = 3).
Bars represent the mean. Error bars represent the s.d. C, Anomeric region of a 2D (1H,13C)-HSQC NMR spectra of SG10. Linkages joined by beta anomeric bonds are expected to have 13C chemical
shifts (F1 axis) of 97–102 ppm based on previous literature15,16,17. Source data EXTENDED DATA FIG. 2 ABSOLUTE ABUNDANCES OF SELECTED BACTERIA IN GNOTOBIOTIC MICE. A, Data from cecal
contents. Each data point represents a single mouse (n = 8). Bars represents the mean. Error bars represent the s.d. Color denotes treatment group. _P_ values were calculated using a one-way
ANOVA and are FDR-corrected. B, Fecal data. Each point represents a single mouse (n = 8). Bars represents the mean. Error bars represent the s.d. Shaded regions highlight timepoints during
SG10 supplementation. _P_ values were calculated using a linear mixed-effects model (Gaussian) and are FDR-corrected. EXTENDED DATA FIG. 3 QUANTIFICATION OF SHORT-CHAIN FATTY ACIDS IN MOUSE
CECAL CONTENTS. The central bar in the box plot represents the median, the hinges represent the first and third quartiles, and the box plot whiskers represent data points within 1.5 times
the interquartile range. Each data point represents a single mouse (n = 8 animals). Color denotes treatment group. _P_ values were calculated using a one-way ANOVA with Tukey’s HSD
(confidence level = 0.95). Source data EXTENDED DATA FIG. 4 EXPRESSION OF PULS CONTAINING GENES ORTHOLOGOUS TO GENES IN _B. INTESTINALIS_ PUL8. A, Summary of the CAZyme content of the 17
_Bacteroides_ present in the 92-member bacterial consortium initially introduced into mice by oral gavage (of which 56 satisfied our criteria for colonization). Annotated
glycosyltransferases were omitted from this analysis as they contribute to glycan biosynthesis as opposed to glycan breakdown. B, Summary of top 10 SG10-responsive PULs as determined by GSEA
NES score. Substrate predictions are based on orthology to enzymatically characterized CAZy family members plus PUL orthology to experimentally characterized PULs in other _Bacteroides_.
Dot size represents FDR-corrected P values calculated by fgsea34. ‘-‘ indicates no substrate prediction made. a; see text for further discussion of BACINT:PUL8. C, Summary of PUL expression
in mice consuming the base HiSF-LoFV diet with or without SG10 supplementation. Expression was defined by average _susC_/_D_-like gene TPM (transcripts per million) on a per organism basis
(n = 8 mice/diet condition). EXTENDED DATA FIG. 5 CHARACTERIZATION OF SG10 RELEASED FROM MFABS WITH AMMONIUM HYDROXIDE. A, Percentage of SG10 released from SG10-MFABs subjected to chemical
release with ammonium hydroxide for varying periods of time at 70 °C. The absolute mass of arabinose remaining on the bead surface at each time point was determined by monosaccharide
composition analysis and normalized to the mass of arabinose on the surface of input beads. Each point represents an independent sample preparation from a single sample of MFABs (n = 3 (or 5
for 3.5 hour time point)). The line intersects the mean at each time point. Error bars represent the s.d. B, MALDI mass spectrum of SG10 released from MFABs. Each adjacent peak represents
an additional arabinose monomer. The sodium adducts of select arabinose oligosaccharides are denoted above the peaks (DPmer). C, Proportional abundance of SG10 DPmers in free SG10 or SG10
released from SG10-MFABs. Peak heights are normalized to the most abundant peak in the sample such that the maximum value in each sample equals 1. Lines intersect the proportional abundance
of each DPmer in a sample. Source data EXTENDED DATA FIG. 6 DEGRADATION OF SG10 BY SINGLE GLYCOSIDE HYDROLASES. Quantification of enzymatic products produced by commercially available
glycoside hydrolases used in this study at 30 minutes (A) or 4 hours (B) using sugar beet arabinan or SG10 as the substrate. Product number, GH family annotations, and reported enzymatic
activities are shown. Enzymatic reaction products produced after 4 hour incubation of recombinant glycoside hydrolases encoded by _B. intestinalis_ PUL8 (C) or PUL43 (D) using sugar beet
arabinan or SG10 as the substrate. Locus tag IDs, GH family annotations, and predicted activities (based on highest amino acid sequence identity to an experimentally characterized GH family
member) are shown. For each tested glycoside hydrolase, released l-arabinose was measured using a coupled enzyme assay while generated reducing ends were measured with a bicinchoninic acid
assay. Each point represents the mean (n = 2; technical replicates) of an independent biological replicate (n = 3). Bar height depicts the mean and error bars the s.d. _P_ values were
calculated versus the no enzyme control using a one-sided Mann-Whitney _U_ test and are Benjamini-Hochberg corrected. Source data EXTENDED DATA FIG. 7 ANALYSIS OF _B. INTESTINALIS_ PUL GENE
EXPRESSION DURING _IN VITRO_ GROWTH ON DEFINED CARBON SOURCES. Heatmap depicting the expression of genes in _B. intestinalis_ PUL8 (A) or PUL43 (B) during _in vitro_ growth on d-glucose,
sugar beet arabinan (SBABN), or SG10 as a sole carbon source. Data are organized by carbon source and cell color represents log2 transcripts per million (TPM + 1) to enable direct comparison
between experimental groups and genes. Each column represents a technical replicate collected and processed independently from a single monoculture. Heatmap colors depicting levels of _in
vivo_ gene expression are the average of all mice from the treatment group (n = 8 animals) and represent data presented in Fig. 2. Differentially expressed genes were defined as having
DESeq2 FDR-adjusted _P_ values < 0.01. Locus tag IDs, GH family annotations, and select gene names are shown. Source data SUPPLEMENTARY INFORMATION SUPPLEMENTARY INFORMATION Supplementary
Figs. 1–3. REPORTING SUMMARY SUPPLEMENTARY TABLES 1–11 Supplementary Tables 1–11. SOURCE DATA SOURCE DATA FIG. 1 Statistical source data. SOURCE DATA FIG. 2 Statistical source data. SOURCE
DATA FIG. 3 Statistical source data. SOURCE DATA FIG. 4 Statistical source data. SOURCE DATA FIG. 5 Statistical source data. SOURCE DATA FIG. 6 Statistical source data. SOURCE DATA EXTENDED
DATA FIG. 1 Statistical source data. SOURCE DATA EXTENDED DATA FIG. 3 Statistical source data. SOURCE DATA EXTENDED DATA FIG. 5 Statistical source data. SOURCE DATA EXTENDED DATA FIG. 6
Statistical source data. SOURCE DATA EXTENDED DATA FIG. 7 Statistical source data. RIGHTS AND PERMISSIONS OPEN ACCESS This article is licensed under a Creative Commons
Attribution-NonCommercial-NoDerivatives 4.0 International License, which permits any non-commercial use, sharing, distribution and reproduction in any medium or format, as long as you give
appropriate credit to the original author(s) and the source, provide a link to the Creative Commons licence, and indicate if you modified the licensed material. You do not have permission
under this licence to share adapted material derived from this article or parts of it. The images or other third party material in this article are included in the article’s Creative Commons
licence, unless indicated otherwise in a credit line to the material. If material is not included in the article’s Creative Commons licence and your intended use is not permitted by
statutory regulation or exceeds the permitted use, you will need to obtain permission directly from the copyright holder. To view a copy of this licence, visit
http://creativecommons.org/licenses/by-nc-nd/4.0/. Reprints and permissions ABOUT THIS ARTICLE CITE THIS ARTICLE Wesener, D.A., Beller, Z.W., Hill, M.F. _et al._ In vivo manipulation of
human gut _Bacteroides_ fitness by abiotic oligosaccharides. _Nat Chem Biol_ 21, 544–554 (2025). https://doi.org/10.1038/s41589-024-01763-6 Download citation * Received: 03 May 2023 *
Accepted: 27 September 2024 * Published: 23 October 2024 * Issue Date: April 2025 * DOI: https://doi.org/10.1038/s41589-024-01763-6 SHARE THIS ARTICLE Anyone you share the following link
with will be able to read this content: Get shareable link Sorry, a shareable link is not currently available for this article. Copy to clipboard Provided by the Springer Nature SharedIt
content-sharing initiative