A large-scale multi-label 12-lead electrocardiogram database with standardized diagnostic statements
- Select a language for the TTS:
- UK English Female
- UK English Male
- US English Female
- US English Male
- Australian Female
- Australian Male
- Language selected: (auto detect) - EN
Play all audios:

ABSTRACT Deep learning approaches have exhibited a great ability on automatic interpretation of the electrocardiogram (ECG). However, large-scale public 12-lead ECG data are still limited,
and the diagnostic labels are not uniform, which increases the semantic gap between clinical practice. In this study, we present a large-scale multi-label 12-lead ECG database with
standardized diagnostic statements. The dataset contains 25770 ECG records from 24666 patients, which were acquired from Shandong Provincial Hospital (SPH) between 2019/08 and 2020/08. The
record length is between 10 and 60 seconds. The diagnostic statements of all ECG records are in full compliance with the AHA/ACC/HRS recommendations, which aims for the standardization and
interpretation of the electrocardiogram, and consist of 44 primary statements and 15 modifiers as per the standard. 46.04% records in the dataset contain ECG abnormalities, and 14.45%
records have multiple diagnostic statements. The dataset also contains additional patient demographics. Measurement(s) 12-lead electrocardiogram Technology Type(s) EKG or ECG Monitor Device
SIMILAR CONTENT BEING VIEWED BY OTHERS CARDIOLOGIST-LEVEL INTERPRETABLE KNOWLEDGE-FUSED DEEP NEURAL NETWORK FOR AUTOMATIC ARRHYTHMIA DIAGNOSIS Article Open access 28 February 2024 A
PEDIATRIC ECG DATABASE WITH DISEASE DIAGNOSIS COVERING 11643 CHILDREN Article Open access 26 May 2025 DDXNET: A DEEP LEARNING MODEL FOR AUTOMATIC INTERPRETATION OF ELECTRONIC HEALTH RECORDS,
ELECTROCARDIOGRAMS AND ELECTROENCEPHALOGRAMS Article Open access 02 October 2020 BACKGROUND & SUMMARY Electrocardiogram (ECG) is an important tool for diagnosing heart diseases and
early screening1,2. In recent years, as the rapid growth in leveraging wearable devices (e.g. smartwatch3 and smart vest4) for ECG monitoring, the automatic classification of ECG has become
a hot topic. It is known that the ECG classification problems can be efficiently addressed by deep learning based approaches, providing that large-scale ECG data with labels of high quality
are available. Successful cases include the cardiologist-level arrhythmia detection5 and the screening for cardiac contractile dysfunction2, where tens of thousands ECGs with restricted
access were used in these studies. Many ECG datasets have been published in past decades6, e.g., the MIT-BIH arrhythmia database7, the INCART database8, and the QT database9, but there are
mostly dozens of ECG recordings in them, where the recordings usually have only one or two leads. In fact, such databases were mostly employed for developing models for the classification of
heartbeats rather than whole ECG records. Recently, several large 12-lead ECG datasets have been made public (Table 1), e.g. the PTB-XL dataset10,11 and the Shaoxing People’s Hospital
dataset12,13 respectively containing 21837 and 10646 records. Especially, the PTB-XL database, the CPSC database14,15, the INCART database8, and the Georgia database15, which are summarized
in Table 1, have been exploited in the PhysioNet/CinC 2020 challenge15, leading to significant progress on real-world evaluation of the ECG classification methods. However, the existing
sources of ECG are still limited for assessing the generalization ability. More importantly, ECG diagnostic statements, i.e. the label, used in the literature and competitions are not
uniform. Specifically, the PTB-XL dataset adopts SCP-ECG (i.e. standard communications protocol for computer assisted electrocardiography) statements16 and the PhysioNet/CinC challenge uses
SNOMED-CT codes17, and many ECG statements used by the two standards do not exactly match. In addition, more approaches just use non-standardized statements, e.g. a collection of common
rhythms5,12. Such divergence hinders real-world application of large-scale ECG data, and may result in unfair or misleading comparison. In this study, we present a large 12-lead ECG
dataset18 with standardized diagnostic statements conforming to the AHA/ACC/HRS (i.e., the American Heart Association, the American College of Cardiology, and the Heart Rhythm Society)
recommendations (hereinafter referred to as “AHA standard”)19. Our dataset contains 25770 12-lead clinical ECG records from 24666 patients (55.36% male and 44.64% female) and, to our best
knowledge, this is the largest accessible single-source ECG dataset. The data were collected from Shandong Provincial Hospital from 2019/08 to 2020/08. The sampling frequency is 500 Hz and
the length of records ranges from 10 to 60 seconds. Patient demographics such as age and sex are also included. 46.04% records in the dataset contain ECG abnormalities, which are described
in Chinese. The original Chinese diagnostic statements were checked by cardiologists and then converted to standardized diagnostic statements as per the AHA standard, including primary
statements, modifiers and pairing rules. The AHA standard aims for the standardization and interpretation of the ECG. It has been widely adopted in clinical scenario across the world.
Compared with SNOMED-CT or SCP-ECG, which are mainly designed for medical information interchange and hence involve redundant or uncertain terms, the AHA recommendation mainly presents
clinically useful statements and excludes unnecessary overlapping or vague terminology19. As supervised learning depends on accurate ECG labels to distinguish different ECG classes, a
clearly organized and non-overlapping system of statements helps the deep learning models to efficiently learn the intrinsic ECG characteristics. Using the AHA terminology uniformly also
enables valid model comparison and real-world clinical assessment. The Shandong Provincial Hospital (SPH) database covers a wide range of ECG abnormalities and includes 44 primary statements
and 15 modifiers as per the AHA standard. Especially, the separation of statements and modifiers as well as the pairing rules between them can characterize ECG more thoroughly, which is of
great value to explore precise ECG analysis. 14.45% records in the database and 31.39% abnormal records have multiple diagnostic statements, providing the opportunity to develop and evaluate
multi-label classification methods. METHODS DATA ACQUISITION This study was approved by the Institutional review board of Shandong Provincial Hospital. Requirement for individual patient
consent was waived and the database is allowed to be shared publicly after the data were de-identified. Original ECG records were generated at Shandong Provincial Hospital, Jinan, China
during 2019/08∼2020/08. The ECG signal was recorded by the MedEx MECG-200 machine, where the A/D converter has 24-bit resolution and the unit is mV. The ECG signal has 16-bit precision and
the sampling frequency is 500 Hz. Noises caused by the power line interference, baseline wander, and muscle contraction have been removed by the machine. Next, the filtered ECG signal was
presented to a responsible cardiologist belonging to the department of electrocardiogram for clinical diagnosis. All cardiologists have at least three-year clinical experience before they
are qualified to conduct ECG diagnosis. The ECG analysis system can automatically calculate nine ECG features for reference, which include heart rate, P wave duration, P-R interval, QRS
duration, QT interval, corrected QT (QTc) interval, QRS axis, the amplitude of the R wave in lead V5 (RV5), and the amplitude of the S wave in lead V1 (SV1). The features might be
inaccurate, especially when the ECG signal is abnormal. The responsible cardiologist made the final diagnosis in consideration of the patient health record. Under the limitations that the
record length should be between 10 and 60 seconds and the patient age should be larger than 18, the filtered signal and the diagnostic statements made by the doctor were then exported from
the MedEx MECG-200 ECG analysis system together with the following related information from the health record database of the hospital: * unique ID of the patient * age and sex of the
patient * acquisition date DATA PROCESSING Since ECG signals have been filtered by the ECG machine and were mostly of good quality, we did not make additional processing to the signals. The
ID of ECG records and patients were generated randomly, where ECG records from the same patient were still associated with the same patient ID. In order to protect the privacy of patients,
the acquisition date of ECG records were shifted by a random offset for each patient10. When there are multiple records for the same patient, the chronological order was kept unchanged
during date randomization. ECG records with missing age or sex information were excluded. The original diagnostic statements, which were written in Chinese, mainly follow the proprietary
statement set of ECG machine vendor, and also contain many inconsistent use of idioms and punctuation due to manual input. The AHA standard has 117 primary diagnostic statements under 14
categories. Each primary statement can be paired with one or more secondary statements or modifiers, which cannot be used alone. The steps to convert the original diagnostic statements to
standardized AHA terminology are as follows. * 1. An experienced cardiologist re-checked all original diagnostic statements and made corrections (also in Chinese). ECG records of poor
quality were excluded by visual inspection at the same time. * 2. We eliminated inconsistent use of idioms and punctuation as much as possible by manually converting them to uniform
terminology. * 3. We developed a series of translation rules mapping Chinese statements to standardized statements conforming to the AHA standard, where each original statement may
correspond to multiple AHA diagnostic statements. The rules do not cover all cases since there still exists vague or clinically useless statements. The rules were revised by the cardiologist
and are described in the Supplemental File 1. * 4. We applied the rules to all records with original diagnostic statements. Any ECG record with untranslatable statements was excluded.
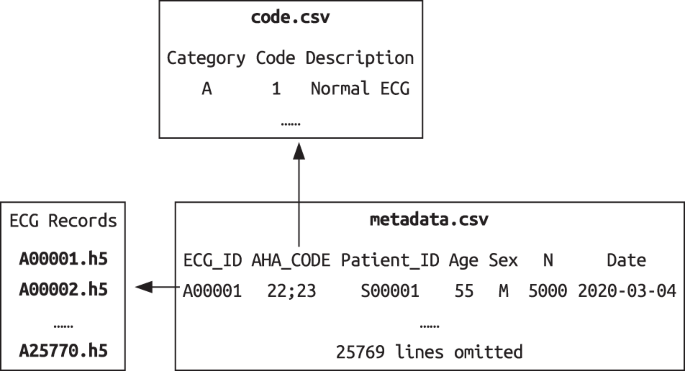
Finally, there were 25770 12-lead ECG records with standardized diagnostic statements after all steps. DATA RECORDS The SPH database includes ECG signal data, associated metadata and
diagnostic statement dictionary (see Fig. 1), which are all available online at figshare18. Each unique ECG record was saved as a 12 × _L_ array in HDF5 format with 16-bit precision, and the
file was named by the associated ID (e.g. A00001.h5). The sampling frequency is 500 Hz. _L_ is the number of samples and 12 is the number of leads. The order of leads is I, II, III, aVR,
aVL, aVF, V1, V2, V3, V4, V5, V6. There are 25770 ECG data files in total. The diagnostic statement dictionary file (code.csv) describes the AHA statements and codes used in the SPH dataset.
As shown in Table 2, there are 44 primary statements spanning across 11 categories (see Table 3). The distribution of primary statements shown in the table is highly unbalanced and should
not be viewed as the actual reflection of the population since many records were excluded for various reasons (see Methods Section). There are also 15 modifiers in Table 2, which are used to
refine the meaning of core statements and cannot be used alone19. There are more than 40 modifiers according to the AHA standard. Some modifiers (e.g. 308 and 310) can be used with a wide
range of core statements, and some modifiers can only be used with a specific category, e.g. 330–334 should be paired with statements in category M. In the metadata file, each line
represents a unique ECG record and contains the ECG ID, the patient ID, the AHA code, the age and sex, the record length, and the acquisition date, as described in Table 4. Since an ECG
record can have multiple diagnostic statements, we used the semicolon as the separator between them. Besides, each diagnostic statement consists of one primary statement and additional
modifiers, and the plus sign is used to joint them. Figure 2 describes the encoded representation of multiple statements, where the order of statements and modifiers is arbitrary. The
proportions of male and female in the dataset are 55.36% and 44.64%. Tables 5 and 6 show the overview of patient age and the record length respectively. Most ECG records are between 10 and
15 seconds. According to Table 2, there are 13905 normal ECG records, i.e., the remaining 11865 records, 46.04% of the SPH dataset, contain ECG abnormalities. Table 7 shows the overview of
the number of statements per ECG record. 14.45% records in the dataset and 31.39% abnormal records have multiple diagnostic statements. Table 8 presents the overview of the number of ECG
records per patient, and 4.32% patients have more than one ECG record. TECHNICAL VALIDATION To validate the quality of ECG records, after all the steps described in Methods Section, we
conducted signal quality assessment for original ECG records using two signal quality indices20, basSQI and pSQI representing the relative power in the baseline and the QRS complex
respectively. For each record, the index was first calculated for 12 leads separately and then averaged. Next, we checked ECG records with low SQI values to make sure their quality is still
acceptable. Figures 3 and 4 visualize the distributions of basSQI and pSQI of ECG records in the database, which have a minimum of 0.418 and 0.370 respectively. Specifically, ECG records
whose SQI values are close to the minimum were reviewed and no significant quality defect was found. Figure 5 shows four records with lowest basSQI values. It is worth pointing out that ECG
records containing one or two noisy leads or short corrupted segments, as shown in Fig. 5, were not rejected as long as reliable diagnosis can be made. Since an ECG record may have multiple
diagnostic statements, we computed the co-occurrence matrix for primary statements to show the co-occurrence relationship (see Fig. 6). For a specific primary statement, the diagonal element
represents the number of records labeled only by the specified statement, and other element in the same row means the number of records labeled by both statements. If two statements are not
likely to happen at the same time in clinical practice, e.g. atrial fibrillation and other sinus rhythms, the matrix can indicate whether such records exist in the database intuitively.
Since co-existing statements may describe different ECG intervals, the cardiologist revised the suspicious records to make sure the statements are correct. In addition, normal ECG records
should not have statements indicating abnormalities, which is verified by the first column, thus the matrix was also used for quality control purposes. AHA standard includes various pairing
rules. As this dataset contains 44 primary statements as well as 15 modifiers, we make sure that each modifier is pairing correctly with the primary statement by checking all 25 combinations
(see Table 2). USAGE NOTES The ECG data are stored in HDF5 format, a platform-independent format designed for data storage and widely supported by scientific software and programming
languages. Python code for loading the ECG data and processing diagnostic codes as well as the metadata is provided at figshare18. The hierarchy of ECG terminology presented by the AHA
standard is well-organized. 117 primary statements belong to core statements, and most ECG classification in the literature focus on this level only. Considering all kinds of AHA statements
and various real-world use cases, we suggest four tasks from coarse to fine levels for the usage of SPH dataset (see Fig. 7). The first task is the classification of normal ECG and abnormal
ECG, which account for 53.96% and 46.04% in the dataset respectively. The detection of ECG abnormalities is useful in daily ECG monitoring. The remaining three tasks are at the levels of ECG
category, primary statement, and full statement respectively, corresponding to the AHA standard, and all of them are multi-label classification. In addition, to avoid incorrect dataset
partition (e.g. records from the same patient included in both training and testing sets) and improve comparability of models trained on the dataset, we provide the Python code at figshare18
for dataset splitting. CODE AVAILABILITY The Python code for reading the ECG data, attributes and diagnostic code dictionary, evaluating the signal quality, and dataset partition is
available in figshare18. REFERENCES * Freedman, B. _et al_. Screening for atrial fibrillation A report of the AF-SCREEN international collaboration. _Circulation_ 135, 1851–1867,
https://doi.org/10.1161/CIRCULATIONAHA.116.026693 (2017). Article PubMed Google Scholar * Attia, Z. I. _et al_. Screening for cardiac contractile dysfunction using an artificial
intelligence-enabled electrocardiogram. _Nature Medicine_ 25, 70–74, https://doi.org/10.1038/s41591-018-0240-2 (2019). Article CAS PubMed Google Scholar * Perez, M. V. _et al_. Large-
scale assessment of a smartwatch to identify atrial fibrillation. _New England Journal of Medicine_ 381, 1909–1917, https://doi.org/10.1056/NEJMoa1901183 (2019). Article PubMed Google
Scholar * Liu, C. _et al_. Signal quality assessment and lightweight QRS detection for wearable ECG smartvest system. _IEEE Internet of Things Journal_ 6, 1363–1374,
https://doi.org/10.1109/JIOT.2018.2844090 (2019). Article Google Scholar * Hannun, A. Y. _et al_. Cardiologist-level arrhythmia detection and classification in ambulatory
electrocardiograms using a deep neural network. _Nature Medicine_ 25, 65–69, https://doi.org/10.1038/s41591-018-0268-3 (2019). Article CAS PubMed PubMed Central Google Scholar *
Goldberger, A. L. _et al_. PhysioBank, PhysioToolkit, and PhysioNet: Components of a new research resource for complex physiologic signals. _Circulation_ 101,
https://doi.org/10.1161/01.CIR.101.23.e215 (2000). * Moody, G. & Mark, R. The impact of the MIT-BIH Arrhythmia Database. _IEEE Engineering in Medicine and Biology Magazine_ 20, 45–50,
https://doi.org/10.1109/51.932724 (May-June/2001). * Tihonenko, V., Khaustov, A., Ivanov, S. & Rivin, A. St.-Petersburg Institute of Cardiological Technics 12-lead Arrhythmia Database.
_PhysioNet_ https://doi.org/10.13026/C2V88N (2008). * Laguna, P., Mark, R., Goldberg, A. & Moody, G. A database for evaluation of algorithms for measurement of QT and other waveform
intervals in the ECG. In _Computers in Cardiology 1997_, 673–676, https://doi.org/10.1109/CIC.1997.648140 (IEEE, Lund, Sweden, 1997). * Wagner, P. _et al_. PTB-XL, a large publicly available
electrocardiography dataset. _Scientific Data_ 7, 154, https://doi.org/10.1038/s41597-020-0495-6 (2020). Article PubMed PubMed Central Google Scholar * Wagner, P. _et al_. PTB-XL, a
large publicly available electrocardiography dataset. _PhysioNet_ https://doi.org/10.13026/x4td-x982 (2020). * Zheng, J. _et al_. A 12-lead electrocardiogram database for arrhythmia research
covering more than 10,000 patients. _Scientific Data_ 7, 48, https://doi.org/10.1038/s41597-020-0386-x (2020). Article ADS PubMed PubMed Central Google Scholar * Zheng, J. _et al_. A
12-lead electrocardiogram database for arrhythmia research covering more than 10,000 patients. _figshare_ https://doi.org/10.6084/m9.figshare.c.4560497 (2019). * Liu, F. _et al_. An open
access database for evaluating the algorithms of electrocardiogram rhythm and morphology abnormality detection. _Journal of Medical Imaging and Health Informatics_ 8, 1368–1373,
https://doi.org/10.1166/jmihi.2018.2442 (2018). Article Google Scholar * Perez Alday, E. A. _et al_. Classification of 12-lead ECGs: The PhysioNet/Computing in Cardiology Challenge 2020.
_Physiological Measurement_ 41, 124003, https://doi.org/10.1088/1361-6579/abc960 (2021). Article PubMed Google Scholar * ISO Central Secretary. Health informatics – Standard communication
protocol – Part 91064: Computer-assisted electrocardiography. Standard 11073-91064:2009, International Organization for Standardization, Geneva, CH (2009). * SNOMED International. SNOMED
CT. https://www.snomed.org/ (2022). * Liu, H. _et al_. A large-scale multi-label 12-lead electrocardiogram database with standardized diagnostic statements. _figshare_
https://doi.org/10.6084/m9.figshare.c.5779802.v1 (2022). * Mason, J. W., Hancock, E. W. & Gettes, L. S. Recommendations for the standardization and interpretation of the
electrocardiogram. _Circulation_ 115, 1325–1332, https://doi.org/10.1161/CIRCULATIONAHA.106.180201 (2007). Article PubMed Google Scholar * Li, Q., Rajagopalan, C. & Clifford, G. D. A
machine learning approach to multi-level ECG signal quality classification. _Computer Methods and Programs in Biomedicine_ 117, 435–447, https://doi.org/10.1016/j.cmpb.2014.09.002 (2014).
Article PubMed Google Scholar Download references ACKNOWLEDGEMENTS This study was supported by the Taishan Scholars Program: Distinguished Taishan Scholars in Climbing Plan (NO.
tspd20181211) and Young Taishan Scholars (NO. tsqn201909137). AUTHOR INFORMATION AUTHORS AND AFFILIATIONS * Shandong Artificial Intelligence Institute, Qilu University of Technology
(Shandong Academy of Sciences), Jinan, 250014, China Liu Hui, Chen Dan, Chen Da, Bian Lipan, Shu Minglei & Wang Yinglong * Shandong Provincial Hospital Affiliated to Shandong First
Medical University, Jinan, 250021, China Chen Dan, Zhang Xiyu & Li Huijie Authors * Liu Hui View author publications You can also search for this author inPubMed Google Scholar * Chen
Dan View author publications You can also search for this author inPubMed Google Scholar * Chen Da View author publications You can also search for this author inPubMed Google Scholar *
Zhang Xiyu View author publications You can also search for this author inPubMed Google Scholar * Li Huijie View author publications You can also search for this author inPubMed Google
Scholar * Bian Lipan View author publications You can also search for this author inPubMed Google Scholar * Shu Minglei View author publications You can also search for this author inPubMed
Google Scholar * Wang Yinglong View author publications You can also search for this author inPubMed Google Scholar CONTRIBUTIONS Hui Liu wrote the code for processing and analyzing the
data, Dan Chen and Lipan Bian reviewed the diagnostic statements of ECG records, Da Chen analyzed the results, Xiyu Zhang and Huijie Li contributed to data collection, Minglei Shu and
Yinglong Wang designed the experiments. All authors reviewed the manuscript. CORRESPONDING AUTHORS Correspondence to Shu Minglei or Wang Yinglong. ETHICS DECLARATIONS COMPETING INTERESTS The
authors declare no competing interests. ADDITIONAL INFORMATION PUBLISHER’S NOTE Springer Nature remains neutral with regard to jurisdictional claims in published maps and institutional
affiliations. SUPPLEMENTARY INFORMATION SUPPLEMENTAL FILE 1 RIGHTS AND PERMISSIONS OPEN ACCESS This article is licensed under a Creative Commons Attribution 4.0 International License, which
permits use, sharing, adaptation, distribution and reproduction in any medium or format, as long as you give appropriate credit to the original author(s) and the source, provide a link to
the Creative Commons license, and indicate if changes were made. The images or other third party material in this article are included in the article’s Creative Commons license, unless
indicated otherwise in a credit line to the material. If material is not included in the article’s Creative Commons license and your intended use is not permitted by statutory regulation or
exceeds the permitted use, you will need to obtain permission directly from the copyright holder. To view a copy of this license, visit http://creativecommons.org/licenses/by/4.0/. Reprints
and permissions ABOUT THIS ARTICLE CITE THIS ARTICLE Liu, H., Chen, D., Chen, D. _et al._ A large-scale multi-label 12-lead electrocardiogram database with standardized diagnostic
statements. _Sci Data_ 9, 272 (2022). https://doi.org/10.1038/s41597-022-01403-5 Download citation * Received: 12 January 2022 * Accepted: 18 May 2022 * Published: 07 June 2022 * DOI:
https://doi.org/10.1038/s41597-022-01403-5 SHARE THIS ARTICLE Anyone you share the following link with will be able to read this content: Get shareable link Sorry, a shareable link is not
currently available for this article. Copy to clipboard Provided by the Springer Nature SharedIt content-sharing initiative