Dustscan: a five year (2018-2022) hourly dataset of dust plumes from seviri
- Select a language for the TTS:
- UK English Female
- UK English Male
- US English Female
- US English Male
- Australian Female
- Australian Male
- Language selected: (auto detect) - EN
Play all audios:

ABSTRACT Airborne mineral dust significantly impacts air quality, human health, and the global climate. Due to sparse ground sensors, particularly in source regions, dust monitoring relies
mainly on remote sensing through Aerosol Optical Depth (AOD) retrievals from polar-orbiting satellite optical instruments. These are valuable but lack the temporal resolution for precise
plume tracking and source characterization. We introduce DustSCAN, a five-year, hourly dust plume dataset derived from the Spinning Enhanced Visible and InfraRed Imager (SEVIRI) images on
geostationary-orbit Meteosat satellites. Using multi-channel infrared images, we detect atmospheric dust and track hourly dust-affected pixels. These are clustered into discrete plumes using
the Density-Based Spatial Clustering of Applications with Noise (DBSCAN) algorithm. DustSCAN includes 9950 discrete plumes over 2018-2022 across the Sahara, the Arabian Desert, and Western
and Central Asia. It complements existing resources and provides a framework for detailed analysis of dust sources, trajectories, and impacts. Its distinctive event-based and spatio-temporal
detail offers an advancement in unraveling the complexities of dust storm dynamics. SIMILAR CONTENT BEING VIEWED BY OTHERS AN ASSESSMENT OF THE SPATIAL EXTENT OF POLAR DUST USING SATELLITE
THERMAL DATA Article Open access 13 January 2021 STUDY OF THE STRONGEST DUST STORM OCCURRED IN UZBEKISTAN IN NOVEMBER 2021 Article Open access 16 November 2023 CONTRIBUTIONS OF CLIMATIC
FACTORS AND VEGETATION COVER TO THE TEMPORAL SHIFT IN ASIAN DUST EVENTS Article Open access 28 December 2024 BACKGROUND & SUMMARY MONITORING DUST PLUMES Dust plumes originating from
limited-extent arid and semi-arid regions can significantly impact the global climate and have both beneficial and detrimental effects. These plumes play a vital role in transporting
nutrients across vast distances, thereby contributing to soil fertility in regions beyond their origin1. Dust plumes also pose a significant threat to human health and the economy. They
significantly disrupt flight schedules and reduce solar panels’ efficiency, resulting in substantial operational challenges and economic losses1,2. Dust sources are typically located in
remote and arid areas, such as the Saharan Desert, which are difficult to equip with ground sensors3. Consequently, remote sensing data has become the most widely used resource to study
atmospheric dust4. In particular, our understanding of dust storms has relied on Aerosol Optical Depth (AOD) estimates provided by low-earth orbiting satellites such as the Moderate
Resolution Imaging Spectroradiometer (MODIS), the Total Ozone Mapping Spectrometer (TOMS), and the Multi-angle Imaging SpectroRadiometer (MISR)4. These estimates come with a significant
shortcoming. Since they are based on a few daily passes, they do not offer continuous data on the evolution of dust plumes. Consequently, our understanding of dust plume sources, sinks, and
pathways remains limited. Schepanski _et al_.5 compared identifying dust source areas from daily AOD frequencies with a backtracking method using quarter-hourly geostationary-orbit satellite
images and found that the differences between the “back-tracking” and “frequency” relate to both temporal and spatial resolution. Low temporal resolution particularly limits plume tracking
and source region identification. UTILIZING GEOSTATIONARY ORBIT SATELLITES Filling this gap in continuous monitoring can be achieved with instrument measurements on geostationary satellite
platforms. The Spinning Enhanced Visible and InfraRed Imager (SEVIRI)6 on board the European Meteosat series of platforms is particularly noteworthy since its coverage encompasses the
Sahara, the largest hot desert in the world. In this contribution, the SEVIRI multichannel infrared measurements are used to develop the Dust RGB7, a false-color composite used to
distinguish airborne dust. SEVIRI dust products have been a pivotal tool in dust research. They have been used as a visual verifier for the presence of extreme dust events8,9,10 and for the
evaluation of dust prediction models11. Quantitatively, they have been utilized for mapping source areas and tracking plumes5,12– 14. Despite its extensive use and broad range of
applications, public datasets of derived dust plumes are lacking. Previous studies using SEVIRI to track dust plumes and identify source areas relied on imagery from Meteosat 8, positioned
over 0° longitude during 2002-2017. While the 0° imagery is advantageous for observing the Sahara, it is significantly distorted for major deserts in Western Asia and the Arabian Peninsula.
Furthermore, these studies faced some limitations. Spatially, some focused on a restricted area12,15. Temporally, certain analyses were confined to daytime observations, resulting in
discontinuous tracking16,17. Additionally, the reliance on manual labeling has made scalability a challenge14. To address these limitations and fill the data gap, we introduce the DustSCAN
dataset. This dataset is generated through a semi-automated methodology that utilizes hourly SEVIRI images from the Indian Ocean Data Coverage (IODC), which started in 2017 after Meteosat 8
was repositioned to 41.5°E. This coverage encompasses a wide geographic area that includes the Sahara, Arabian Peninsula, and Western and Central Asia, thus observing most of the global
“Dust Belt”. Our framework combines the use of the Dust RGB, machine learning, and subsequent manual quality control, providing extensive spatial coverage and round-the-clock tracking. We
use the multi-year hourly dust fields in conjunction with a clustering algorithm to identify discrete dust plumes. The identification of events allows the determination of source areas,
affected regions, and the extent of dust storm advection. In this data contribution, the discrete dust plumes based on SEVIRI hourly measurements during the 2018-2022 period are collected
and shared on Figshare18. We also here report on the verification of these remote sensing-based dust plume fields using ground-based AERONET measurements of AOD. METHODS MEASUREMENTS SOURCES
This study uses data provided by the European Organisation for the Exploitation of Meteorological Satellites (EUMETSAT). Specifically, modified EUMETSAT Meteosat SEVIRI Level 1.5 imagery
(2024) and Meteosat SEVIRI cloud mask data (2024)19. The SEVIRI data utilized is from the instrument’s observations in geostationary orbit over the Indian Ocean. Initially onboard Meteosat 8
at 41.5°E, and later onboard Meteosat 9 at 45.5°E. These satellite discs cover large portions of the Dust Belt, containing the world’s largest dust-emitting areas. Specifically, DustSCAN’s
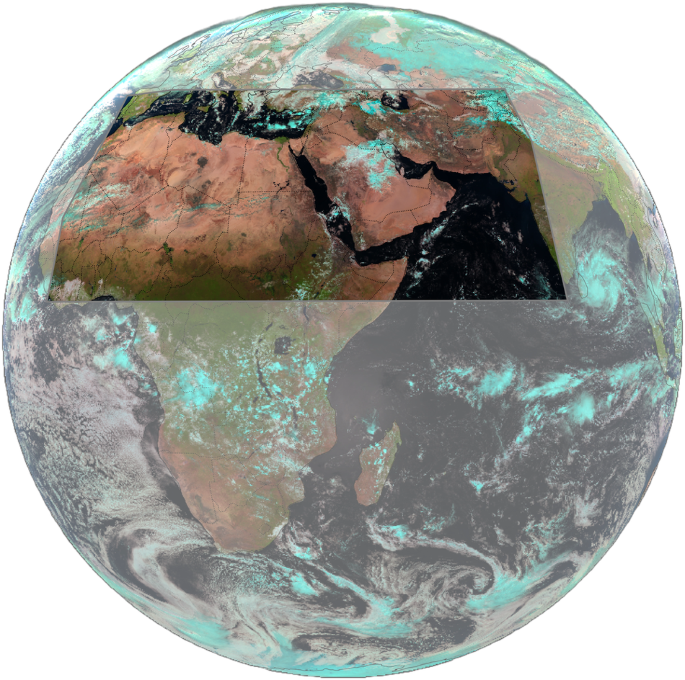
covered area stretches from 5.625° to 42.375° latitude and from -11.625° to 77.375° longitude, (Fig. 1). While the original images have a spatial resolution of 3 km at the nadir, they were
resampled to 0.25 degrees for computational efficiency. The main parameters in this study are the brightness temperatures observed in the 12.0 _μ_m, 10.8 _μ_m, and 8.7 _μ_m bands, along with
cloud masks. DUST RETRIEVAL To retrieve dust, we use the Dust RGB (Table 1 and Fig. 2(b)), a widely used false color Red-Green-Blue (RGB) composite that utilizes infrared band differences
to isolate the signature of airborne dust20. In these false-color RGB images, dust appears magenta or pink, with thicker dust portraying a stronger magenta color20. The images are commonly
used qualitatively by visual inspection. Here, an estimate of the amount of dust in a pixel is proposed by calculating the Euclidean distance from the pixel color to magenta, quantifying how
strong the pink dust signal is, as described in the following equations:
$${P}_{{\rm{dist}}}=\sqrt{{(R-{R}_{{\rm{magenta}}})}^{2}+{(G-{G}_{{\rm{magenta}}})}^{2}+{(B-{B}_{{\rm{magenta}}})}^{2}}$$ (1)
$$PDI=\frac{Ma{x}_{{\rm{dist}}}-{P}_{{\rm{dist}}}}{Ma{x}_{{\rm{dist}}}}$$ (2) In (1), _P_dist represents the distance in the color space to magenta. The variables _R_, _G_, and _B_ represent
a given pixel’s red, green, and blue color components, respectively. _R_magenta, _G_magenta, and _B_magenta are the red, green, and blue color components of the color magenta, which
correspond to [1,0,1] in RGB space. The Euclidean distance is calculated in the RGB color space between the given pixel’s color and magenta. Primarily in the remainder of this study, we use
The Pink Dust Index (PDI) as in (2). PDI is derived from _P_dist where it is normalized and inverted to be from 0 to 1 where higher values represent strong magenta (indicative of high dust
concentration) and lower values represent weak magenta (indicative of low dust concentration). In this equation, _M__a__x_dist is the maximum possible Euclidean distance in the RGB color
space. The diurnal variation in brightness temperatures can introduce a bias in PDI values. To ensure a more reliable measurement of dust concentration, we adopt a technique similar to the
one employed by Ashpole and Washington12. This approach involves calculating an anomalous PDI as described in (3).
$$PD{I}_{{\rm{anomaly}}}=PD{I}_{{\rm{current}}}-PD{I}_{{\rm{month}}\_{\rm{hourly}}}$$ (3) In (3), _P__D__I_anomaly represents the “anomalously pink” measure, indicating the extent to which
the current dust levels exceed the expected monthly norm for the given hour. The variable _P__D__I_current denotes the PDI at the current time, while _P__D__I_month_hourly refers to the
cloud-screened monthly median PDI for the corresponding hour, over the same month. Fig. 2 includes an example of the _P__D__I_anomaly metric along with true color and Dust RGBs. In this
context, we utilize the _P__D__I_anomaly as a qualitative metric indicating the presence of dust, similar to the approach adopted by Schepanski _et al_.15, as we note that this index may not
consistently quantify the precise amount of dust loading due to potential variations in brightness temperature at different dust heights. LIMITATIONS The Dust RGB capitalizes on the thermal
emissivity properties of fine, emitted dust particles, which differ from the hotter, coarser particles on the underlying desert surfaces. These differences give rise to dust appearing as
magenta or pink20,21. Several factors influence the pronounced pink color of the dust, including skin temperature, humidity, dust altitude, and particle size distribution. In the Dust RGB,
warmer surfaces appear blue, enhancing the contrast with the dust signal, whereas murky purple tones in colder conditions can obscure it, particularly in nighttime images. Additionally, the
presence of water vapor can mask out the dust signal depending on the altitude, specifically, humidity weakens the dust signal at low altitudes (<1 km), whereas, at higher altitudes, dust
becomes more apparent21. As a result, the retrievals are enhanced over deserts and weakened over vegetated surfaces21. Furthermore, smaller particle sizes tend to exhibit a pinker hue,
enhancing the detectability of dust22. Lastly, dust plumes may be concealed beneath high clouds, rendering them unobservable. PLUME CLUSTERING We isolate distinct plumes from the
spatio-temporal _P__D__I_anomaly array. In this approach, dust plumes are interpreted as moving clusters, described by Kalnis _et al_.23 as a set of objects that move close to each other for
a long time interval, like migrating animals or a convoy of cars. This approach is similar to spatial clustering but with a temporal dimension that enables tracking the movement of the
spatial clusters with time. The identified clusters represent a plume traversing the data cube. This method operates on the assumption that distinct dust plumes are closely connected in
space and time, which is a reasonable hypothesis as dust plumes mostly demonstrate clear start-to-end trajectories (see Fig. 3), unlike clouds which are mixed in the atmosphere. Our choice
of clustering algorithm is Density-Based Spatial Clustering of Applications with Noise (DBSCAN)24, a density-based clustering non-parametric algorithm that given a set of data points, it
groups points that are closely packed together (points with many close neighbors) as clusters, and labels points that are in low-density regions (whose nearest neighbors are too far away) as
outliers. DBSCAN is chosen based on three significant advantages: * 1. The DBSCAN algorithm identifies clusters of arbitrary and irregularly shaped plumes within the data cube. This
flexibility allows us to capture these events more accurately than with other methods that assume a specific shape for clusters. * 2. Robustness against noise is another key advantage of
DBSCAN. This is essential when dealing with satellite data, which often contains noisy points that obscure or distort clustering algorithms. * 3. Lastly, DBSCAN does not require prior
knowledge of the number of clusters, which is essential since the number of plumes in a given data cube is unknown beforehand. This allows the algorithm to organically determine the number
of plumes from the data. The progressive transition from Dust RGB to clustered plumes can be seen in Fig. 2(b–d). Figure 3 illustrates plume clusters in the spatio-temporal 3D space. MANUAL
QUALITY CONTROL Retrieving dust plumes from Dust RGB imagery poses several challenges that require quality control and manual checking. These include: * 1. Clouds: Certain clouds display a
magenta signature in the Dust RGB, leading to spikes in the _P__D__I_anomaly. While such clouds are particularly prevalent along the coast of Morocco, as shown in Fig. 4(a,b), we have
observed this effect in other regions as well. Ashpole and Washington12 excluded the Moroccan coastal area from their analysis. In this dataset, we recognize that this region is a
significant pathway for dust to Spain and Portugal. Therefore, we manually remove the clouds by means of visual interpretation, not only from the Moroccan coast but from all affected
regions, to ensure their effect did not skew the dataset. Additionally, dust plumes may get obscured by clouds and then reappear, potentially leading to their misidentification as new
plumes. To address this issue, visual inspection is applied to merge such plumes. * 2. Plume clustering: although plume clusters predominantly exist as separate entities in the
spatiotemporal space (Fig. 3), there are instances where plumes intersect, especially during strong storms. This intersection can result in their being mis-clustered as a single plume.
Ashpole and Washington12 addressed this issue by retaining the largest plume among the intersecting plumes. In this dataset, we depend on observer judgment to separate these intersecting
plumes based on their trajectories and source area. * 3. Corrupt data: some SEVIRI images are corrupt due to instrument technical issues, causing many errors in the process. * 4. Night
images: In the Dust RGB, the contrast between emitted dust and land diminishes during the night5,21. Although applying the hourly-based anomaly metric, _P__D__I_anomaly, partially
compensates for these limitations, detection capabilities at night remain inferior to those during the day. However, manual adjustments can improve accuracy5,25. To do so, we carefully
examine the progression of plumes in subsequent images to distinguish between stationary surface features and a passing dust plume. * 5. Aerosol effects: The detection relies on changes in
color by comparing them to a pristine sky reference, _P__D__I_month_hourly, where we assume cloud screening eliminates the effects of clouds and aerosols. However, persistent aerosol
loadings in certain regions or months can invalidate this assumption. These effects reduce detection sensitivity to color variations, necessitating manual addition and extension of plumes.
Each of these challenges has been addressed in our dataset through stringent manual quality control. As a result, we have achieved a robust representation of dust plumes, ensuring the
dataset’s reliability for further research. DATA RECORDS The DustSCAN dataset contains 5 years (2018-2022) of hourly data at a 0.25-degree resolution and is geographically referenced to the
World Geodetic System 1984 (WGS84). Each plume is assigned a unique number, allowing for consistent tracking and analysis of individual plumes over the span of five years. In addition, the
dataset includes Dust RGB images for every hour, providing a visual representation of the dust conditions. Moreover, we incorporate EUMETSAT’s cloud mask and the solar zenith angle. The
dataset is hosted on Figshare18 and is divided into five files, one for each year (a year referenced in the file name spans from the beginning of December of the previous year to the end of
November of the specified year), with each file approximately 16 GB in size. It is stored in the NetCDF file format and adheres to the NetCDF Climate and Forecast (CF) Metadata Conventions.
The fields within each data file, and their respective dimensions, are as follows: * Plume_ID: (time, latitude, longitude) - A unique identifier for plume clusters, clear pixels are assigned
a value of 0. * Dust_RGB: (time, latitude, longitude, band) - False-color Dust RGB image. * PDI: (time, latitude, longitude) - Pink Dust Index, described in the methods section. *
Cloud_Mask: (time, latitude, longitude) - Cloud mask used to identify the presence or absence of clouds. * Solar_Zenith_Angle: (time, latitude, longitude) - Solar zenith angle, derived from
the SatPy26 library. * Latitude: (latitude, longitude) - Latitude in degrees north. * Longitude: (latitude, longitude) - Longitude in degrees east. * Date: (time) - SEVIRI acquisition time
In UTC time zone. There are 43,824 hours from 2017/12/1 00:00 AM UTC to 2022/11/31 11:59 PM UTC, out of which, 43,546 are available in the dataset, and 295 hours are not available due to
various technical issues, including instrument stoppages and server malfunctions. SUPPLEMENTAL DATA Understanding dust plume dynamics requires the integration of diverse datasets, some of
which have been included for a comprehensive analysis. Namely, soil moisture data from the Soil Moisture Active Passive (SMAP)27,28 mission, Enhanced Vegetation Index (EVI) from MODIS29, and
10-meter wind vectors from the European Centre for Medium-Range Weather Forecasts (ECMWF) fifth-generation reanalysis ERA-530. These datasets have been resampled, cropped to maintain
consistent resolution and region, and added to the directory. Subsequently, plume properties, such as source area and duration, are extracted and integrated with the aforementioned datasets,
providing a unified repository for the analysis of dust plumes. Details are provided in the usage notes. TECHNICAL VALIDATION DUST RETRIEVAL To validate the dust retrieval, it is compared
against measurements taken by the AErosol RObotic NETwork (AERONET)31, which consists of ground-based sun photometers that measure AOD. AERONET measurements are considered the ground truth
reference for aerosol remote sensing and are used for validation and tuning3,32,33,34,35. AERONET DATA For AOD (at 675 nm) and Angstrom Exponent (_α_ at 440-870nm) retrievals,
quality-assured Level-2 data was used. To keep dust-dominated AOD retrievals, Gkikas _et al_.36 have relied on _α_ for aerosol characterization, associating the presence of mineral particles
with low _α_. In line with their approach and recommended thresholds, we are keeping AOD records where the _α_440−870_n__m_≤ 0.75. The validation encompasses sites situated within our
study’s region, excluding those within 2 degrees of the boundary that are distant from source areas. To ensure a statistically significant and robust validation, only sites with over 30 days
of measurements between December 2017 and November 2022 were considered, leading to the inclusion of 59 AERONET sites (Supplementary Table 1). When analyzing a site, we examine the pixels
within a 1.5-degree radius of the pixel closest to the site. If a dust plume from our data intersects this radius, the AOD for that hour is classified as “dust”. If no intersection occurs,
the AOD is classified as “clear”, or it is excluded if the cloud mask indicates cloud presence. Additionally, to match the temporal resolution of DustSCAN, site AOD data is upsampled to an
hourly frequency (Fig. 5 displays the number of hourly AOD measurements from each site). STATISTICAL ANALYSIS To evaluate the difference between dust-flagged and clear-flagged AOD
measurements across all AERONET sites, denoted as _A__O__D__d__u__s__t_ and _A__O__D__c__l__e__a__r_. We perform a two-tailed independent two-sample t-test to determine the statistical
significance of the observed difference between the means of the two groups, defined as:
$$t=\frac{{\overline{AOD}}_{{\rm{dust}}}-{\overline{AOD}}_{{\rm{clear}}}}{s\sqrt{\frac{1}{{n}_{{\rm{dust}}}}+\frac{1}{{n}_{{\rm{clear}}}}}}$$ (4) Here, \({\overline{AOD}}_{dust}\) and
\({\overline{AOD}}_{clear}\) are the means of the two groups, and _s_ is the pooled standard deviation. We confirm the significance of our validation with _t_ = 194 and a _p_ -
_v__a__l__u__e_ = 0.00 < 0.01, using aggregated data from all sites (Fig. 6(a)). This result was consistent across individual AERONET sites with sufficient data (_n_ ≥ 30 in both groups)
as shown in Fig. 6(b–k). This validates the robustness of our dust retrieval over AERONET sites. PLUME TRACKING Validating dust plume tracking is challenging due to the lack of comparison
datasets. In previous studies, this validation has been achieved through manual visual inspection of successive images and evaluation of plume movements5,12,14. As previously detailed, we
adopt this approach, acknowledging the need for manual evaluation to ensure dataset accuracy. SOURCE AREA COMPARISON We assess plume tracking by backtracking the plumes to their source
areas. This results in a source area map which can be compared to previous studies that similarly backtracked SEVIRI-derived plumes to find dust source areas. The main identified source
areas (Figure 3 in AlNasser and Entekhabi37) are consistent with previous findings. Primarily, the Bodélé depression stands out as the most significant area38. Other identified sources are
the lee side of the Aır Mountains13,38,39, Sudan38, the Syrian Desert14, Southern Iraq14, the Sistan Basin14 and the Thar Desert. USAGE NOTES The provided code extracts from the dataset
various properties of dust plumes and integrates them with supplementary data sources. Some of these properties have been previously described in dust plume literature, while others are
newly introduced by us: * Source area: Areas covered within the first hours. * Source soil moisture: Soil moisture values co-located in time and space with the identified source area. *
Source wind speed: Wind speed values co-located in time and space with the identified source area. * Source EVI: EVI values co-located in time and space with the identified source area. *
Center: The geometric centroid of the source. * Coverage: All the areas covered by a plume. * Extent: Euclidean distance from the center to the farthest point in the coverage. Highlights the
distance of advection from the source in kilometers. * Duration: Number of hours the plume lasts. * Contribution: The total number of pixels emitted from a source. Used to highlight how
much a source area contributes to dust emission. This dataset has been employed in various analyses including mapping source areas37, finding affected regions, and studying emission
co-factors such as soil moisture, wind speed, and vegetation cover. CODE AVAILABILITY The code is available on github.com/faisalalnasser13/DustSCAN and is composed of Python Jupyter
Notebooks. REFERENCES * Knippertz, P. & Stuut, J.-B. W. (eds.) _Mineral Dust_ https://doi.org/10.1007/978-94-017-8978-3 (Springer Netherlands, 2014). * Al-Dousari, A. _et al_. Solar and
wind energy: Challenges and solutions in desert regions. _Energy_ 176, 184–194 (2019). Article Google Scholar * Chiapello, I. Dust observations and climatology. In _Mineral Dust_, 149–177,
https://doi.org/10.1007/978-94-017-8978-3_7 (Springer Netherlands, 2014).. * Muhs, D. R., Prospero, J. M., Baddock, M. C. & Gill, T. E. Identifying sources of aeolian mineral dust:
Present and past. In _Mineral Dust_, 51–74, https://doi.org/10.1007/978-94-017-8978-3_3 (Springer Netherlands, 2014). * Schepanski, K., Tegen, I. & Macke, A. Comparison of satellite
based observations of Saharan dust source areas. _Remote Sensing of Environment_ 123, 90–97 (2012). Article ADS Google Scholar * Schmetz, J. _et al_. An introduction to Meteosat Second
Generation (MSG). _Bulletin of the American Meteorological Society_ 83, 992–992 (2002). Article ADS Google Scholar * Lensky, I. M. & Rosenfeld, D. Clouds-aerosols-precipitation
satellite analysis tool (CAPSAT). _Atmospheric Chemistry and Physics_ 8, 6739–6753 (2008). Article ADS CAS Google Scholar * Knippertz, P. & Todd, M. C. Mineral dust aerosols over the
Sahara: Meteorological controls on emission and transport and implications for modeling. _Reviews of Geophysics_ 50, https://doi.org/10.1029/2011rg000362 (2012). * Yassin, M. F., Almutairi,
S. K. & Al-Hemoud, A. Dust storms backward trajectories’ and source identification over Kuwait. _Atmospheric Research_ 212, 158–171 (2018). Article ADS Google Scholar * Beegum, S.
N., Gherboudj, I., Chaouch, N., Temimi, M. & Ghedira, H. Simulation and analysis of synoptic scale dust storms over the Arabian Peninsula. _Atmospheric Research_ 199, 62–81 (2018).
Article ADS Google Scholar * Johnson, B. T. _et al_. Assessment of the Met Office dust forecast model using observations from the GERBILS campaign. _Quarterly Journal of the Royal
Meteorological Society_ 137, 1131–1148 (2011). Article ADS Google Scholar * Ashpole, I. & Washington, R. An automated dust detection using SEVIRI: A multiyear climatology of
summertime dustiness in the central and western Sahara. _Journal of Geophysical Research: Atmospheres_ 117, https://doi.org/10.1029/2011jd016845 (2012). * Ashpole, I. & Washington, R. A
new high-resolution central and western Saharan summertime dust source map from automated satellite dust plume tracking. _Journal of Geophysical Research: Atmospheres_ 118, 6981–6995 (2013).
Article ADS Google Scholar * Hennen, M., White, K. & Shahgedanova, M. An assessment of SEVIRI imagery at various temporal resolutions and the effect on accurate dust emission
mapping. _Remote Sensing_ 11, 918 (2019). Article ADS Google Scholar * Schepanski, K. _et al_. Meteorological processes forcing Saharan dust emission inferred from MSG-SEVIRI observations
of subdaily dust source activation and numerical models. _Journal of Geophysical Research_ 114, D10201 (2009). Article ADS Google Scholar * Banks, J. & Brindley, H. Evaluation of
MSG-SEVIRI mineral dust retrieval products over North Africa and the Middle East. _Remote Sensing of Environment_ 128, 58–73 (2013). Article ADS Google Scholar * Banks, J. R., Brindley,
H. E., Stenchikov, G. & Schepanski, K. Satellite retrievals of dust aerosol over the Red Sea and the Persian Gulf (2005-2015). _Atmospheric Chemistry and Physics_ 17, 3987–4003 (2017).
Article ADS CAS Google Scholar * AlNasser, F. & Entekhabi, D. DustSCAN: A five year (2018-2022) hourly dataset of dust plumes from SEVIRI. _Figshare_
https://doi.org/10.6084/m9.figshare.c.6962805.v1 (2024). * High Resolution SEVIRI Indian Ocean Data Coverage (IODC). EUMETSAT Data Centre.
https://navigator.eumetsat.int/product/EO:EUM:DAT:MSG:HRSEVIRI-IODC. Accessed on January 2023. * Highwood, E. J. & Ryder, C. L. Radiative effects of dust. In _Mineral Dust_, 267–286,
https://doi.org/10.1007/978-94-017-8978-3_11 (Springer Netherlands, 2014). * Banks, J. R. _et al_. The sensitivity of the colour of dust in MSG-SEVIRI desert dust infrared composite imagery
to surface and atmospheric conditions. _Atmospheric Chemistry and Physics_ 19, 6893–6911 (2019). Article ADS CAS Google Scholar * Banks, J. R., Schepanski, K., Heinold, B., Hünerbein, A.
& Brindley, H. E. The influence of dust optical properties on the colour of simulated MSG-SEVIRI desert dust infrared imagery. _Atmospheric Chemistry and Physics_ 18, 9681–9703 (2018).
Article ADS Google Scholar * Kalnis, P., Mamoulis, N. & Bakiras, S. On discovering moving clusters in spatio-temporal data. In _Advances in Spatial and Temporal Databases_, 364–381,
https://doi.org/10.1007/11535331_21 (Springer Berlin Heidelberg, 2005). * Ester, M., Kriegel, H.-P., Sander, J. & Xu, X. A density-based algorithm for discovering clusters in large
spatial databases with noise. In _Proceedings of the Second International Conference on Knowledge Discovery and Data Mining_, 226–231 (1996). * Berndt, E. B. _et al_. A Machine Learning
Approach to Objective Identification of Dust in Satellite Imagery. _Earth and Space Science_ 8, https://doi.org/10.1029/2021EA001788 (2021). * Raspaud, M. _et al_. pytroll/satpy: Version
0.42.2 (2023/05/10) (v0.42.2). _Zenodo_ https://doi.org/10.5281/zenodo.7920730 (2023). * ONeill, P. E. _et al_. SMAP enhanced L3 radiometer global and polar grid daily 9 km ease-grid soil
moisture, version 6 https://nsidc.org/data/spl3smp_e/versions/6 (2023). * Entekhabi, D. _et al_. The Soil Moisture Active Passive (SMAP) mission. _Proceedings of the IEEE_ 98, 704–716
(2010). Article Google Scholar * Didan, K. MODIS/Terra vegetation indices 16-day l3 global 1km sin grid v061 https://lpdaac.usgs.gov/products/mod13a2v061/ (2021). * Hersbach, H. _et al_.
The ERA5 global reanalysis. _Quarterly Journal of the Royal Meteorological Society_ 146, 1999–2049 (2020). Article ADS Google Scholar * Holben, B. _et al_. AERONET—a federated instrument
network and data archive for aerosol characterization. _Remote Sensing of Environment_ 66, 1–16 (1998). Article ADS Google Scholar * Sayer, A. M., Hsu, N. C., Bettenhausen, C. &
Jeong, M.-J. Validation and uncertainty estimates for MODIS collection 6 “deep blue” aerosol data. _Journal of Geophysical Research: Atmospheres_ 118, 7864–7872 (2013). Article ADS Google
Scholar * Schuster, G. L. _et al_. Comparison of CALIPSO aerosol optical depth retrievals to AERONET measurements, and a climatology for the lidar ratio of dust. _Atmospheric Chemistry and
Physics_ 12, 7431–7452 (2012). Article ADS CAS Google Scholar * Kahn, R. A. Multiangle imaging spectroradiometer (MISR) global aerosol optical depth validation based on 2 years of
coincident aerosol robotic network (AERONET) observations. _Journal of Geophysical Research_ 110, https://doi.org/10.1029/2004jd004706 (2005). * Capelle, V. _et al_. Infrared dust aerosol
optical depth retrieved daily from IASI and comparison with AERONET over the period 2007–2016. _Remote Sensing of Environment_ 206, 15–32 (2018). Article ADS Google Scholar * Gkikas, A.
_et al_. Modis dust aerosol (MIDAS): a global fine-resolution dust optical depth data set. _Atmospheric Measurement Techniques_ 14, 309–334 (2021). Article ADS Google Scholar * AlNasser,
F. & Entekhabi, D. Tracking dust storms and identifying source areas using MSG Seviri. In _IGARSS 2023 - 2023 IEEE International Geoscience and Remote Sensing Symposium_
https://doi.org/10.1109/IGARSS52108.2023.10282687 (IEEE, 2023). * Evan, A. T. _et al_. Derivation of an observation-based map of North African dust emission. _Aeolian Research_ 16, 153–162
(2015). Article ADS Google Scholar * Caton Harrison, T., Washington, R. & Engelstaedter, S. A 14 year climatology of Saharan dust emission mechanisms inferred from automatically
tracked plumes. _Journal of Geophysical Research: Atmospheres_ 124, 9665–9690 (2019). Article ADS Google Scholar Download references ACKNOWLEDGEMENTS The authors thank AERONET PIs and
EUMETSAT for their ongoing maintenance and uploading of data. We also acknowledge the contributions of the Pytroll community in developing software packages tailored for using satellite
data. A grant from the Université Mohammed VI Polytechnique to the Massachusetts Institute of Technology supported this study. Faisal AlNasser expresses his gratitude to King Abdulaziz City
for Science and Technology (KACST) for providing him with a scholarship. AUTHOR INFORMATION AUTHORS AND AFFILIATIONS * Massachusetts Institute of Technology, Department of Civil and
Environmental Engineering, Cambridge, MA, 02139, USA Faisal AlNasser & Dara Entekhabi Authors * Faisal AlNasser View author publications You can also search for this author inPubMed
Google Scholar * Dara Entekhabi View author publications You can also search for this author inPubMed Google Scholar CONTRIBUTIONS F.A. conducted the data collection, F.A. and D.E. performed
the data analysis, F.A. also carried out quality control. D.E. supervised the project. Both F.A. and D.E. reviewed the manuscript. CORRESPONDING AUTHOR Correspondence to Faisal AlNasser.
ETHICS DECLARATIONS COMPETING INTERESTS The authors declare no competing interests. ADDITIONAL INFORMATION PUBLISHER’S NOTE Springer Nature remains neutral with regard to jurisdictional
claims in published maps and institutional affiliations. SUPPLEMENTARY INFORMATION SUPPLEMENTARY TABLE 1 RIGHTS AND PERMISSIONS OPEN ACCESS This article is licensed under a Creative Commons
Attribution 4.0 International License, which permits use, sharing, adaptation, distribution and reproduction in any medium or format, as long as you give appropriate credit to the original
author(s) and the source, provide a link to the Creative Commons licence, and indicate if changes were made. The images or other third party material in this article are included in the
article’s Creative Commons licence, unless indicated otherwise in a credit line to the material. If material is not included in the article’s Creative Commons licence and your intended use
is not permitted by statutory regulation or exceeds the permitted use, you will need to obtain permission directly from the copyright holder. To view a copy of this licence, visit
http://creativecommons.org/licenses/by/4.0/. Reprints and permissions ABOUT THIS ARTICLE CITE THIS ARTICLE AlNasser, F., Entekhabi, D. DustSCAN: A Five Year (2018-2022) Hourly Dataset of
Dust Plumes From SEVIRI. _Sci Data_ 11, 607 (2024). https://doi.org/10.1038/s41597-024-03452-4 Download citation * Received: 04 December 2023 * Accepted: 31 May 2024 * Published: 08 June
2024 * DOI: https://doi.org/10.1038/s41597-024-03452-4 SHARE THIS ARTICLE Anyone you share the following link with will be able to read this content: Get shareable link Sorry, a shareable
link is not currently available for this article. Copy to clipboard Provided by the Springer Nature SharedIt content-sharing initiative