Six years of high-resolution climatic data collected along an elevation gradient in the italian alps
- Select a language for the TTS:
- UK English Female
- UK English Male
- US English Female
- US English Male
- Australian Female
- Australian Male
- Language selected: (auto detect) - EN
Play all audios:

ABSTRACT The complex meso- and microclimatic heterogeneity inherent to mountainous regions, driven by both topographic and biotic factors, and the lack of observations, poses significant
challenges to using climate models to predict and understand impacts at various scales. We present here a six-year dataset (2017–2022) of continuous climatic measurements collected at five
elevations from 983 m to 2705 m above sea level in the Val Mazia - Matschertal valley in the Italian Alps. The measurements include the air temperature, relative humidity, wind speed and
direction, solar radiation, soil properties, precipitation, and snow height. Collected within the European Long-Term Ecological Research program (LTER), this dataset is freely available in
an open access repository. The time series may be valuable for the validation of regional climate models, atmospheric exchange modelling, and providing support for hydrological models and
remote sensing products in mountain environments. Additionally, our data may be useful for research on the influence of elevation on ecological processes such as vegetation growth, plant
composition, and soil biology. Beyond its utility in advancing such fundamental research, meteorological monitoring data contribute to informed socio-political decisions on climate
adaptation strategies, land management, and water resource planning, enhancing the safety and resilience of mountain communities and biodiversity. SIMILAR CONTENT BEING VIEWED BY OTHERS
HIGH-RESOLUTION GRIDS OF DAILY AIR TEMPERATURE FOR PERU - THE NEW PISCOT V1.2 DATASET Article Open access 01 December 2023 CLIMATE VARIABILITY AND WARMING IN COASTAL ODISHA: ASSESSING
INTERANNUAL TEMPERATURE TRENDS AND IMPACTS Article Open access 01 April 2025 HIGH-RESOLUTION TERRESTRIAL CLIMATE, BIOCLIMATE AND VEGETATION FOR THE LAST 120,000 YEARS Article Open access 14
July 2020 BACKGROUND & SUMMARY Mountains are particularly sensitive to climate change, as several studies have shown1,2,3. This sensitivity extends to the speed of climate shifts4 and
their impacts on both natural ecosystems5 and human societies6. However, climatic conditions in mountainous regions are subject to strong differences shaped not only by geomorphological
factors such as the elevation, slope, or aspect1 but also by biotic factors such as the vegetation cover or soil type7,8. This high variability of climatic conditions makes it difficult to
make general assumptions or to model and predict future changes4. Moreover, the systematic and long-term climatic monitoring of gradients within mountain ecosystems is rare4,7. Therefore,
the fine-scale observation of key variables along elevation gradients is essential for obtaining a better understanding of micrometeorological and mesoclimatic variability over short
distances7 and for assessing the impacts of climate change on mountain ecosystems using elevation as a climatic proxy9. With up to 20% of the world’s population living on mountains and their
foothills10, long-term meteorological measurements along elevation gradients may contribute to anticipating the impacts of climate change in such sensitive regions. Here, we present a
dataset of continuous climatic measurements, collected at five different elevations over a distance of less than 15 km. The dataset includes the following measurements: the air temperature,
relative humidity, wind speed and direction, solar radiation, soil temperature at 2, 5, and 20 cm depth, soil water content at 2, 5, and 20 cm depth, soil water potential at 5 and 20 cm
depth, precipitation, and snow height. These data provide a detailed picture of meso- and microclimatic conditions along a mountain elevation gradient in an inner-alpine dry valley in the
Italian Alps. The presented data were collected from 2017 to 2022 at the site Val Mazia – Matschertal within the framework of the European Long-Term Ecological Research (LTER) program, which
studies ecosystems and their dynamics over time in all possible spheres, including the atmosphere and hydrosphere11,12. Our six-year data set does not yet fulfil the temporal criteria to
serve as a climate change reference, however it is of interest for applications on other levels. In the field of climate research, a local dataset from a mountainous region is useful for the
bias correction of climate change simulations13 and the validation and downscaling of regional climate models and variables for complex terrain14. At a more local scale, observations along
an elevation gradient are essential to better understanding, measuring, and modelling atmospheric exchange processes over mountains15. The observations collected at the LTSER (Long-Term
Socio-Ecological Research) site Val Mazia – Matschertal have already been proven useful for analysing the small-scale environmental variations of bio-physical variables and eco-hydrological
processes associated with elevation8. In addition, this area serves as test site for validating catchment-scale hydrological models and processes16,17,18,19,20,21 or remote sensing products
in mountain environments22,23,24,25. Furthermore, the dataset can contribute to addressing more specific research questions on the influence of elevation on ecological processes such as
vegetation growth26,27,28, plant composition29,30, or biological soil processes31,32. More broadly, and for example in combination with data collected at neighbouring LTER sites such as in
Austria (e.g. Rofental33 or Obergurgl), our data allow for a detailed analysis of a meteorological profile across the main Alpine ridge and can provide relevant information for understanding
the climate-induced impacts in the Earth’s Critical Zone34,35 of mountain regions. By supporting future land management or water resource planning, risks to mountain communities can be
reduced and natural events such as landslides or avalanches, which are provoked by extreme weather conditions, can be better predicted36. This kind of action will make mountain communities
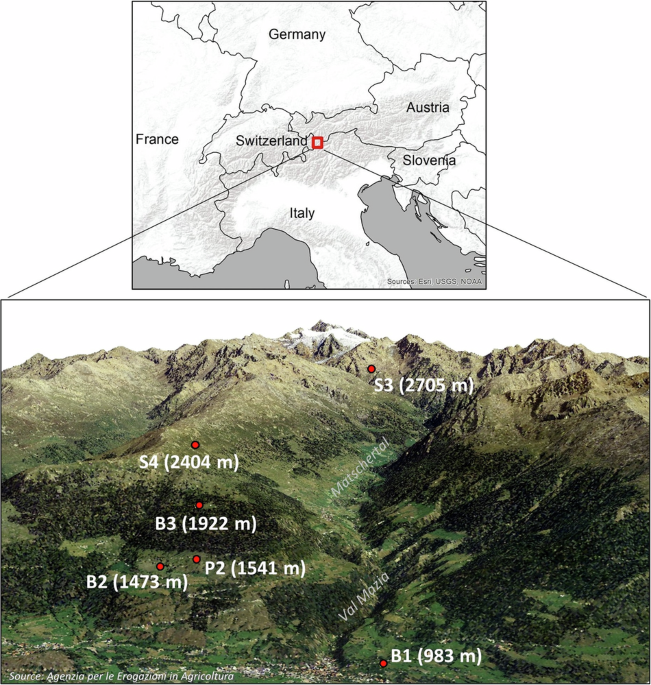
and the surrounding biodiversity safer and more resilient. METHODS STUDY AREA The data were collected within the LTSER site Val Mazia – Matschertal (Fig. 1)
(https://deims.org/11696de6-0ab9-4c94-a06b-7ce40f56c964), which is located in the province of Bolzano, South Tyrol, Italy (the northern boundary is located at latitude 46.766 N, the southern
boundary at 46.661 N, the western boundary at longitude 10.585 E, and the eastern boundary at 10.710 E). Detailed information and an overview of the area covered by our LTER site can be
found on the webpage: http://lter.eurac.edu/en. The data series were recorded by six climate stations in the Mazia – Matschertal Valley where 24 climate stations are distributed over 90 km2.
From this network of stations, we selected the five best-equipped stations in terms of the measurements presented, in order to be representative of an elevation transect of almost 2000 m
(spanning from 983 m a.s.l. to 2705 m a.s.l.) (Fig. 1) from the lower mountain zone to the high alpine zone. One of the selected stations (P2, 1541 m a.s.l.) was not equipped with a net
radiometer for solar radiation measurements and the rain gauge was installed only in July 2019. Hence, we included solar radiation measurements for the entire period and precipitation
measurements from 2017 to July 2019 from a station 450 m away (B2, 1473 m a.s.l.). From July 2019 on, precipitation data originate from station P2. The Mazia – Matschertal Valley is
characterised by inner-alpine continental climate conditions37,38. The average precipitation at 1922 m a.s.l. (climate station B3) is around 653 mm per year, with the maximum precipitation
occurring in summer. The yearly average temperature is 4.6 °C (2017–2022). LOCAL MESO- AND MICROCLIMATOLOGY We present here some examples of the potential use of the data to describe the
local climatology along a mountain elevation transect. The seasonal air temperature lapse rate (Fig. 2) ranges from −6.7 °C to −4.7 °C per 1000 m of elevation in spring and winter,
respectively. Data show a lower lapse rate in winter, which is related to the frequent thermal inversion conditions in the valley bottom. The same visualisation can be made with a less
frequently measured variable, such as the soil temperature at 20 cm depth, which is a key element in hydrothermal processes at the land-atmosphere boundary, linking the surface structure to
physical and biological soil processes37. Figure 3 shows that the soil temperature lapse rate is lower than the air temperature lapse rate, ranging from −5.5 °C to −1.7 °C per 1000 m of
elevation. During the winter season, there is less variability in the soil temperature because of the insulating effect of the snow and the energy exchange of soil freezing and melting
cycles. Only at stations above 2000 m a.s.l. is the soil permanently frozen in winter. The coldest temperatures were registered at station S4 (2400 m) during a phase of low snow cover and
not, as expected, at the higher station S3 (2700 m). In summer and especially in spring, however, the highest station, S3, is much colder than the other stations. The very low soil
temperature variability at S3 in spring can be explained by the thick snow cover that is still present at 2700 m. Indeed, the valley shows a strong elevational gradient in the snow height,
which is not linear with elevation. The average maximum snow height during the winter season ranges from 30 cm at 1000 m a.s.l. to more than 2 m at the highest station at 2700 m a.s.l. (Fig.
4). MONITORING STATIONS The six monitoring stations consist of steel structures, which are usually protected by a wooden fence, and an electrified fence to prevent wild and domestic animals
from entering the measurement area and damaging structures and equipment (Fig. 5). A box is mounted on the structure that houses the devices necessary for data acquisition and transmission,
as well as the power supply for the various components, which obtain power via a 12 V photovoltaic (PV) system. Topographical details, land cover and soil properties around each monitoring
station are given in Table 1. The acquisition system consists of a logger (Campbell Scientific CR1000/CR1000X) and an expansion module for the logger inputs (Campbell Scientific multiplexer
AM16/32B). The box also contains a 2 G modem or a 4 G router equipped with a machine-to-machine (M2M) SIM card for the transmission of data from the logger to the file server and, more
generally, for the remote monitoring and maintenance of the stations. Thanks to a dynamic domain name server (DDNS) service, it is also possible to remotely access and connect to the
stations. The modem/router is linked to an external omni-directional antenna, which can also be directional (Yagi antenna) for more remote stations where the mobile phone signal is
particularly poor. A 12 V/40 Ah battery is usually placed inside the box and connected to a 5 A charge regulator, which is in turn connected to one or two 30 Wp PV panels mounted outside:
this dimensioning, supported by careful in-house consumption management, guarantees autonomy of approximately one week in the event of prolonged bad weather. At some of the stations located
at high elevations, specifically B3 (1922 m a.s.l.) and S4 (2404 m a.s.l.), the rain gauges have been equipped with orifice rim heating. Each of these stations also has a 24 V PV power
supply system with a 10 A regulator and 4 × 100 Ah batteries housed in a dedicated box; this system is completed by a pair of 140 Wp PV panels. Table 2 describes in detail the equipment of
the stations in terms of the data acquisition system (excluding sensors), the transmission system, and the PV power supply systems. SENSOR EQUIPMENT AND VARIABLE COLLECTION Analogue and
digital sensors, as well as single and multi-parametric sensors, were used to collect the 15 variables (Table 3). In general, the dataset values are the result of averaging 15 records taken
every minute and aggregating them into a single value stored in the logger, which is then transferred to our internal file server. However, there are exceptions to this process:
precipitation is recorded as the total amount of precipitation, and for the snow height, only the last of the 15 records is stored to minimise the impact of outliers. Although we have tried
to keep the measurement setups as similar as possible, there are some differences between the monitoring stations (indicated in Table 3). An overview of the sensors is given in Table 4,
where their model and brand and the measured variables, including the measurement range and accuracy, are listed. Throughout the six years of data collection, data gaps due to sensor failure
(including data loss due to maintenance interventions) amounted to 2% of the dataset. Various circumstances have required the replacement of singular sensors or more involved maintenance
work. We highlight two of those cases, one due to anomalies being detected and the other due to data quality improvement. In the case of temperature and humidity measurements, for which we
initially relied on Rotronic mod. HC2S3 thermo-hygrometers, we noticed that after a few years of operation, anomalous peaks had appeared in the temperature measurements of all the installed
sensors. After a more detailed analysis of the data series, we found that in addition to these peaks, the measurements taken over the following weeks were also noisy and unreliable. After
replacing these sensors with the Vaisala HMP155 model, we no longer experienced this anomaly. With the aim of improving the data quality of the variable precipitation, we upgraded the
weight-based rain gauges (mod. Pluvio2, made by Ott) at two stations, B3 and S4, which are located at elevations of 1922 and 2404 m a.s.l., respectively. The heating of the orifice rim of
the rain gauge bucket was added in order to minimise the underestimation of solid precipitation, which in certain cases can remain attached to the rim. In addition, we improved the stations’
own data acquisition scripts to allow them to identify solid precipitation events with high accuracy, using an approach developed by Mair _et al_.39. This approach automatically activates
the heater on demand, optimising energy consumption and ensuring that the heater operates throughout the winter. To improve the performance of the rain gauges, wind shields were also
installed at the windiest stations, which are P2 (1541 m a.s.l.) and S4. The complete sensor history for each monitoring station can be found in Tables 5–10, which also include the operating
periods and the upgrades made to each station. DATA WORKFLOW The entire workflow, from data acquisition in the field to the transmission to our internal file server, database feeding, data
download via web, and data visualisation using customised dashboards, is shown in Fig. 6 and further described by Palma _et al_.40. Integrated into the flow, a monitoring system performs two
basic functions: checking the status of stations and sensors and alerting the system managers via email if there are malfunctions and performing preliminary data quality checks. The
workflow consists of different, mainly open-source components and has been merged and integrated in-house. All variables are stored locally in the measurement station logger memory; then,
they are transferred to a file server on an hourly basis. Also on an hourly basis, these transferred data are checked and then stored in our time series database, which is based on InfluxDB
(https://www.influxdata.com). At this point, the data are available for internal and external users. Data accessibility is ensured in three different ways: i) Grafana
(https://dashboard.alpenv.eurac.edu), an open-source application in which we have created a large number of dashboards that allow the data to be quickly visualized through graphs and allow
the trends in the data to be analysed, where several measurements can be correlated in a single panel; ii) Mazia|Matsch Data Browser (https://browser.lter.eurac.edu40), a user-friendly web
application developed in-house (with the Go language) that allows one to filter and download raw real-time data that have not been validated; and iii) in the Data Browser, there is a
function that allows the direct generation of code templates in the R and Python languages, transforming the choices made by the users in the site menus into a query to download the data by
running these scripts. DATA RECORDS We produced one data file for each measured variable (15 in total) and two metadata files, which are stored and accessible in the Pangaea repository
(https://doi.org/10.1594/PANGAEA.96470041). METADATA FILES The first metadata file is an Excel file that provides an overview of the measurement areas, the equipment of the stations, the
sensor history, and the 15 recorded variables. The second metadata file is a pdf document that introduces the script used to perform quality control on raw data (DQC) and describes in detail
the structure and content of the files generated by the script. DATA FILES For each of the 15 measurements, we provide a singular data file that includes raw data, as well as corrected and
commented (elaborated) time series. The file structure and the headers used are in line with the standards of the Pangaea repository. Each data file consists of seven columns (Table 11),
which provide the ‘Date/Time’ stamp (according to ISO 8601), the ‘Event’ indicating the name of the station, and the two geographic coordinates ‘latitude’ and ‘longitude’, which are followed
by the raw value of the measurement (‘Variable abbreviation name [_unit_] (raw)’) and the elaborated variable value (‘Variable abbreviation name [_unit_]’). The first four headers are the
same for all 15 data files, while the headers of columns 5 and 6 show the abbreviated name of the specific measurement, followed by the unit of measurement in square brackets and, in the
case of column 5, the word ‘raw’ in round brackets to distinguish the original raw value from the elaborated value in column 6. The last column contains the tags set for the data quality
check. A detailed description of the R script and the possible tags and associated actions that can be performed on the data can be found in the ‘Technical Validation’ section. Missing data
are indicated with ‘NA’ (Not Available) and can be caused by a data gap that is already present in the raw data and therefore reported in the elaborated data, or by the filtering performed
by the DQC script, which may have detected inadmissible data for the reasons listed and described in detail in the ‘Technical Validation’ section. Each data file contains the time series of
processed data related to six years of measurements, for a total of over 210k values; the size of each file exceeds 50 MB, for a total dataset volume of almost 1 GB. TECHNICAL VALIDATION
DATA QUALITY CHECK The monitoring system (see Fig. 6), in addition to the alerting action, performs an automatic, basic check on an hourly basis on the data transmitted by the stations,
creating the raw time series; it ensures the integrity of the data structure and the contents of the datasets. In the case of data overlaps or invalid character detection, it alerts the data
manager, requesting a manual intervention. To validate the datasets in more depth, a DQC script was developed that is able to process the raw time series. The DQC script is fed by a
variable-specific instruction file that is created manually and reports anomalous events and the action to be taken in each case. The instruction file contains the following columns: the
‘measurement station’, ‘start date’, and ‘end date’ of the event and the ‘event description’ and ‘value’ related to the event (the value is usually a threshold, an offset, etc.). The DQC
script analyses each value of the raw time series and assigns a qualifying tag (associated with the instruction file) to each value; this is useful for any subsequent filtering. Depending on
the tag assigned, the raw data undergo a transformation and, as a result, a new, elaborated time series is generated in the output. DATA QUALITY TAGS The tags contained in column 7 of the
data files are described, along with the associated filters, in Table 12. The tags ‘_OK_’ and ‘_DATA GAP_’ do not require any external instructions, since the DQC script manages both
automatically. ‘_WRONG_’ and ‘_UNRELIABLE_’ tags are assigned to anomalous values present in the raw time series, adopting the time intervals detected and listed in the instruction file.
Usually, these periods coincide with maintenance interventions or sensor failures. If data are definitely unrecoverable (e.g. in the case of data collection in the absence of the sensor),
then these data will be tagged as ‘Wrong’ and the script will replace these data with ‘NA’ in the elaborated time series; otherwise, the data will be left unchanged but tagged with
‘unreliable’ to permit the future exclusion of these values. The tags from rows 5 to 10 in Table 12 apply thresholds and sub-thresholds, which are necessary for the script to determine the
action to apply to the raw data; Table 13 shows the list of thresholds used to eliminate or fix the outliers. Whereas almost all thresholds in the table coincide with the operative limit of
the sensors, in the case of the air temperature and wind speed, the thresholds have been restricted as much as possible around the extreme and, at the same time, admissible values recorded
by the stations from the day of installation to the current day: this is to maximise the effectiveness of the outlier filter. The ‘_LOWER_MIN_’ and ‘_UPPER_MAX_’ tags indicate that values
that exceeded the respective thresholds have been replaced with ‘NA’. In some cases, it has been necessary to introduce sub-thresholds, which replace values that are only slightly outside of
the norm, such as measurements of negative solar radiation during the night or relative humidity measurements that are above saturation. Two specific tags that have been developed for the
variables precipitation (tag ‘irrigation’) and snow height (tag ‘offset’) are briefly presented below. ‘IRRIGATION’ TAG FOR PRECIPITATION Two of the six measurement stations, B1 (983 m
a.s.l.) and B2 (1473 m a.s.l.), collected precipitation data measured by rain gauges that were hit by the artificial irrigation of the surrounding meadow. Contrary to natural precipitation,
irrigation occurs quite regularly, in terms of both the frequency and amplitude. Hence, we were able to identify each irrigation event by visually comparing both irrigated stations with the
neighbouring stations, and then the instruction file was compiled with these irrigation periods. ‘OFFSET’ TAG FOR SNOW HEIGHT The readings of ultrasonic distance sensors are highly
influenced by changes in the station setup and by the vegetation growth below the station. This effect is especially pronounced in remote environments, where damage due to snow accumulation,
wildlife interactions, and strong winds can significantly impact the station stability. In particular, displacements of the station structures and maintenance work might lead to sensor
height changes. Consequently, our data quality check strategy incorporates specific offset adjustments, which are reported in our maintenance logbook for snow height measurements. After such
deviations were manually detected, they were listed in the instruction file related to the snow height measurement. During DQC, a specific sequence of steps was followed. Initially, values
surpassing the sensor height were excluded (‘upper_max’ values), with one or two upper limits set for each station (Table 13). Subsequently, the eventual offset was applied to the raw snow
height measurements. The script applied either a constant offset or a dynamic offset, which is calculated in a linear increasing (or decreasing) manner, starting from the first value and
going to the last value belonging to the affected period. After offset implementation, values lower than −0.02 m were removed (‘lower_min’). This threshold is comparable to the sensor’s
measuring error of ±0.01 m. This step followed the application of the offset to prevent the unintentional removal of measurements falling below the threshold, considering that these values
have not been adjusted for the offset at that point. DATA COMPLETENESS Some areas of the LTSER site Val Mazia – Matschertal are rather difficult to reach, and the two highest monitoring
stations cannot be physically accessed throughout the whole year (i.e. the winter period), so that any failure in either the transmission system or PV system, or failures related to a
sensor, can lead to data loss. Nevertheless, the total data gaps due to sensor failure over the entire six-year period make up 2.0% of the dataset. Additionally, data gaps related to the
absence of a sensor for a certain period or for the whole period of the dataset make up 6.0% of the dataset, so that the overall completeness of the dataset is 92.0% (Fig. 7). Thus, most of
the missing data can be attributed to measurements that, at certain stations, were never performed or at least were not performed for long periods. For example, the measurement of short-wave
radiation started in 2019 for station B3 (1922 m a.s.l.), and short-wave radiation measurements were never taken at station B1 (983 m a.s.l.). Precipitation was never measured at station S3
due to its elevation of 2705 m a.s.l. (requiring a heated rain gauge and consequently a robust power supply), and the snow height was not collected at P2 (1541 m a.s.l.). The collection of
the soil water potential at 5 and 20 cm depth at P2 (1541 m a.s.l.) started in 2019. Concerning anomalous measurements, the snow height is a sensitive variable, and data are often lost
during normal sensor functioning. For example, during a snowfall event, the falling snowflakes will cross the beam of the ultrasonic device and interfere with the measurements; additionally,
in the presence of vegetation, as the vegetation grows, the target becomes more and more inhomogeneous and difficult to measure. An algorithm has recently been added to the stations’ own
data acquisition script that can reduce the data loss while providing more accurate measurements: instead of the last sample, the median value of the 15 samples is logged. The air
temperature and relative humidity datasets are in large parts complete for all five stations, even with the anomaly that affected some thermo-hygrometers, as explained in the ‘Methods’
section. USAGE NOTES The meteorological time series presented in this paper can be accessed through Pangaea (https://doi.org/10.1594/PANGAEA.96470041). The data are clean and can be used as
is; gaps are not filled. In Pangea the data files of the 15 variables are aggregated in 8 timeseries: air temperature and relative humidity, wind speed and direction, solar radiation, soil
temperature (at 2, 5, and 20 cm depth), soil water content (at 2, 5, and 20 cm depth), soil water potential (at 5 and 20 cm depth), precipitation, and snow height. Both timestamps are
provided, UTC and UTC + 1 (local time). The LTSER site Val Mazia – Matschertal runs other climate stations and collects additional measurements (raw data that have not been validated), which
are freely available in near-real time (acknowledging our work) from our Data Browser (https://browser.lter.eurac.edu40) and can be visualised using a Grafana dashboard
(https://dashboard.alpenv.eurac.edu). CODE AVAILABILITY The codes, written in the R language and used for our monitoring system (https://gitlab.inf.unibz.it/alpenv/Station_Monitoring_System)
(R version 3.6.0) and the DQC script (https://gitlab.inf.unibz.it/alpenv/ltser_datapaper) (R version 4.2.2), are freely available on the collaborative platform Gitlab. Furthermore, the DQC
script is also provided with a DOI and persistently stored in Zenodo (https://zenodo.org/records/10255852). REFERENCES * Beniston, M. Mountain weather and climate: a general overview and a
focus on climatic change in the Alps. _Hydrobiologia_ 562, 3–16 (2006). Article Google Scholar * Rangwala, I. & Miller, J. R. Climate change in mountains: a review of
elevation-dependent warming and its possible causes. _Climatic Change_ 114, 527–547 (2012). Article ADS Google Scholar * Terzi, S. _et al_. Multi-risk assessment in mountain regions: a
review of modelling approaches for climate change adaptation. _Journal of Environmental Management_ 232, 759–771 (2019). Article PubMed ADS Google Scholar * Pepin, N. C. _et al_. Climate
changes and their elevational patterns in the mountains of the world. _Reviews of Geophysics_ 60(1) (2022). * Reyer, C. _et al_. A plant’s perspective of extremes: terrestrial plant
responses to changing climatic variability. _Global Change Biology_ 19, 75–89 (2012). Article PubMed ADS Google Scholar * Immerzeel, W. W. _et al_. Importance and vulnerability of the
world’s water towers. _Nature_ 577(7790), 364–369 (2020). Article CAS PubMed Google Scholar * Strachan, S. _et al_. Filling the data gaps in mountain climate observatories through
advanced technology, refined instrument siting, and a focus on gradients. _Mountain Research and Development_ 36(4), 518–527 (2016). Article Google Scholar * Della Chiesa, S. _et al_.
Modelling changes in grassland hydrological cycling along an elevational gradient in the Alps. _Ecohydrology_ 7(6), 1453–1473 (2014). Article Google Scholar * Becker, A., Körner, C., Brun,
J. J., Guisan, A. & Tappeiner, U. Ecological and land use studies along elevational gradients. _Mountain Research and Development_ 27(1), 58–65 (2007). Article Google Scholar *
Locatelli, B., Lavorel, S., Sloan, S., Tappeiner, U. & Geneletti, D. Characteristic trajectories of ecosystem services in mountains. _Frontiers in Ecology and the Environment_ 15(3),
150–159 (2017). Article Google Scholar * Mollenhauer, H. _et al_. Long-term environmental monitoring infrastructures in Europe: observations, measurements, scales, and socio-ecological
representativeness. _Science of the Total Environment_ 624, 968–978 (2018). Article CAS PubMed ADS Google Scholar * Körner, C. _et al_. Long-term monitoring of high-elevation
terrestrial and aquatic ecosystems in the Alps–a five-year synthesis. _Journal on Protected Mountain Areas Research and Management_ 14, 48–69 (2022). Google Scholar * Maraun, D. Bias
correcting climate change simulations - a critical review. _Curr. Clim. Change Rep._ 2, 211–220 (2016). Article Google Scholar * Lembrechts, J. J. _et al_. Global maps of soil temperature.
_Global Change Biology_ 28(9), 3110–3144 (2022). Article CAS PubMed PubMed Central Google Scholar * Rotach, M. W. _et al_. Collaborative effort to better understand, measure, and model
atmospheric exchange processes over mountains. _Bulletin of the American Meteorological Society_ 103(5), E1282–E1295 (2022). Article Google Scholar * Bertoldi, G. _et al_. Estimation of
soil moisture patterns in mountain grasslands by means of SAR RADARSAT2 images and hydrological modeling. _Journal of Hydrology_ 516, 245–257 (2014). Article ADS Google Scholar * Penna,
D. _et al_. Tracer-based analysis of spatial and temporal variation of water sources in a glacierized catchment. _Hydrology and Earth System Sciences Discussions_ 11, 4879–4924 (2014). ADS
Google Scholar * Engel, M. _et al_. Identifying run-off contributions during melt-induced run-off events in a glacierized alpine catchment. _Hydrological Processes_ 30, 343–364 (2016).
Article ADS Google Scholar * Wohlfahrt, G. _et al_. On the energy balance closure and net radiation in complex terrain. _Agricultural and Forest Meteorology_ 226-227, 37–49 (2016).
Article PubMed PubMed Central Google Scholar * Engel, M., Notarnicola, C., Endrizzi, S. & Bertoldi, G. Snow model sensitivity analysis to understand spatial and temporal snow
dynamics in a high-elevation catchment. _Hydrological Processes_ 31(23), 4151–4168 (2017). Article ADS Google Scholar * Penna, D., Engel, M., Bertoldi, G. & Comiti, F. Towards a
tracer-based conceptualization of meltwater dynamics and streamflow response in a glacierized catchment. _Hydrology and Earth System Sciences_ 21, 23–41 (2017). Article ADS Google Scholar
* Greifeneder, F., Notarnicola, C., Bertoldi, G., Niedrist, G. & Wagner, W. From point to pixel scale: an upscaling approach for _in-situ_ soil moisture measurements. _Vadose Zone
Journal_ 15(6) (2016). * Colliander, A. _et al_. Validation of SMAP surface soil moisture products with core validation sites. _Remote Sensing of Environment_ 191, 215–231 (2017). Article
ADS Google Scholar * Castelli, M. _et al_. Two-source energy balance modeling of evapotranspiration in Alpine grasslands. _Remote Sensing of Environment_ 209, 327–342 (2018). Article ADS
Google Scholar * Rossi, M. _et al_. A comparison of the signal from diverse optical sensors for monitoring alpine grassland dynamics. _Remote Sensing_ 11, 296 (2019). Article ADS Google
Scholar * Niedrist, G. _et al_. Down to future: transplanted mountain meadows react with increasing phytomass or shifting species composition. _Flora_ 224, 172–182 (2016). Article Google
Scholar * Obojes, N. _et al_. Water stress limits transpiration and growth of European larch up to the lower subalpine belt in an inner-alpine dry valley. _New Phytologist_ 220(2), 460–475
(2018). Article PubMed Google Scholar * Obojes, N. _et al_. Swiss stone pine growth benefits less from recent warming than European larch at a dry-inner alpine forest line as it reacts
more sensitive to humidity. _Agric. For. Meteorol._ 315, 108788 (2022). Article Google Scholar * Fontana, V. _et al_. Decomposing the land-use specific response of plant functional traits
along environmental gradients. _Science of The Total Environment_ 599, 750–759 (2017). Article PubMed ADS Google Scholar * Crepaz, H., Niedrist, G., Wessely, J., Rossi, M. &
Dullinger, S. Resident vegetation modifies climate-driven elevational shift of a mountain sedge. _Alp Botany_ 131, 13–25 (2021). Article Google Scholar * Steinwandter, M., Schlick-Steiner,
B. C., Seeber, G. U. H., Steiner, F. M. & Seeber, J. Effects of alpine land-use changes: soil macrofauna community revisited. _Ecology and Evolution_ 7(14), 5389–5399 (2017). Article
PubMed PubMed Central Google Scholar * Seeber, J. _et al_. Soil invertebrate abundance, diversity, and community composition across steep high elevation snowmelt gradients in the European
Alps. _Arctic, Antarctic, and Alpine Research_ 53(1), 288–299 (2021). Article ADS Google Scholar * Strasser, U. _et al_. The Rofental: a high Alpine research basin (1890–3770 m a.s.l.)
in the Ötztal Alps (Austria) with over 150 years of hydrometeorological and glaciological observations. _Earth Syst. Sci. Data_ 10, 151–171 (2018). Article ADS Google Scholar * Marta, S.
_et al_. Heterogeneous changes of soil microclimate in high mountains and glacier forelands. _Nat. Commun._ 14, 5306 (2023). Article CAS PubMed PubMed Central ADS Google Scholar * Lin,
H. Earth’s Critical Zone and hydropedology: concepts, characteristics, and advances. _Hydrol. Earth Syst. Sci._ 14, 25–45 (2010). Article ADS Google Scholar * IPCC, 2022: Climate Change
2022: Impacts, Adaptation and Vulnerability. Contribution of Working Group II to the Sixth Assessment Report of the Intergovernmental Panel on Climate Change [H.-O. Pörtner, _et al_.
(eds.)]. Cambridge University Press. Cambridge University Press, Cambridge, UK and New York, NY, USA, 3056 pp., https://doi.org/10.1017/9781009325844. * Rechenmacher, R. _Matsch – Ein
Vinschgauer Hochtal im Wandel der Zeit. Diploma thesis. University of Innsbruck_ (1986). * Grünberg, I., Wilcox, E. J., Zwieback, S., Marsh, P. & Boike, J. Linking tundra vegetation,
snow, soil temperature, and permafrost. _Biogeosciences_ 17, 4261–4279 (2020). Article ADS Google Scholar * Mair, E. _et al_. A simple method to combine snow height and meteorological
observations to estimate winter precipitation at sub-daily resolution. _Hydrological Sciences Journal_ 61(11), 2050–2060 (2016). Article Google Scholar * Palma, M. _et al_. Data Browser
Matsch | Mazia: web application to access microclimatic time series of an ecological research site. _Research Ideas and Outcomes_ 7 (2021). * Zandonai, A. _et al_. Six years of
micro-climatic time series along an elevational transect in the Italian Alps [dataset bundled publication]. _PANGAEA_ https://doi.org/10.1594/PANGAEA.964700 (2024). Download references
ACKNOWLEDGEMENTS We are grateful to the municipality of Mals/Malles, the village community of Matsch/Mazia, and all the farmers who allowed us to work on their properties. We thank Stefano
Della Chiesa and Christian Brida, who worked for many years on the dataset production, and Luca Cattani and Martin Palma from the Eurac ICT department for developing our in-house workflow.
We thank Thomas Marsoner for creating the map of our study area. This study was conducted at the LTSER site LTER_EU_IT_097—Val Mazia/Matschertal, a member of the national and international
long-term ecological research networks (LTER-Italy, LTER Europe, and ILTER). The presented work was made possible by the funding of the Province of Bozen/Bolzano—South Tyrol for the LTSER
site. AUTHOR INFORMATION Author notes * These authors contributed equally: Alessandro Zandonai, Veronika Fontana. AUTHORS AND AFFILIATIONS * Institute for Alpine Environment, Eurac Research,
viale Druso 1, 39100, Bolzano, Italy Alessandro Zandonai, Veronika Fontana, Johannes Klotz, Giacomo Bertoldi, Harald Crepaz, Ulrike Tappeiner & Georg Niedrist * Department of Ecology,
University of Innsbruck, Sternwartestr. 15, 6020, Innsbruck, Austria Harald Crepaz & Ulrike Tappeiner Authors * Alessandro Zandonai View author publications You can also search for this
author inPubMed Google Scholar * Veronika Fontana View author publications You can also search for this author inPubMed Google Scholar * Johannes Klotz View author publications You can also
search for this author inPubMed Google Scholar * Giacomo Bertoldi View author publications You can also search for this author inPubMed Google Scholar * Harald Crepaz View author
publications You can also search for this author inPubMed Google Scholar * Ulrike Tappeiner View author publications You can also search for this author inPubMed Google Scholar * Georg
Niedrist View author publications You can also search for this author inPubMed Google Scholar CONTRIBUTIONS A. Zandonai coordinated and produced the dataset, performed the storage of the
data and codes, designed the tables, and wrote the original draft. V. Fontana co-wrote the original draft and coordinated the storage of the data and the writing of the article. J. Klotz
co-produced the dataset, carried out the technical validation of several of the variables, and designed the figures. G. Bertoldi co-produced the dataset and contributed to data processing.
H. Crepaz carried out the technical validation of a set of variables. U. Tappeiner is the principal investigator of the LTSER Val Mazia – Matschertal project. G. Niedrist is the technical
coordinator of the LTSER Val Mazia – Matschertal project and supervised all phases of dataset construction and article writing. Each author contributed to the conceptualisation and writing
of the article and provided guidance on the final state of the dataset. CORRESPONDING AUTHOR Correspondence to Alessandro Zandonai. ETHICS DECLARATIONS COMPETING INTERESTS The authors
declare no competing interests. ADDITIONAL INFORMATION PUBLISHER’S NOTE Springer Nature remains neutral with regard to jurisdictional claims in published maps and institutional affiliations.
RIGHTS AND PERMISSIONS OPEN ACCESS This article is licensed under a Creative Commons Attribution 4.0 International License, which permits use, sharing, adaptation, distribution and
reproduction in any medium or format, as long as you give appropriate credit to the original author(s) and the source, provide a link to the Creative Commons licence, and indicate if changes
were made. The images or other third party material in this article are included in the article’s Creative Commons licence, unless indicated otherwise in a credit line to the material. If
material is not included in the article’s Creative Commons licence and your intended use is not permitted by statutory regulation or exceeds the permitted use, you will need to obtain
permission directly from the copyright holder. To view a copy of this licence, visit http://creativecommons.org/licenses/by/4.0/. Reprints and permissions ABOUT THIS ARTICLE CITE THIS
ARTICLE Zandonai, A., Fontana, V., Klotz, J. _et al._ Six years of high-resolution climatic data collected along an elevation gradient in the Italian Alps. _Sci Data_ 11, 751 (2024).
https://doi.org/10.1038/s41597-024-03580-x Download citation * Received: 03 October 2023 * Accepted: 27 June 2024 * Published: 10 July 2024 * DOI: https://doi.org/10.1038/s41597-024-03580-x
SHARE THIS ARTICLE Anyone you share the following link with will be able to read this content: Get shareable link Sorry, a shareable link is not currently available for this article. Copy to
clipboard Provided by the Springer Nature SharedIt content-sharing initiative