The opto-locomotor reflex as a tool to measure sensitivity to moving random dot patterns in mice
- Select a language for the TTS:
- UK English Female
- UK English Male
- US English Female
- US English Male
- Australian Female
- Australian Male
- Language selected: (auto detect) - EN
Play all audios:

ABSTRACT We designed a method to quantify mice visual function by measuring reflexive opto-locomotor responses. Mice were placed on a Styrofoam ball at the center of a large dome on the
inside of which we projected moving random dot patterns. Because we fixed the heads of the mice in space and the ball was floating on pressurized air, locomotion of the mice was translated
to rotation of the ball, which we registered. Sudden onsets of rightward or leftward moving patterns caused the mice to reflexively change their running direction. We quantified the
opto-locomotor responses to different pattern speeds, luminance contrasts, and dot sizes. We show that the method is fast and reliable and the magnitude of the reflex is stable within
sessions. We conclude that this opto-locomotor reflex method is suitable to quantify visual function in mice. SIMILAR CONTENT BEING VIEWED BY OTHERS VISUAL MOTION INTEGRATION OF
BIDIRECTIONAL TRANSPARENT MOTION IN MOUSE OPTO-LOCOMOTOR REFLEXES Article Open access 18 May 2021 SPONTANEOUS BEHAVIOUR IS STRUCTURED BY REINFORCEMENT WITHOUT EXPLICIT REWARD Article Open
access 18 January 2023 NEURAL REPRESENTATION OF SELF-INITIATED LOCOMOTION IN THE SECONDARY MOTOR CORTEX OF MICE ACROSS DIFFERENT ENVIRONMENTAL CONTEXTS Article Open access 10 May 2025
INTRODUCTION In recent years, mice have become an important animal model for studies on visual processing. Although mice rely much less on vision than primates, their visual system largely
resembles that of higher mammals1,2,3,4. Moreover, mice offer unique opportunities to study the functional circuitry of vision. For example, through the invention of genetically encoded
calcium current and voltage indicators it is possible to record in parallel the activity of hundreds of neurons in cortex in the behaving mouse5,6,7,8,9,10. The activity of large groups of
neurons can be altered by applying optogenetics11,12,13,14 or activated by designer drugs15,16. These neurophysiological techniques offer the opportunity to directly relate neuronal function
in retina and visual cortex to visually driven behaviour2,17,18,19,20. For this purpose, suitable tests of visual function are needed. Over the years many behavioural tests for mouse visual
function have been developed21,22,23. Visual function in mice is traditionally tested with simple behavioural paradigms based on reflexes, such as the eye blink reflex, the pupil light
response21,24, light-dark transition test25 and optokinetic reflexive responses of the eye or the head to large moving patterns26,27,28,29. These reflexes are thought to rely on the
retino-tectal pathway, which is strongly developed in the mouse30,31,32. Higher perceptual facilities (pattern, depth, orientation) are thought to rely more on retino-cortical pathways.
Examples of tests that probe these are the visual cliff test33 and modified Morris water maze tests34,35,36,37. Many recent studies of mouse visual perception rely on fixating the head in
space. This has the advantage of increased control over the visual stimulation and it provides the stability that is typically required in neural techniques such as two-photon calcium
imaging20,38,39 and single unit or patch-clamp recording40,41. Perceptual tasks that head-fixed mice perform concurrently with these neurophysiological assays typically involve licking
responses or lever presses to visual stimuli according to specific, trained rules of varying complexity21,40,42,43,44,45,46,47. The purpose of this study is to test a method we developed
that leverages the opto-locomotor reflex (OLR) in a head-fixed paradigm. This reflex effectively stabilises whole-scene motion by cancelling it with a body orienting movement of the same
magnitude46,47,48,49,50. In this study, we fixed mice with their heads over the center of a spherical, 2D treadmill. All mice spontaneously started running forward. The treadmill was located
at the center of a 112 cm dome on the inside of which we projected moving random dot patterns. The presentation of rightward or leftward moving patterns caused the mice to reflexively
change their running direction. We quantified the OLR by recording the rotation of the treadmill along the vertical axis. Because this measure is based on reflexive behaviour, it should not
require lengthy training like other perceptual assays might. Our first aim is to assess the sensitivity of the OLR to the stimulus parameters speed, contrast, and dot size. Fixating the
heads of the mice provides increased control over the visual stimulation and maximises stability. However, it also eliminates the compensating effect of the OLR on the visual input, as the
head remains stable in space while the OLR is transferred to the treadmill. Our second aim is to establish whether or not this causes the reflex to extinguish over time. RESULTS After one
week of habituation to the set-up, the experimental measurements began. In the first experiment the dots moved left or right at one of 9 speeds between 0 and 72 deg/s. These conditions were
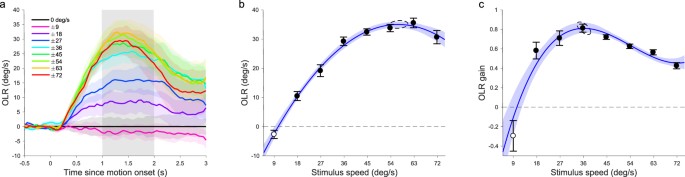
presented in a randomly interleaved block design. The contrast was held constant at 0.68 and the dot radius was 1.4 degrees. Figure 1a shows the 6-mouse mean, baseline-corrected, OLR-traces
over time. Baseline-corrected OLR-traces were calculated, per mouse, by subtracting the zero-speed curve from all its other curves and taking the mean of the pairs of curves observed for
equal magnitude rightward and leftward motion, after multiplying the latter by minus one. When the dots were moving in one direction the animals reacted, on average, by attempting to turn in
the same direction, making the treadmill turn (yaw) the opposite way. The peak amplitude of the OLR-traces varied across individual animals, with an almost threefold difference in reflex
amplitude between the weakest and the strongest responder. This is reflected in the width of the shaded error bands which represent standard error (Fig. 1a). To summarise the OLR-traces with
a single number, we defined OLR as the mean baseline-corrected yaw (in deg/s) observed between 1 and 2 seconds after motion onset. Figure 1b shows the dependence of the 6-mouse mean OLR on
stimulus speed. Higher stimulus speeds evoked greater OLR, but the rise in the OLR attenuated above 36 deg/s and dipped slightly at the highest speed (72 deg/s). To prevent mice with the
largest responses from dominating the means, we z-scored the individual OLR-vs-speed curves and scaled them back by multiplication with the standard deviation (SD) of the population and
addition of the population mean. This normalization step was performed in all the analyses described in this study. We used Matlab’s fit function to optimize a quadratic polynomial to the
mean OLRs in the linear least square sense, linearly weighted by the inverse of the standard errors (R2 = 0.99). F-tests revealed that this gave a significantly better fit than a line
(F(1,5) = 248.7, p < 10−4) and that a cubic polynomial was excessive (F(1,4) = 0.005, p = 0.95). To determine the speed that evoked the strongest OLR with 95%-confidence intervals (CI) we
used a resampling method. We fitted quadratic polynomials to 200 random samples (with replacement) from the 48 data points (6 mice × 8 speeds). On average, they peaked at a stimulus speed
of 57.2 deg/s (SD 1.47) reaching an OLR of 35.0 deg/s (SD 0.55). To gain insight in how well the mice followed the stimulus motion and would have compensated for it had they not been
head-fixed, we expressed the response as an OLR gain. That is, the OLR divided by the speed of the stimulus used to evoke it (Fig. 1c). This relation was best characterized by a cubic
polynomial (R2 = 0.92; quadratic vs cubic: F(1,4) = 10.96, p = 0.029; cubic vs quartic: F(1,3) = 9.68, p = 0.053). Interpolation of this curve revealed that the mice tracked the stimulus
motion most closely when it moved at 36.4 deg/s (SD 1.07) by turning the ball at 29.5 deg/s in the opposite direction. In other words, they reached a gain of 0.81 (SD 0.02). In the second
experiment, we manipulated the Michelson contrast of the dots (0.09, 0.37, 0.68, 0.89, 0.95) and varied their speed (18, 36, 54, 72 deg/s). The dot radius was again held constant at 1.4
degrees. Figure 2a shows mean OLR (n = 6) as a function of the contrast of the dots plotted for each stimulus speed in different colors. As expected, OLR increased with increasing contrast.
However, OLR dipped slightly at the highest contrasts used (0.95). To quantify these results, we fitted the mean OLRs with a polynomial surface function of contrast and speed, linearly
weighted by the inverse standard errors. We found that a 9-parameter polynomial that was quadratic for contrast and cubic for speed (poly23 for short) fitted the data well (R2 = 0.96).
F-tests revealed that this model was significantly better than the simpler, 6-parameter biquadratic alternative (poly22 vs poly23: F(3,11) = 4.70, p = 0.024) and that the addition of more
parameters was not warranted (poly23 vs poly33: F(1,10) = 0.70, p = 0.42). The position of the peak of the surface corresponds to the contrast and speed that evoked the strongest OLR (Fig.
2b). We used resampling to obtain these values with 95%-CI. The mean of the 200 surfaces fit to the resampled data is shown as a contour plot in Fig. 2b. The optimal contrast was 0.76 (SD
0.05) and the optimal speed 42.5. deg/s (SD 3.23). We analyzed in a similar fashion the effects of speed and contrast on the OLR gain. These data (Fig. 2c) were also best described by poly23
(poly22 vs poly23: F(3,11) = 7.08, p = 0.006; poly23 vs poly33: F(1,10) = 2.46, p = 0.15). We found that the highest OLR gain (1.13, SD 0.05) occurred at a contrast of 0.71 (SD 0.05) and a
speed of 29.6 deg/s (SD 1.4) as indicated in Fig. 2d. In Experiment 3, we tested whether there was an effect of dot size on OLR. Figure 3a shows the mean OLR (n = 6) to stimuli with one of
six dot radii (0.6, 0.9, 1.4, 2.3, 3.7 deg) and one of four speeds (18, 36, 54, 72 deg/s). We found that OLR is almost linearly related to dot size at 18 deg/s, the lowest speed used. For
the higher speeds, we found an inverted U-shape relation between OLR and dot size with the optimum around 2 degrees radius. These data were best described with a 9-parameter polynomial that
was cubic for dot size and quadratric for speed (poly32, R2 = 0.99; poly22 vs poly32: F(3,11) = 7.09, p = 0.006; poly32 vs poly33: F(1,10) = 0.78, p = 0.40). The strongest OLR was evoked by
dots with a radius of 2.30 deg (SD 0.17) that moved at 63.8 deg/s (SD 3.1). Figure 3c depicts the effects of dot size and speed on OLR gain. The best model for these data was poly23 (R2 =
0.96; poly22 vs poly23: F(3,11) = 12.2, p < 10−4; poly23 vs poly33: F(1,10) = 1.60, p = 0.23). This analysis revealed that the mice most accurately followed motion stimuli with a dot
radius of 2.96 deg (SD 0.31) and a speed of 31.9 deg/s (SD 2.89), reaching a gain of 0.72 (SD 0.04). Finally, we examined the consistency of the behavioural measurements. We did this by
re-analysing the data of Experiment 1 (Effect of speed; Fig. 1) in two ways. First, we compared OLRs measured in the first half of the 40-minute sessions to those observed in the second half
(Fig. 4a). There was no difference between the OLRs of the early and late halves of the session as is apparent from the lack of separation of the 95%-CI boundaries of these curves. This may
be contrary to predictions based on physical fatigue or neural habituation to visual motion. Next, we compared sessions performed before the middle date of each mouse’s test period (Fig.
4b) to those performed on or after that date. We found that the OLR was almost twice as strong in the newer sessions than in the older ones. This is contrary to our prediction that, by
removing the visual effect from the OLR by head-fixing the mice, the reflex would attenuate over time. However, the estimates of the speed that evoked the strongest OLR did not change, that
is, the 95%-CI ellipses of these estimates overlap on the stimulus speed axis. DISCUSSION The opto-locomotor reflex method presented here to measure mouse visual function is closely related
to other methods monitoring the reflexes of eye- and head movements to onsets of large moving patterns. In the literature this is often referred to as the optomotor, optokinetic (OKR), or
vestibulo-ocular reflex (VOR)51. In those methods as in ours, the animals perceive a sensation of self-motion induced by moving patterns that cover a large part of the visual field. The mice
will try to compensate for this by turning in the same direction as the stimulus motion. An advantage of our method is that the technique relies on voluntary running behaviour of the mice
on the treadmill. The OLR is recorded automatically, removing the need of manually scoring the head movements, which is laborious and may be prone to subjective biases, although automatic
video-tracking based systems have recently been introduced that do not have those disadvantages49. A main disadvantage of our technique compared to other OKR and VOR paradigms is that our
method requires a surgery to attach the head post. This surgery, however, is short and minimally invasive, and may be required anyway in case the mouse is also used for concurrent imaging or
neurophysiological recordings. Our method could further be refined by the addition of eye tracking equipment to measure reflexive eye movements. On average across the three experiments in
this study, the mice exhibited the highest OLR-gain at a pattern speed of 32.6 deg/s, which is faster than optimal speeds in the range of 12 deg/s that are mostly reported in other OKR or
VOR studies17,29,48,49,52,53,54,55,56. This discrepancy may be due to the fact that all these studies use gratings instead of dot stimuli. A recent study with moving random dot patterns
shows, in a two-alternative forced choice task, that mice are most sensitive for speeds in the range of 50 deg/s57. Another possible explanation for the discrepancy in optimal speeds is the
fact that we use locomotion (running) as read-out as opposed to reflexes of the head or eyes measured in other studies17,29,48,49,52,53,54,55,56. The results of the contrast experiment
showed a slight decline of the OLR in response to the highest contrast value, whereas other studies reported a monotonic increase of sensitivity with contrast29,44,58. An explanation of this
discrepancy may lie in the way that we manipulated the contrast of our stimuli. We used dots with luminance values ranging from 0.11 to 3.98 cd/m2 but kept the background at a constant 0.09
cd/m2. This means that not only the contrast changed, but also the overall luminance of the display. Perhaps at the highest level, the stimulus was so bright that it slightly dazzled the
mice, reducing the effective contrast. The use of dark and bright dots that deviate equally from a mid-grey background should remove this confound. We found that a dot radius of about 3
degrees evoked the highest OLR gain. Although the dot size and the spatial frequency of gratings cannot directly be compared, this diameter is on the same order of magnitude as the optimal
period of about 10 degrees found for gratings in OKR and VOR experiments35,59,60, taking into account that the positive (bright) part of a 10-degree period is 5 degrees. By presenting the
stimuli at a range of speeds, we are able to assess the interaction between speed and dot size. The contours in Fig. 3d exhibit a clear slant in the area of the plot where the dots were
large and the stimulus speed low. This means that the parameters speed and dot size interacted, corresponding to the verbal description of the transition from inverted-U tuning to the linear
dependence given in the Results section. Some slant is also apparent in Fig. 3b but to a lesser degree because OLRs at 18 deg/s, although by definition as close to linear as the
corresponding OLR gains, are relatively small compared the OLRs induced by faster moving stimuli. A comparable interaction has been observed54 between the tuning to the spatial and temporal
frequencies of gratings under similar photopic conditions, but not between spatial frequency and speed. Because the latter is most similar to our dot size and speed tuning, this raises the
question why this interaction occurs in broad band stimuli but not gratings. In summary, the method presented here provides a fully automated readout of mouse visual function that removes
the need for behavioural training. It’s sufficiently sensitive to relatively subtle changes in the stimulus parameters and is consistent in at least the within session timescale. Moreover,
it can be straightforwardly combined with research techniques that require the head to be fixed in space. We conclude that the OLR method is a useful addition to the mouse visual
neuroscientific toolbox. MATERIALS AND METHODS ANIMALS In this study, we used 6 male wildtype C57BL/6 J mice. We chose this strain because it possesses normal vision35,36,60,61,62 and is
most often used in mouse perceptual/behavioural studies. Habituation of the animals began by handling and hand-feeding the mice each day. After one week, when the animals were at ease around
the experimenter, we determined their starting weights (24.8 ± 1.2 g). We gave each animal 2.2 g of food per day, and each day we checked that they were between 85% and 95% of their
starting weight. If animals fell below the 85% (above the 95%) threshold we increased (decreased) feed. All experiments were conducted in compliance with Dutch and European laws and
regulations and were approved by the animal ethical committee of Radboud University Nijmegen. SURGERY Anesthesia was induced and maintained by isoflurane (4% at induction, 1.0–1.5%
maintenance). The anesthetised animals were placed in a stereotactic holder fixating their heads, with their eyes covered in sterile ocular lube (Puralube, Dechra) to prevent eye
dehydration. After shaving the head of the animal, the skin on top of the head was removed, and a local anesthetic (1 mg/ml Lidocaine HCL with 0.25 mg/ml Bupivacain Actavis), was applied to
the exposed periosteum and the skull was cleaned with a bone scraper. Finally, a custom-made titanium head plate was fixed to the skull with dental cement (SuperBond C&B, Sun Medical).
HABITUATION A week after surgery, the mice were handled and head-fixed in the set-up for ten minutes. The duration was then increased to 40 minutes per session over the following 5 days to
habituate animals to prolonged head fixation on the treadmill. After 8–10 sessions of habituation, mice would run on the ball for 2 sessions of 40 minutes each per day. The animals were
running spontaneously, without requiring rewards or prompting otherwise. VISUAL STIMULATION Stimuli consisted of light grey dots on a dark grey background. We used an Optoma X501 video
projector (resolution: 1920 × 1080@60-Hz) to project the stimuli, via a quarter-spherical mirror, onto the inside of a dome made of fiberglass-reinforced resin (Fibresports UK; Basildon, UK)
with an inner-diameter of 112 cm (Fig. 5a). We placed the mouse on a treadmill consisting of a Styrofoam ball floating on air in a custom-made socket (University College London workshops)
at the center of this dome. The visual stimuli covered 220 degrees of visual angle horizontally, and from 10 degrees below the mouse to 80 degrees above it vertically. The distribution of
dots within this window was random and isotropic. More specifically, each dot was assigned an azimuth (in degrees) _azi_ = R(−110°, 110°), where _R_(_a_, _b_) is a function that returns a
random value from the uniform distribution over the interval (_a_, _b_), and an elevation (in degrees) _ele_ = sind−1 _R_(sin d −10°, sind 80°), where sind−1 and sind are trigonometric
functions that use degrees instead of radians. Taking the arcsine over the uniform interval serves the spherical isotropy of the dot-density. Without it, the density would increase at higher
elevations because the closer to the zenith, the smaller the circumference of the horizontal cross-section of the dome. The azimuth and elevation values were converted to regular (x,
y)-pixel values for the projector by means of an inverse lookup table. We pre-created this lookup table by measuring the azimuth and elevation of 200 sample dots that we projected onto the
inside of the dome in a 20 × 10-raster, evenly spaced in (x, y)-projector coordinates. When a dot needed to be displayed at an azimuth and elevation that fell in between these pre-measured
values we obtained the corresponding Cartesian pixel coordinates with bi-linear interpolation. To minimize distortion of the shape of the dots (that would occur where the light from the
projector hits the surface of the dome at an oblique angle) each “dot” consisted of a cluster of 21 partially overlapping component-dots that were organized in three concentric circles
around the central position. These component-dots were drawn as anti-aliased OpenGL dot primitives with a 5-pixel diameter, large enough to form a blob that was free of gaps. The azimuth and
elevation coordinates of each component-dot were fed through the (_azi_, _ele_)-to-(_x_, _y_) lookup table. This way, the dots looked maximally circular from the perspective of the mice. In
the remainder, when we write “dot” we mean such a cluster of component-dots. At the beginning of each trial, a new set of static dots appeared at random positions in the stimulus window.
After 1 or 2 s, these dots started moving for 2 s until they suddenly stopped and remained on the screen for another second (Fig. 5b). The 1 or 2-s duration of the initial static phase were
randomly interleaved to reduce the animal’s ability to anticipate motion onset. We created motion by incrementing (or decrementing) the azimuths of the dots at each 17-ms video frame,
resulting in a rotation around the vertical axis, or yaw. We showed motion at speeds ranging from 0 to 72 deg/s in steps of 9 deg/s. The dot-luminances were 0.11, 0.20, 0.5, 1.66, and 3.98
cd/m2 on a background of 0.09 cd/m2, resulting in Michelson contrasts of 0.09, 0.37, 0.68, 0.89 and 0.95. Dots had a radius of 0.6, 0.9, 1.4, 2.3, or 3.7 degrees. The number of dots was
inversely proportional to their surface area such that the portion of the display that was covered with dots was kept at 27% in all conditions. This way, the mean luminance of the visual
field remained constant when we manipulated the dot size. BEHAVIOURAL PARADIGM The mice performed twice daily in sessions of approximately 40 minutes. To test the effect of stimulus speed, a
session consisted of 10 repeats of a randomly interleaved set of 36 conditions (9 speeds, 2 directions, 2 starting times). The dot size and dot contrast sessions featured 5 repeats of 100
conditions (5 speeds, 2 directions, 2 starting times, 5 contrasts or sizes). Speed test sessions were repeated 7 times; the contrast and dot size tests 14 times. Hence, each condition was
repeated 70 times. RECORDING AND DATA ANALYSIS The 2D treadmill consisted of a Styrofoam ball (19.7 cm diameter) that was floating on pressurised air in a semi-spherical socket63, adapted
from insect studies64,65,66. We used an optical computer mouse to register the yaw in deg/s of the ball with a sampling rate of 60 Hz. Yaw is a proxy for OLR because it is the axis of
rotation of the visual stimulus. First, we smoothed the yaw time series using a 100-ms boxcar filter. Then, we calculated for each trial the mean yaw during the final 500 ms before motion
onset and subtracted this baseline from the yaw time series. Further data analysis steps are described in the Results section. DATA AVAILABILITY STATEMENT The datasets generated during
and/or analysed during the current study are available in the Donders Repository, https://WebDAV.data.donders.ru.nl/dcn/DAC_62001435_01_902/. REFERENCES * Niell, C. M. & Stryker, M. P.
Highly selective receptive fields in mouse visual cortex. _J. Neurosci._ 28, 7520–36 (2008). Article CAS PubMed PubMed Central Google Scholar * Huberman, A. D. & Niell, C. M. What
can mice tell us about how vision works? _Trends Neurosci._ 34, 464–73 (2011). Article CAS PubMed PubMed Central Google Scholar * Wang, Q., Gao, E. & Burkhalter, A. Gateways of
ventral and dorsal streams in mouse visual cortex. _J. Neurosci._ 31, 1905–18 (2011). Article CAS PubMed PubMed Central Google Scholar * Priebe, N. J. & McGee, A. W. Mouse vision as
a gateway for understanding how experience shapes neural circuits. _Front. Neural Circuits_ 8, 123 (2014). Article PubMed PubMed Central Google Scholar * Tsien, R. Y. _et al_.
Fluorescent indicators for Ca2+ based on green fluorescent proteins and calmodulin. _Nature_ 388, 882–887 (1997). Article ADS PubMed Google Scholar * Tian, L. _et al_. Imaging neural
activity in worms, flies and mice with improved GCaMP calcium indicators. _Nat. Methods_ 6, 875–881 (2009). Article CAS PubMed PubMed Central Google Scholar * Akemann, W., Mutoh, H.,
Perron, A., Rossier, J. & Knöpfel, T. Imaging brain electric signals with genetically targeted voltage-sensitive fluorescent proteins. _Nat. Methods_ 7, 643–649 (2010). Article CAS
PubMed Google Scholar * Knöpfel, T. Genetically encoded optical indicators for the analysis of neuronal circuits. _Nat. Rev. Neurosci._ 13, 687–700 (2012). Article PubMed Google Scholar
* Chen, T.-W. _et al_. Ultrasensitive fluorescent proteins for imaging neuronal activity. _Nature_ 499, 295–300 (2013). Article ADS CAS PubMed PubMed Central Google Scholar * Antic,
S. D., Empson, R. M. & Knöpfel, T. Voltage imaging to understand connections and functions of neuronal circuits. _J. Neurophysiol._ 116, 135–152 (2016). Article CAS PubMed PubMed
Central Google Scholar * Han, X. _et al_. Millisecond-timescale optical control of neural dynamics in the nonhuman primate brain. _Neuron_ 62, 191–8 (2009). Article CAS PubMed PubMed
Central Google Scholar * Zhang, F. _et al_. Multimodal fast optical interrogation of neural circuitry. _Nature_ 446, 633–639 (2007). Article ADS CAS PubMed Google Scholar * Fenno, L.,
Yizhar, O. & Deisseroth, K. The Development and Application of Optogenetics. _Annu. Rev. Neurosci._ 34, 389–412 (2011). Article CAS PubMed Google Scholar * Packer, A. M., Roska, B.
& Häusser, M. Targeting neurons and photons for optogenetics. _Nat. Neurosci._ 16, 805–15 (2013). Article CAS PubMed PubMed Central Google Scholar * Wulff, P. & Arenkiel, B. R.
Chemical genetics: receptor-ligand pairs for rapid manipulation of neuronal activity. _Curr. Opin. Neurobiol._ 22, 54–60 (2012). Article CAS PubMed Google Scholar * Sternson, S. M. &
Roth, B. L. Chemogenetic Tools to Interrogate Brain Functions. _Annu. Rev. Neurosci._ 37, 387–407 (2014). Article CAS PubMed Google Scholar * Prusky, G. T. & Douglas, R. M.
Characterization of mouse cortical spatial vision. _Vision Res._ 44, 3411–3418 (2004). Article CAS PubMed Google Scholar * Andermann, M. L., Kerlin, A. M. & Reid, R. C. Chronic
cellular imaging of mouse visual cortex during operant behavior and passive viewing. _Front. Cell. Neurosci._ 4, 3 (2010). PubMed PubMed Central Google Scholar * Lee, S.-H. _et al_.
Activation of specific interneurons improves V1 feature selectivity and visual perception. _Nature_ 488, 379–83 (2012). Article ADS CAS PubMed PubMed Central Google Scholar * Poort, J.
_et al_. Learning Enhances Sensory and Multiple Non-sensory Representations in Primary Visual Cortex. _Neuron_ 86, 1478–90 (2015). Article CAS PubMed PubMed Central Google Scholar *
Pinto, L. H. & Enroth-Cugell, C. Tests of the mouse visual system. _Mamm. Genome_ 11, 531–6 (2000). Article CAS PubMed Google Scholar * Thompson, S., Philp, A. R. & Stone, E. M.
Visual function testing: A quantifiable visually guided behavior in mice. _Vision Res._ 48, 346–352 (2008). Article PubMed Google Scholar * Siemann, J. K. _et al_. A novel behavioral
paradigm to assess multisensory processing in mice. _Front. Behav. Neurosci._ 8, 456 (2015). Article PubMed PubMed Central Google Scholar * Crawley, J. N. _What’s wrong with my mouse?:
behavioral phenotyping of transgenic and knockout mice_. (Wiley-Interscience, 2007). * Takao, K. & Miyakawa, T. Light/dark transition test for mice. _J. Vis. Exp_. 104,
https://doi.org/10.3791/104 (2006) * Cowey, A. & Franzini, C. The retinal origin of uncrossed optic nerve fibres in rats and their role in visual discrimination. _Exp. brain Res._ 35,
443–55 (1979). CAS PubMed Google Scholar * Prusky, G. T., Alam, N. M., Beekman, S. & Douglas, R. M. Rapid Quantification of Adult and Developing Mouse Spatial Vision Using a Virtual
Optomotor System. _Investig. Opthalmology Vis. Sci._ 45, 4611 (2004). Article Google Scholar * Cahill, H., Nathans, J., Mettens, P., Nagao, S. & Mobraaten, L. The Optokinetic Reflex as
a Tool for Quantitative Analyses of Nervous System Function in Mice: Application to Genetic and Drug-Induced Variation. _PLoS One_ 3, e2055 (2008). Article ADS PubMed PubMed Central
Google Scholar * Umino, Y., Solessio, E. & Barlow, R. B. Speed, spatial, and temporal tuning of rod and cone vision in mouse. _J. Neurosci._ 28, 189–98 (2008). Article CAS PubMed
PubMed Central Google Scholar * May, P. J. The mammalian superior colliculus: laminar structure and connections. in. _Progress in brain research_ 151, 321–378 (2006). Article PubMed
Google Scholar * Stryker, M. P. & Schiller, P. H. Eye and head movements evoked by electrical stimulation of monkey superior colliculus. _Exp. brain Res._ 23, 103–12 (1975). Article
CAS PubMed Google Scholar * Wang, L., Sarnaik, R., Rangarajan, K., Liu, X. & Cang, J. Visual Receptive Field Properties of Neurons in the Superficial Superior Colliculus of the Mouse.
_J. Neurosci._ 30, 16573–16584 (2010). Article CAS PubMed PubMed Central Google Scholar * Fox, M. W. The visual cliff test for the study of visual depth perception in the mouse. _Anim.
Behav._ 13, 232–IN3 (1965). Article CAS PubMed Google Scholar * Morris, R. G. M., Garrud, P., Rawlins, J. N. P. & O’Keefe, J. Place navigation impaired in rats with hippocampal
lesions. _Nature_ 297, 681–683 (1982). Article ADS CAS PubMed Google Scholar * Prusky, G. T., West, P. W. & Douglas, R. M. Behavioral assessment of visual acuity in mice and rats.
_Vision Res._ 40, 2201–9 (2000). Article CAS PubMed Google Scholar * Wong, A. A. & Brown, R. E. Visual detection, pattern discrimination and visual acuity in 14 strains of mice.
_Genes. Brain. Behav._ 5, 389–403 (2006). Article CAS PubMed Google Scholar * Morgan, D. W M Tasks in Mice: Special Reference to Alzheimer’s Transgenic Mice. Methods of Behavior
_Analysis in Neuroscience_ (CRC Press/Taylor & Francis, 2009). * Harvey, C. D., Coen, P. & Tank, D. W. Choice-specific sequences in parietal cortex during a virtual-navigation
decision task. _Nature_ 484, 62–8 (2012). Article ADS CAS PubMed PubMed Central Google Scholar * Keller, G. B., Bonhoeffer, T. & Hübener, M. Sensorimotor mismatch signals in
primary visual cortex of the behaving mouse. _Neuron_ 74, 809–15 (2012). Article CAS PubMed Google Scholar * Harvey, C. D., Collman, F., Dombeck, D. A. & Tank, D. W. Intracellular
dynamics of hippocampal place cells during virtual navigation. _Nature_ 461, 941–946 (2009). Article ADS CAS PubMed PubMed Central Google Scholar * Schmidt-Hieber, C. & Häusser, M.
Cellular mechanisms of spatial navigation in the medial entorhinal cortex. _Nat. Publ. Gr._ 16, 325–331 (2013). CAS Google Scholar * Hölscher, C., Schnee, A., Dahmen, H., Setia, L. &
Mallot, H. A. Rats are able to navigate in virtual environments. _J. Exp. Biol_. 208, (2005). * Lee, H., Kuo, M., Chang, D., Ou-Yang, Y. & Chen, J. Development of virtual reality
environment for tracking rat behavior. _J. Med. Biol. Eng._ 27, 71–78 (2007). Google Scholar * Histed, M. H., Carvalho, L. A. & Maunsell, J. H. R. Psychophysical measurement of contrast
sensitivity in the behaving mouse. _J. Neurophysiol._ 107, 758–65 (2012). Article PubMed Google Scholar * Guo, Z. V. _et al_. Procedures for Behavioral Experiments in Head-Fixed Mice.
_PLoS One_ 9, e88678 (2014). Article ADS PubMed PubMed Central Google Scholar * ter Braak, J. W. G. Untersuchungen über optokinetischen Nystagmus. _Arch. Neerl. Physiol_. 309–376
(1936). * Gresty, M. A. Eye, head and body movements of the guinea pig in response to optokinetic stimulation and sinusoidal oscillation in yaw. _Pflugers Arch._ 353, 201–14 (1975). Article
CAS PubMed Google Scholar * Kretschmer, F., Tariq, M., Chatila, W., Wu, B. & Badea, T. C. Comparison of optomotor and optokinetic reflexes in mice. _J. Neurophysiol._ 118, 300–316
(2017). Article PubMed Google Scholar * Kretschmer, F., Sajgo, S., Kretschmer, V. & Badea, T. C. A system to measure the Optokinetic and Optomotor response in mice. _J. Neurosci.
Methods_, https://doi.org/10.1016/j.jneumeth.2015.08.007 (2015) * Benkner, B., Mutter, M., Ecke, G. & Münch, T. A. Characterizing visual performance in mice: An objective and automated
system based on the optokinetic reflex. _Behav. Neurosci._ 127, 788–796 (2013). Article PubMed Google Scholar * Stahl, J. S. Using eye movements to assess brain function in mice. _Vision
Res._ 44, 3401–3410 (2004). Article PubMed Google Scholar * Mangini, N. J., Vanable, J. W., Williams, M. A. & Pinto, L. H. The optokinetic nystagmus and ocular pigmentation of
hypopigmented mouse mutants. _J. Comp. Neurol._ 241, 191–209 (1985). Article CAS PubMed Google Scholar * Mitchiner, J. C., Pinto, L. H. & Vanable, J. W. Visually evoked eye movements
in the mouse (Mus musculus). _Vision Res._ 16, 1169–IN7 (1976). Article CAS PubMed Google Scholar * Thaung, C., Arnold, K., Jackson, I. J. & Coffey, P. J. Presence of visual head
tracking differentiates normal sighted from retinal degenerate mice. _Neurosci. Lett._ 325, 21–24 (2002). Article CAS PubMed Google Scholar * Abdeljalil, J. _et al_. The optomotor
response: A robust first-line visual screening method for mice. _Vision Res._ 45, 1439–1446 (2005). Article PubMed Google Scholar * Kretschmer, F., Kretschmer, V., Kunze, V. P. &
Kretzberg, J. OMR-arena: Automated measurement and stimulation system to determine mouse visual thresholds based on optomotor responses. _PLoS One_ 8, 1–12 (2013). Google Scholar * Stirman,
J. N., Townsend, L. B. & Smith, S. L. A touchscreen based global motion perception task for mice. _Vision Res._ 127, 74–83 (2016). Article PubMed PubMed Central Google Scholar *
Busse, L. _et al_. The detection of visual contrast in the behaving mouse. _J. Neurosci._ 31, 11351–61 (2011). Article CAS PubMed Google Scholar * Gianfranceschi, L., Fiorentini, A.
& Maffei, L. Behavioural visual acuity of wild type and bcl2 transgenic mouse. _Vision Res._ 39, 569–74 (1999). Article CAS PubMed Google Scholar * Sinex, D. G., Burdette, L. J.
& Pearlman, A. L. A psychophysical investigation of spatial vision in the normal and reeler mutant mouse. _Vision Res._ 19, 853–857 (1979). Article CAS PubMed Google Scholar *
Bussey, T. J., Saksida, L. M. & Rothblat, L. A. Discrimination of computer-graphic stimuli by mice: a method for the behavioral characterization of transgenic and gene-knockout models.
_Behav. Neurosci._ 115, 957–60 (2001). Article CAS PubMed Google Scholar * Prusky, G. T. & Douglas, R. M. Developmental plasticity of mouse visual acuity. _Eur. J. Neurosci._ 17,
167–173 (2003). Article PubMed Google Scholar * Dombeck, D. A., Khabbaz, A. N., Collman, F., Adelman, T. L. & Tank, D. W. Imaging large-scale neural activity with cellular resolution
in awake, mobile mice. _Neuron_ 56, 43–57 (2007). Article CAS PubMed PubMed Central Google Scholar * Dahmen, H. J. A simple apparatus to investigate the orientation of walking insects.
_Experientia_ 36, 685–687 (1980). Article Google Scholar * Mason, A. C., Oshinsky, M. L. & Hoy, R. R. Hyperacute directional hearing in a microscale auditory system. _Nature_ 410,
686–690 (2001). Article ADS CAS PubMed Google Scholar * Stevenson, P. A. Octopamine and Experience-Dependent Modulation of Aggression in Crickets. _J. Neurosci._ 25, 1431–1441 (2005).
Article CAS PubMed Google Scholar Download references ACKNOWLEDGEMENTS This work was funded by NWO/MaGW 404-10-405. AUTHOR INFORMATION AUTHORS AND AFFILIATIONS * Department of
Biophysics, Donders Institute, Radboud University, Nijmegen, The Netherlands L. A. M. H. Kirkels, W. Zhang, R. J. A. van Wezel & J. Duijnhouwer * Department of Neuroinformatics, Donders
Institute, Radboud University, Nijmegen, The Netherlands M. N. Havenith & P. Tiesinga * Department of Cognitive Neuroscience, Donders Institute, RadboudUMC, Nijmegen, The Netherlands M.
N. Havenith & J. Glennon * Biomedical Signals and Systems, MIRA, Twente University, Enschede, The Netherlands R. J. A. van Wezel * Center for Molecular and Behavioral Neuroscience,
Rutgers University, Newark, USA J. Duijnhouwer Authors * L. A. M. H. Kirkels View author publications You can also search for this author inPubMed Google Scholar * W. Zhang View author
publications You can also search for this author inPubMed Google Scholar * M. N. Havenith View author publications You can also search for this author inPubMed Google Scholar * P. Tiesinga
View author publications You can also search for this author inPubMed Google Scholar * J. Glennon View author publications You can also search for this author inPubMed Google Scholar * R. J.
A. van Wezel View author publications You can also search for this author inPubMed Google Scholar * J. Duijnhouwer View author publications You can also search for this author inPubMed
Google Scholar CONTRIBUTIONS J.D., L.K., W.Z. and R.W. designed the study. W.Z. and L.K. performed the experiments, L.K. and J.D. analysed the data. L.K., R.W. and J.D. wrote the manuscript.
M.H., P.T. and J.G. were involved in critically reading the manuscript. CORRESPONDING AUTHOR Correspondence to L. A. M. H. Kirkels. ETHICS DECLARATIONS COMPETING INTERESTS The authors
declare no competing interests. ADDITIONAL INFORMATION PUBLISHER'S NOTE: Springer Nature remains neutral with regard to jurisdictional claims in published maps and institutional
affiliations. RIGHTS AND PERMISSIONS OPEN ACCESS This article is licensed under a Creative Commons Attribution 4.0 International License, which permits use, sharing, adaptation, distribution
and reproduction in any medium or format, as long as you give appropriate credit to the original author(s) and the source, provide a link to the Creative Commons license, and indicate if
changes were made. The images or other third party material in this article are included in the article’s Creative Commons license, unless indicated otherwise in a credit line to the
material. If material is not included in the article’s Creative Commons license and your intended use is not permitted by statutory regulation or exceeds the permitted use, you will need to
obtain permission directly from the copyright holder. To view a copy of this license, visit http://creativecommons.org/licenses/by/4.0/. Reprints and permissions ABOUT THIS ARTICLE CITE THIS
ARTICLE Kirkels, L.A.M.H., Zhang, W., Havenith, M.N. _et al._ The opto-locomotor reflex as a tool to measure sensitivity to moving random dot patterns in mice. _Sci Rep_ 8, 7710 (2018).
https://doi.org/10.1038/s41598-018-25844-4 Download citation * Received: 14 December 2017 * Accepted: 24 April 2018 * Published: 16 May 2018 * DOI: https://doi.org/10.1038/s41598-018-25844-4
SHARE THIS ARTICLE Anyone you share the following link with will be able to read this content: Get shareable link Sorry, a shareable link is not currently available for this article. Copy
to clipboard Provided by the Springer Nature SharedIt content-sharing initiative