Volumetric, nanoscale optical imaging of mouse and human kidney via expansion microscopy
- Select a language for the TTS:
- UK English Female
- UK English Male
- US English Female
- US English Male
- Australian Female
- Australian Male
- Language selected: (auto detect) - EN
Play all audios:

ABSTRACT Although light microscopy is a powerful tool for the assessment of kidney physiology and pathology, it has traditionally been unable to resolve structures separated by less than the
~250 nm diffraction limit of visible light. Here, we report on the optimization, validation, and application of a recently developed super-resolution fluorescence microscopy method, called
expansion microscopy (ExM), for volumetric interrogation of mouse and human kidney tissue with 70–75 nm lateral and ~250 nm axial spatial resolution. Using ExM with a standard confocal
microscope, we resolve fine details of structures that have traditionally required visualization by electron microscopy, including podocyte foot processes, the glomerular basement membrane,
and the cytoskeleton. This inexpensive and accessible approach to volumetric, nanoscale imaging enables visualization of fine structural details of kidney tissues that were previously
difficult or impossible to measure by conventional methodologies. SIMILAR CONTENT BEING VIEWED BY OTHERS ADVANCES IN FLUORESCENCE MICROSCOPY TECHNIQUES TO STUDY KIDNEY FUNCTION Article 18
September 2020 EXPANSION-ENHANCED SUPER-RESOLUTION RADIAL FLUCTUATIONS ENABLE NANOSCALE MOLECULAR PROFILING OF PATHOLOGY SPECIMENS Article Open access 10 April 2023 MAGNIFY IS A UNIVERSAL
MOLECULAR ANCHORING STRATEGY FOR EXPANSION MICROSCOPY Article Open access 02 January 2023 INTRODUCTION The kidney glomerulus is a compact network of capillaries, supporting tissue, and
resident cells. A critical structure of the glomerulus is the three-layered glomerular filtration barrier (GFB) that filters waste products from the blood space to the urinary space and is
comprised of innermost fenestrated glomerular endothelial cells, glomerular basement membrane (GBM), and outermost interdigitated epithelial cells called podocytes. A major limitation in
imaging the GFB is that many of the structures of the GFB are too small and too densely packed to be resolvable by the ~250 nm resolution of traditional diffraction-limited light microscopy.
To date, the analysis of fine structural details of the GFB has primarily relied on electron microscopy (EM). Although extremely powerful, EM is typically limited to thin sections (<100
nm) and has a poor ability to report on distributions of specific protein molecules. Advanced EM methods such as serial block face scanning electron microscopy (SEM) or focused ion beam SEM
can produce high-resolution volumetric image stacks that are on the order of 100 µm thick, although the instruments are not yet widely available and the data acquisition process is
timeconsuming1. Correlative light and electron microscopy is technically demanding and requires use of sophisticated instruments and/or workflow, and typically lacks high-resolution
volumetric information2. There is thus a strong need for new, accessible tools to interrogate kidney tissue with high spatial resolution, practical volumetric imaging capability, and
molecular specificity. A range of established super-resolution fluorescence microscopy methods are capable of analyzing 3D molecular distributions at length scales below 250 nm and have
recently been applied to the study of kidney. Single molecule localization microscopy (SMLM), stimulated emission depletion (STED) microscopy, and structured illumination microscopy (SIM)
have been used to study separate components of the GFB such as GBM composition3, slit diaphragm structure4, and podocyte effacement in diseased tissue5, respectively. Unfortunately, each of
these methods currently suffers from certain limitations which still hinder widespread implementation. SMLM and STED have strict requirements for fluorophore properties, which create
challenges for multicolor imaging. Additionally, SMLM, and to a lesser extent SIM (in its most common, commercial implementations) typically have poor resolution beyond a few micrometers
from a coverglass substrate. Moreover, all of these methods require expensive, specialized instruments, and substantial technical and interpretive expertise. Here, we report on the
optimization, validation, and application of a recently developed super-resolution fluorescence microscopy method, called expansion microscopy (ExM), for volumetric nanoscale interrogation
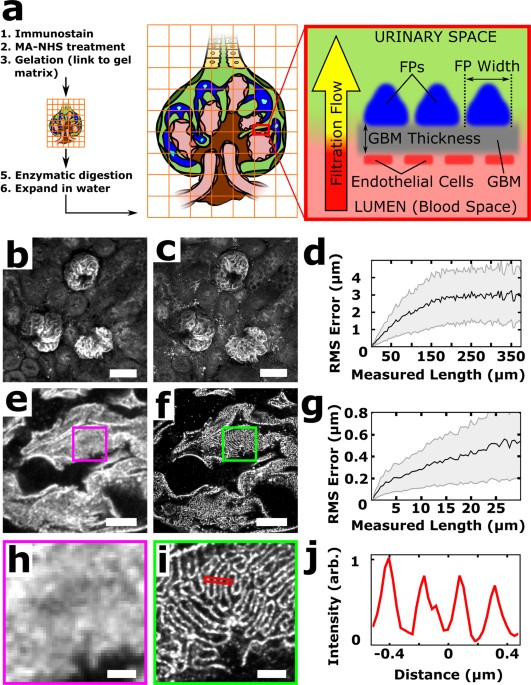
of mouse and human kidney tissue using a conventional fluorescence microscope. In ExM, fluorescent labels on fixed specimens are linked to a swellable polymer hydrogel that is grown within
the specimen, after which the specimen is homogenized to facilitate uniform expansion and then swollen through incubation with deionized water (Fig. 1a)6,7,8,9. The physical magnification of
the specimen in ExM allows features closer than the diffraction limit of light (~250 nm) to become resolvable in the expanded state. Additionally, the procedure renders samples optically
clear with little scattering, facilitating deep volumetric imaging. With ~4× expansion per dimension, we achieve 70–75 nm lateral and ~250 nm axial spatial resolution at substantial depths,
enabling nanoscale analysis of volumetric data sets as well as digital reorientation to ensure _en face_ or orthogonal views. Additionally, because imaging is performed with a confocal
microscope, multichannel data collection is straightforward. RESULTS Faithful expansion of a biological specimen using ExM requires the specimen to be homogenized after hydrogel embedding in
order to avoid non-uniform expansion or tearing during the expansion process. Our initial results showed that homogenization procedures previously established for cultured cells and brain
tissue using the broad-specificity protease proteinase K6,7,8 was unable to successfully homogenize fresh 100 μm mouse kidney sections embedded in hydrogel and led to gross distortions of
the tissue (Supplementary Fig. 1). To test the hypothesis that the kidney’s collagen-rich extracellular matrix hindered homogenization, a collagenase digestion step was added and led to
robust expansion with high fidelity (Fig. 1b-g, Supplementary Fig. 1). It should be noted that treatment with heat and detergent, which is used in the magnified analysis of the proteome
(MAP) protocol under different fixation and hydrogel embedding conditions9,10, did not successfully homogenize the specimen (Supplementary Fig. 1). Interdigitated podocyte foot processes
that were separated by <250 nm were clearly evident in the post-expansion images but were unobservable pre-expansion (Fig. 1e–f, h–j). A comparison of pre-expansion and post-expansion
images of the same regions revealed that expansion-induced distortions were relatively minor, with 2–4% distortions for length scales up to ~150 μm and <2% for larger length scales (Fig.
1d,g; see also Supplementary Fig. 2). Based on the measured cross-sectional profiles of microtubules in expanded kidney tissue, we estimate our resolution to be ~70–75 nm (Supplementary Fig.
3). Note that all distances and scale bars for expanded specimens have been divided by their respective, measured expansion factors of ~4× and therefore refer to pre-expansion dimensions.
We next assessed fine structural details that were observable by expanding mouse kidney sections that had been labeled with a range of antibodies or fluorescent proteins. A triple
immunostain for podocin (podocyte foot process junctions), agrin (glomerular basement membrane), and podocalyxin (podocyte apical surfaces and, more weakly, endothelial cells) clearly
resolved the separate layers of the GFB, and demarcated podocyte foot processes (Fig. 2a–d). A triple immunostain for synaptopodin (body of podocyte secondary foot processes), acetylated
tubulin (podocyte primary foot processes, generally), and podocin enabled the identification of primary and secondary foot processes, and revealed the expected interior/surface relationship
of stains for synaptopodin and podocin (Fig. 2e–h). A triple immunostain for full-length collagen IV (basement membrane, mesangium, and Bowman’s capsule), podocalyxin, and α smooth muscle
actin (afferent and efferent arterioles and mesangium) showed larger-scale features of the glomerulus (Fig. i–l). Taking advantage of permanently lineage-tagged cells in reporter mice11, we
found that our procedure is also compatible with genetically-encoded fluorescent proteins (without post-fixation immunolabeling) by recording images of expanded mouse kidney sections derived
from a Podocin-confetti mouse (Fig. 2m–r). The expression of GFP, YFP, and RFP within different podocytes allowed them to be clearly identified as distinct cells over relatively large
regions. Altogether, the expansion of kidney tissues was robust and versatile, with the ability to report on key glomerular structures and distributions of proteins using genetically encoded
or exogenous fluorescent labels. In order to further validate this approach, we measured quantitative features of the GFB such as foot process width and GBM thickness, which are metrics
that are of clinical use and are typically obtained via transmission EM (TEM). Unlike TEM, however, which is typically measured in two dimensions on thin tissue sections, volumetric data
sets are easily obtained with ExM (Fig. 3a, Supplementary Movies 1 and 2) and enable the viewing of images _en face_ or orthogonally. This approach therefore avoids sectioning artifacts that
commonly occur when imaging thin sections that can, for instance, lead to overestimation of foot process width or GBM thickness12,13. An immunostain for podocin was used to measure the
average foot process width (FPW) in three different ways (Fig. 3c–h). First, an analysis of many cross-sectional profiles _en face_ revealed an average peak-to-peak separation of 247 ± 29 nm
(mean ± standard deviation (SD)), which was taken to be the average FPW (Fig. 3c–e). Second, the length of a cross-sectional profile drawn across an orthogonal view of podocin signal was
divided by the number of foot processes (troughs) along it, giving an average FPW of ~250 nm (Fig. 3g,h). Third, a stereological approach originally developed for two-dimensional TEM14,15
was used to calculate the average FPW by dividing the area of a region of GFB by the total length of podocin signal within that area (red trace in Fig. 3c), again giving a similar value of
240 ± 46 nm (mean ± SD) (Fig. 3f). Previous studies utilizing different fixation and hydrogel-embedding methods4,10 from those used here have resolved the slit diaphragm and reported its
width to be ~80 nm, close to our estimated spatial resolution of 70–75 nm. Next, the distribution of three GBM proteins were measured for regions of the GBM that were oriented perpendicular
to the plane; agrin exhibited an average full width at half maximum (FWHM) of 178 ± 36 nm while vimentin and collagen IV stains in the same mouse revealed average GBM thicknesses of 192 ± 36
nm and 147 ± 26 nm (mean ± SD) (Supplementary Fig. 4), respectively, in agreement with previously measured GBM thicknesses measured by SMLM in ultracryomicrotome sections3. Nanoscale
features could be resolved in these specimens at relatively large depths (up to ~120 µm in expanded specimens, or ~30 µm in pre-expansion units) and were limited here simply by the working
distance of the objective lens available on our microscope Supplementary Figs 3, 5). We next sought to use the kidney ExM procedure described above on fresh human (nephrectomy) kidney
tissue. Unfortunately, digestion with proteinase K and collagenase was insufficient for homogenization, and human kidney specimens expanded poorly (Supplementary Fig. 6). Based on our
previous results showing that collagenase is necessary for mouse kidney digestion, we hypothesized that the poor homogenization was caused by the presence of one or more additional proteins
in the extracellular matrix of human kidney which are more abundant than their counterparts in mouse kidney. We considered elastin as a candidate due to its abundance in human
tissue16,17,18. Following the incorporation of an additional, initial digestion step with the enzyme elastase, in addition to the proteinase K and collagenase digestion steps, reliable
expansion of fixed 100 μm human kidney sections was successfully achieved (Fig. 4a). Quantitative correlative analysis of pre- and post-expansion images of the same region of human kidney
stained for podocin showed distortions of 1–3% over a range of length scales (Supplementary Fig. 7). Measurements showed foot process widths of ~418 ± 61 nm using a series of cross-sectional
profiles (Fig. 4c) and ~426 ± 31 nm (mean ± SD) using areas divided by the length of the podocin signal (Fig. 4d), consistent with values reported in the literature14,15. In some instances,
this methodology resolved two closely-spaced features within the podocin signal with a separation of 113 ± 13 nm (mean ± SD) (Supplementary Fig. 8) that likely represent expression of
podocin within adjacent foot processes. DISCUSSION Our results show the optimization and validation of new ExM protocols which enables volumetric, nanoscale imaging of mouse and human kidney
tissue using a standard confocal microscope. Importantly, the procedures utilize new homogenization strategies to enzymatically digest the extracellular matrix of mouse and human kidney
tissue with minimal distortion upon expansion (1–4%). These or other tissue-optimized digestion procedures may also be useful for ExM with other tissues whose substantial extracellular
matrix or other components may also resist enzymatic digestion. While electron microscopy has vastly superior spatial resolution compared to ExM, the 70–75 nm resolution demonstrated here is
sufficient to resolve key nanoscale structures important for understanding kidney function in the laboratory or clinic while also providing the ability to measure 3D distributions of
multiple, specific molecules. These 3D data sets allow users to identify areas of interest with a desired orientation (i.e. _en face_, orthogonal, etc.) which helps to avoid sectioning
artifacts and thereby simplifies analysis and interpretation. Additionally, the simplicity and reduced cost of ExM compared to EM or other optical super-resolution techniques, makes the
technique accessible to a wide range of potential practitioners. Three recent studies have also applied expansion methodology to the kidney. Zhao _et al_. applied ExM to the study of ~5 μm
thick formalin-fixed paraffin-embedded (FFPE) tissue sections and was limited to two-dimensional imaging19. The FFPE kidney sections expanded with low distortion in the Zhao _et al_. study19
using only proteinase K digestion, perhaps due to some combination of a low amount of connective tissue in the very thin specimens and/or structural changes to the specimen due to FFPE
sample processing (e.g., dehydration or treatment with organic solvents, etc.)20. Ku _et al_. demonstrated expansion of multiple, perfusion-fixed whole mouse organs including kidney but only
imaged and quantitatively validated the procedure with brain and cultured cells9. During the final stages of this work, a similar procedure to that of Ku _et al_., but different from ours,
was reported by Unnersjö-Jess _et al_.10 for expansion of rat and mouse kidney, and the authors demonstrated the nanoscale, volumetric imaging of rat and mouse glomeruli using specimen
expansion with confocal microscopy. We note a number of key differences between the Unnersjö-Jess _et al_. study and ours, which we believe are complementary studies. First, we performed
careful imaging of kidney tissues both before and after expansion in order to quantify the amount of distortion introduced by expansion, and we used this to show quantitatively that our
procedures induce minimal distortion over a range of length scales for both mouse and human kidney tissues. In contrast, Unnersjö-Jess _et al_. compared two average feature sizes from
different samples before and after expansion, although their results were strong on a qualitative level and no obvious distortions were apparent. Second, while our immunolabeling was
performed prior to gelation, the procedure of Unnersjö-Jess _et al_. used immunolabeling after expansion. Thus, pre-expansion and post-expansion labeling may have different abilities to
detect epitopes, and there is precedence for some epitopes being masked due to hydrogel polymerization and others that are revealed upon denaturation9. Additionally, post-expansion staining
may cause less antibody-induced broadening since pre-expansion labeling leads to expansion of the antibody labels while post-expansion labeling does not8. Third, our procedures enabled us to
image intrinsic signal from fluorescent proteins in kidney in reporter mice, including ones which are not antigenically distinct (i.e., GFP, YFP, etc.), while the Unnersjö-Jess _et al_.
protocol did not. Fourth, using five-fold expansion together with deconvolution confocal or STED microscopy, Unnersjö-Jess _et al_. were able to achieve higher spatial resolution than we
achieved here with four-fold expansion and standard confocal microscopy, although these techniques could in principle also be implemented with our procedures to similarly improve the spatial
resolution. Lastly, we have provided extensive documentation of our procedures for ExM of mouse and human kidney tissue in a detailed experimental protocol (Supplementary Protocol 1) to
help accelerate the dissemination of these methods for a range of applications from the research laboratory to the clinic. MATERIALS AND METHODS REAGENTS AND REAGENT PREPARATION Unconjugated
secondary antibodies were obtained from Jackson Immunoresearch (West Grove, PA, USA) and included donkey anti-mouse (715-005-151), donkey anti-rabbit (711-005-152), donkey anti-goat
(705-005-147), donkey anti-rat (712-545-150), and donkey anti-guinea pig (706-005-148). Primary antibodies were purchased as follows: Rabbit anti-podocin (P0372, Sigma-Aldrich, St. Louis,
MO, USA), goat anti-podocalyxin (AF1556, R&D Systems Inc., Minneapolis, MN, USA), mouse anti-agrin (6D2, DSHB, Iowa City, IA, USA), rabbit anti-collagen IV (ab6586, Abcam, Cambridge, MA,
USA), mouse anti-acetylated tubulin (T7451, Sigma-Aldrich), mouse anti-alpha smooth muscle actin (904601, BioLegend, San Diego, CA, USA), guinea pig anti-synaptopodin (internal N-terminus)
(GP94-IN, Progen Biotechnik, Heidelberg, Germany), mouse anti-vimentin (18-0052, Thermo Fisher Scientific/Invitrogen, Waltham, MA, USA), and rat anti-alpha tubulin (Thermo Fisher
Scientific). NHS-functionalized dyes were purchased from Sigma-Aldrich (ATTO 488 and ATTO 647 N) and Thermo Fisher Scientific (Alexa Fluor 488 and Alexa Fluor 568). NHS-functionalized dyes
were received in 1 mg aliquots and were dissolved at a concentration of 100 mg/mL in anhydrous DMSO, further diluted into subaliquots of 1–10 mg/mL, and were stored at −20 °C. Hoechst 33342
was purchased from Life Technologies (Carlsbad, CA, USA) and was used according to manufacturer’s instructions. NAP-5 size-exclusion chromatography columns were purchased from GE Healthcare
(Little Chalfont, Buckinghamshire, United Kingdom). Methacrylic acid N-hydroxy succinimidyl ester (MA-NHS) was purchased from Sigma-Aldrich and was dissolved in anhydrous DMSO in 1 M
aliquots which were stored at −20 °C. Paraformaldehyde (32%) was obtained from Electron Microscopy Sciences (Hatfield, PA, USA). Tetramethylethylenediamine (TEMED, 17919) and ammonium
persulfate (APS, 17874) were obtained from Thermo Fisher Scientific. 4-hydroxy-2,2,6,6-tetramethylpiperadin-1-oxyl (TEMPO, 97%, 176141) and sodium acrylate (97%, 408220) were purchased from
Sigma Aldrich. 40% acrylamide (1610140) and 2% bis-acrylamide (1410142) were obtained from Bio-Rad Laboratories (Herculues, CA, USA). Proteinase K was purchased from Thermo Fisher Scientific
(EO0491), collagenase (F type blend, C7926) from Sigma-Aldrich, and elastase (16-19-051200-porcine) from Athens Research & Technology (Athens, GA, USA). 10x phosphate buffered saline
(70011044) and 10x Tris-acetate-EDTA (TAE, 15558042) buffers were purchased from Thermo Scientific. Hank’s Balanced Salt Solution (HBSS, 1x) buffer was purchased from Corning (Manassas, VA,
USA). Bovine serum albumin (BSA) was obtained from Santa Cruz Biotechnology (Santa Cruz, CA, USA). PREPARATION OF FLUOROPHORE-LABELED SECONDARY ANTIBODIES Fluorescent dyes were coupled to
secondary antibodies in-house by first mixing ~40 µL of unconjugated antibody (~1.3 mg/mL), 5 µL of 1 M sodium bicarbonate (pH ~8.3), and 1–2 µL of NHS dye (stocks made in DMSO at 1–10 mg/mL
depending on the dye). The reaction was allowed to proceed at room temperature for 30 min. For purification, a NAP-5 size exclusion column was equilibrated by flowing through 10–20 mL PBS.
The entire reaction mixture was then loaded onto the column followed by 650 µL of PBS which was discarded after elution. Another 300 µL was then added and the eluent was collected.
Characterization of the dye-to-IgG ratio was performed with UV/Vis absorption spectroscopy and the results can be found in Supplementary Table 1. FLUORESCENCE MICROSCOPES Conventional
epifluorescence microscopy was performed with an inverted Nikon Ti-S microscope fitted with a 4 × 0.2 NA air objective lens (Nikon, Melvill, NY, USA), a 10 × 0.25 NA air objective lens
(Nikon), or a 20 × 0.45 NA air objective lens (Nikon). Illumination was achieved using a four-channel light emitting diode (LED4D120, Thorlabs, Newton, NJ, USA) with a multiband filter set
LF405/488/532/635-A-000, Semrock, Rochester, NY, USA) and images were captured using a Zyla 5.5 sCMOS camera (Andor, Windsor, CT, USA). Confocal microscopy was performed on a Leica SP5
inverted confocal point scanning microscope at the UW Biology Imaging Core using a 10 × 0.4 NA air objective lens (Leica, Nussloch, Germany), 20 × 0.7 NA air objective (Leica), and a 63 ×
1.2 NA water immersion objective (Leica). MOUSE KIDNEY DISSECTION AND PREPARATION All experimental protocols and methods in this work involving animals were approved by and conducted in
accordance with all guidelines and regulations set forth by the Institutional Animal Care and Use Committee at the University of Washington. At approximately 2 months old, female mice
(strain C57BL/6) were sacrificed by suffocation with CO2 followed by cervical dislocation. Kidneys were immediately removed and the renal capsule was stripped off. The kidneys were then
halved longitudinally and immersed in 4% PFA in PBS for 1 hour at room temperature. They were then washed with PBS and sliced to 100 µm thickness using a vibratome. The slices were stored in
PBS at 4 °C until staining. CONFETTI-MOUSE KIDNEY DISSECTION AND PREPARATION All experimental protocols and methods in this work involving animals were approved by and conducted in
accordance with all guidelines and regulations set forth by the Institutional Animal Care and Use Committee at the University of Washington. NPHS2Cre/R26R-ConfettiTG/WT (podocin/cre
recombinase/confetti) mice were used to provide permanent and stochastic expression of one of four fluorescent colored reporters in podocytes. These colors were cytoplasmic targeted red
fluorescent protein (cRFP), membrane targeted cyan fluorescent protein (mCFP), nuclear targeted green fluorescent protein (nGFP) or cytoplasmic targeted yellow fluorescent protein (cYFP).
Mice were sacrificed with an overdose of Ketamine/Xylazine, cardiac perfused with 10–15 mL of ice cold phosphate buffered saline (PBS) at 25 inches of gravity pressure (47 mmHg or 63 mbar)
through a 21 G butterfly infusion set (UW IACUC 2968–04). Kidneys were placed into 4% paraformaldehyde in PBS (PFA, Affymetrix, Santa Clara, CA) for 45 minutes, washed briefly in PBS, placed
in 30% sucrose in PBS (Sigma-Aldrich, St Louis, MO) overnight, blotted dry, embedded in Tissue-Tek® O.C.T. Compound (VWR, Radnor, PA), and frozen in a 100% ethanol/dry ice bath. Kidney
slices (50 µm thickness) were obtained using a Leica CM1850 cryostat, placed into 24-well culture dish and stored at −80 °C until staining. Tissue slices were fixed for 1 h in 3% PFA in PBS
at room temperature for 1 h and then washed with PBS prior to immunostaining. HUMAN KIDNEY TISSUE PREPARATION De-identified non-tumoral human kidney tissue samples from individuals
undergoing nephrectomy for a kidney tumor and no history of other kidney disease were obtained from NW Biotrust under a protocol approved by the University of Washington Institutional Review
Board with informed patient consent. All experimental protocols and methods involving human tissue were performed in accordance with the guidelines and regulations set forth by the
University of Washington Institutional Review Board. The samples were cut to be ~1 mm3 and immersed in 4% PFA in PBS for 1 h at room temperature. The tissue was then washed with PBS and
sliced to 100 µm thickness using a vibratome. The slices were stored in PBS at 4 °C until staining. TISSUE IMMUNOSTAINING AND PRE-EXPANSION MA-NHS TREATMENT Both human and mouse kidneys were
stained using the following protocol. 100-µm-thick kidney slices were first incubated in blocking/permeabilization buffer (3% BSA and 0.1% Triton X-100 in PBS) for at 6–12 h at 4 °C. The
slices were then incubated with primary antibody diluted in blocking/permeabilization buffer (see Supplementary Table 1 for dilutions) for 18–24 h at 4 °C and were then washed with
blocking/permeabilization buffer three times at room temperature (15 min each). The tissues were then incubated in fluorescently labeled secondary antibodies diluted in
blocking/permeabilization buffer for 18–24 h at 4 °C. The slices were then washed three times with PBS at room temperature (15 min each). Nuclear staining was performed with Hoechst 33342
according to manufacturer instructions. Tissues were then incubated in 1 mM MA-NHS in PBS (diluted freshly from a 1 M stock in DMSO) for 1 h at room temperature followed by three washes with
PBS. TISSUE GELATION After immunostaining and treatment with MA-NHS, the tissue slices were incubated in monomer solution (1× PBS, 2 M NaCl, 2.5% (wt/wt) acrylamide, 0.15% (wt/wt)
N,N′-methylenebisacrylamide, 8.625% (wt/wt) sodium acrylate) for at least 1 h at 4 °C. The tissues were then placed on a clean #1.5 coverglass and the excess liquid was removed from the
sample. A concentrated stock of TEMPO at 1% (wt/wt) in water was diluted in monomer solution to a final concentration of 0.01% (wt/wt). TEMPO acts as an inhibitor to the gelation reaction to
allow complete diffusion of the monomers through the tissue. Concentrated stocks of APS and TEMED at 10% (wt/wt) in water were also diluted alongside the TEMPO in monomer solution to final
concentrations of 0.2% (wt/wt) with APS added last. The gelation solution was gently applied to the tissue so that the sample did not leave the surface of the glass. Two stacked small pieces
of #1.5 coverglass were placed on either side of the sample and another whole coverglass was placed on top to create a tissue gelation chamber. Tissues were incubated in a humidified
environment at 37 °C for 1.5–2.5 h. The chambers were disassembled leaving the gelled sample on one piece of coverglass. The excess gel and glass around the sample was cut and removed for
digestion. MOUSE KIDNEY DIGESTION, EXPANSION, AND NUCLEAR RESTAINING Gelled mouse kidney samples were transferred to at least 1 mL of proteinase digestion buffer (1× TAE buffer, 0.5% Triton
X-100, 0.8 M guanidine HCL) containing 8 units mL−1 proteinase K and were digested at 37 °C overnight. The gels were then washed in PBS and transferred to collagenase buffer (1× HBSS + 0.7
mM CaCl2) with 5 mg mL−1 collagenase (at least 1 mL total volume). Next, the samples were digested overnight at 37 °C. After digestion, the samples were placed in DI water to expand
(typically 30 min with 1–2 water exchanges). Nuclear staining with Hoechst 33342 was performed again (using water as a solvent) at this stage as well. It should be noted that larger samples
may require larger volumes of digestion solutions for complete homogenization. HUMAN KIDNEY DIGESTION, EXPANSION, AND NUCLEAR RESTAINING Gelled human kidney samples were transferred to at
least 1 mL of 200 mM Tris buffer (pH 8) containing 1 mg mL−1 elastase and were allowed to digest at 37 °C overnight. The samples were washed with PBS and transferred to proteinase digestion
buffer containing 8 units mL−1 proteinase K. The samples were digested at ~65 °C overnight. The digestion buffer and proteinase were removed and refreshed the next day and the samples were
allowed to again digest overnight at 65 °C. After washing with PBS, the samples were digested overnight at 37 °C in collagenase buffer with 5 mg mL−1 collagenase. The samples were then
transferred to DI water for expansion. Nuclear staining with Hoechst 33342 was performed again (using water as a solvent) at this stage as well. EXPANDED SAMPLE HANDLING The gels were
immobilized on glass as follows. Rectangular #1.5 coverglasses were plasma cleaned and coated with poly lysine by spreading an aqueous solution of poly lysine over their surface and allowing
them to air dry. Gels were cut to fit on the rectangular coverglass and the excess water was removed by wicking it away from the edges with tissue paper. The gels were then gently placed
onto the poly lysine glass by sliding the gel off an untreated piece of glass using a low contact angle with respect to the treated glass to avoid sample bending. The immobilized gels were
then immediately imaged. IMAGE VISUALIZATION Fiji and Imaris (Bitplane) were used for visualization of all images acquired in this study. CORRELATIVE IMAGE ANALYSIS Quantitative distortion
analysis was performed as described previously7. Briefly, pre- and post-expansion images of the same region were first aligned using a rigid transformation (similarity, linear) to roughly
align the images and determine the expansion factor. Next, a non-rigid (B-spline, non-linear) transformation was applied to the post-expansion image so that it matched the pre-expansion
image (see also Fig. S2). FOOT PROCESS WIDTH MEASUREMENT BY TRACING METHOD Areas of expanded, podocin-stained tissue samples were first isolated based on their flatness in the image plane.
Areas that remained within a thickness of 0.75 µm (distance in pre-expansion units) were chosen for further analysis while others were rejected to avoid projection artifacts. The podocin
signal in the maximum intensity projections of the selected areas were then traced in ImageJ and the length of the traces was recorded. Dividing the area of analysis by the length of trace
it contained gave the average foot process width. FOOT PROCESS WIDTH MEASUREMENT FROM CROSS-SECTIONAL PROFILES Using the above method to ensure the area of interest was oriented flat with
respect to the image plane, we obtained line profiles in the podocin channel of expanded kidney specimens. Line profiles that were perpendicular to the foot processes were chosen for
analysis. The adjacent peak-to-peak distance was measured after fitting the profiles with Gaussian functions to obtain foot process width values. GLOMERULAR BASEMENT MEMBRANE THICKNESS
MEASUREMENT Expanded specimens stained for podocalyxin and a GBM marker (agrin, collagen IV, or vimentin) were used for this analysis. Orthogonal image sections were chosen using the
podocalyxin channel. Podocalyxin stains both the apical side of foot processes as well as endothelial cells, and we used the lack of lateral movement of these features when scrolling through
confocal image stacks to visually confirm the area of interest was perpendicular to the image plane in order to avoid projection artifacts. A line profile perpendicular to the GBM and
spanning its entire thickness was drawn and the cross-sectional profile obtained from the GBM marker channel (either agrin, collagen IV, or vimentin) was fitted with a Gaussian function
whose full width at half maximum was taken to be the GBM thickness. DATA AVAILABILITY The datasets that support the findings of this paper are available from the corresponding author upon
request. REFERENCES * Hughes, L., Hawes, C., Monteith, S. & Vaughan, S. Serial block face scanning electron microscopy—the future of cell ultrastructure imaging. _Protoplasma_ 251,
395–401 (2014). Article PubMed Google Scholar * Plitzko, J. M., Rigort, A. & Leis, A. Correlative cryo-light microscopy and cryo-electron tomography: from cellular territories to
molecular landscapes. _Curr. Opin. Biotechnol._ 20, 83–89 (2009). Article PubMed CAS Google Scholar * Suleiman, H. _et al_. Nanoscale protein architecture of the kidney glomerular
basement membrane. _Elife_ 2, e01149 (2013). Article PubMed PubMed Central Google Scholar * Unnersjö-Jess, D., Scott, L., Blom, H. & Brismar, H. Super-resolution stimulated emission
depletion imaging of slit diaphragm proteins in optically cleared kidney tissue. _Kidney Int._ 89, 243–247 (2016). Article PubMed CAS Google Scholar * Pullman, J. M. _et al_.
Visualization of podocyte substructure with structured illumination microscopy (SIM): a new approach to nephrotic disease. _Biomed. Opt. Express_ 7, 302 (2016). Article PubMed PubMed
Central CAS Google Scholar * Chen, F., Tillberg, P. W. & Boyden, E. S. Expansion microscopy. _Science_ 347, 543–548 (2015). Article ADS PubMed PubMed Central CAS Google Scholar
* Chozinski, T. J. _et al_. Expansion microscopy with conventional antibodies and fluorescent proteins. _Nat. Methods_ 13, 485–488 (2016). Article PubMed PubMed Central CAS Google
Scholar * Tillberg, P. W. _et al_. Protein-retention expansion microscopy of cells and tissues labeled using standard fluorescent proteins and antibodies. _Nat. Biotechnol._ 34, 987–992
(2016). Article PubMed PubMed Central CAS Google Scholar * Ku, T. _et al_. Multiplexed and scalable super-resolution imaging of three-dimensional protein localization in size-adjustable
tissues. _Nat. Biotechnol._ 34, 973–981 (2016). Article PubMed PubMed Central CAS Google Scholar * Unnersjö-Jess, D. _et al_. Confocal super-resolution imaging of the glomeruluar
filtration barrier enables by tissue expansion. _Kidney Int_. https://doi.org/10.1016/j.kint.2017.09.019 (2017). * Kaverina, N. V., Eng, D. G., Schneider, R. R. S., Pippin, J. W. &
Shankland, S. J. Partial podocyte replenishment in experimental FSGS derives from nonpodocyte sources. _Am. J. Physiol.-Ren. Physiol._ 310, F1397–F1413 (2016). Article CAS Google Scholar
* Ramage, I. J. _et al_. Glomerular basement membrane thickness in children: a stereologic assessment. _Kidney Int._ 62, 895–900 (2002). Article PubMed Google Scholar * Jensen, E.,
Gunderson, H. & Østerby, R. Determination of membrane thickness distribution from orthogonal intercepts. _J. Microsc._ 115, 19–33 (1979). Article PubMed CAS Google Scholar * Bjørn,
S. F. _et al_. Glomerular epithelial foot processes and filtration slits in IDDM patients. _Diabetologia_ 38, 1197–1204 (1995). Article PubMed Google Scholar * Toyoda, M., Najafian, B.,
Kim, Y., Caramori, M. L. & Mauer, M. Podocyte Detachment and Reduced Glomerular Capillary Endothelial Fenestration in Human Type 1 Diabetic Nephropathy. _Diabetes_ 56, 2155–2160 (2007).
Article PubMed CAS Google Scholar * Thongboonkerd, V. alternations in renal elastin-elastase system in type 1 diabetic nephropathy identified by proteomic analysis. _J Am Soc Nephrol_
15, 650–662 (2004). Article PubMed CAS Google Scholar * Sterzel, R. B. _et al_. Elastic fiber proteins in the glomerular mesangium _in vivo_ and in cell culture. _Kidney Int._ 58,
1588–1602 (2000). Article PubMed CAS Google Scholar * Neuman, R. E. & Logan, M. A. The determination of collagen and elastin in tissues. _J. Biol. Chem._ 186, 549–556 (1950). PubMed
CAS Google Scholar * Zhao, Y. _et al_. Nanoscale imaging of clinical specimens using pathology-optimized expansion microscopy. _Nat. Biotechnol_, https://doi.org/10.1038/nbt.3892 (2017).
Article PubMed PubMed Central Google Scholar * Puchtler, H. & Meloan, S. N. On the chemistry of formaldehyde fixation and its effects on immunohistochemical reactions. _Histochem.
Cell Biol._ 82, 201–204 (1985). CAS Google Scholar Download references ACKNOWLEDGEMENTS This work was supported by: the University of Washington, a Burroughs-Wellcome Career Award at the
Scientific Interface, NIH grant R01 MH115767 (J.C.V.); NIDDK Diabetic Complications Consortium grants DK076169 and DK115255 (J.C.V., B.N., C.E.A.); NSF Graduate Research Fellowship
DGE-1256082 (T.J.C.); NIH NIDDK: R01 DK097598-01A1, NIH NIA: R01 AG046231-01A1 (S.J.S.). NW BioTrust, a core service for patient consenting, and NWBioSpecimen, a core service for procurement
and annotation of research biospecimens, are supported by National Cancer Institute grant P30 CA015704 (G. Gilliland, principal investigator [PI]), Institute of Translational Health
Sciences grant UL1 TR000423 (M. Disis, PI), the University of Washington School of Medicine and Department of Pathology, and Fred Hutchinson Cancer Research Center. The authors would like to
thank H. Y. Kueh and M. Wither (University of Washington, Seattle, WA) for providing whole mouse kidneys, K. Oda (University of Washington, Seattle, WA) for help with vibratome sectioning,
A. Glaser and J. Liu (University of Washington, Seattle, WA) for the use of Imaris software for rendering 3D animations, and the Biology Imaging Facility at the University of Washington for
imaging assistance. AUTHOR INFORMATION AUTHORS AND AFFILIATIONS * Department of Chemistry, University of Washington, Seattle, Washington, 98195, USA Tyler J. Chozinski, Chenyi Mao, Aaron R.
Halpern & Joshua C. Vaughan * Department of Medicine, Division of Nephrology, University of Washington, Seattle, Washington, 98195, USA Jeffrey W. Pippin & Stuart J. Shankland *
Department of Pathology, University of Washington, Seattle, Washington, 98195, USA Charles E. Alpers & Behzad Najafian * Department of Physiology and Biophysics, University of
Washington, Seattle, Washington, 98195, USA Joshua C. Vaughan Authors * Tyler J. Chozinski View author publications You can also search for this author inPubMed Google Scholar * Chenyi Mao
View author publications You can also search for this author inPubMed Google Scholar * Aaron R. Halpern View author publications You can also search for this author inPubMed Google Scholar *
Jeffrey W. Pippin View author publications You can also search for this author inPubMed Google Scholar * Stuart J. Shankland View author publications You can also search for this author
inPubMed Google Scholar * Charles E. Alpers View author publications You can also search for this author inPubMed Google Scholar * Behzad Najafian View author publications You can also
search for this author inPubMed Google Scholar * Joshua C. Vaughan View author publications You can also search for this author inPubMed Google Scholar CONTRIBUTIONS T.J.C., C.M., A.R.H.,
C.E.A., B.N. and J.C.V. designed experiments. T.J.C., C.M., J.W.P., S.J.S. and B.N. prepared kidney samples. T.J.C., C.M. and A.R.H. performed experiments and analysis. T.J.C., C.M. and
J.C.V. wrote the paper and all authors commented on and edited the manuscript. J.C.V. supervised the project. CORRESPONDING AUTHOR Correspondence to Joshua C. Vaughan. ETHICS DECLARATIONS
COMPETING INTERESTS T.J.C., A.R.H., and J.C.V. have applied for a patent on the chemistry to link fluorescent probes to the hydrogel and report no other competing interests, financial or
non-financial. All other authors report no competing interests, financial nor non-financial. ADDITIONAL INFORMATION PUBLISHER'S NOTE: Springer Nature remains neutral with regard to
jurisdictional claims in published maps and institutional affiliations. ELECTRONIC SUPPLEMENTARY MATERIAL SUPPLEMENTARY MOVIE 1 SUPPLEMENTARY MOVIE 2 SUPPLEMENTARY INFORMATION AND PROTOCOL
RIGHTS AND PERMISSIONS OPEN ACCESS This article is licensed under a Creative Commons Attribution 4.0 International License, which permits use, sharing, adaptation, distribution and
reproduction in any medium or format, as long as you give appropriate credit to the original author(s) and the source, provide a link to the Creative Commons license, and indicate if changes
were made. The images or other third party material in this article are included in the article’s Creative Commons license, unless indicated otherwise in a credit line to the material. If
material is not included in the article’s Creative Commons license and your intended use is not permitted by statutory regulation or exceeds the permitted use, you will need to obtain
permission directly from the copyright holder. To view a copy of this license, visit http://creativecommons.org/licenses/by/4.0/. Reprints and permissions ABOUT THIS ARTICLE CITE THIS
ARTICLE Chozinski, T.J., Mao, C., Halpern, A.R. _et al._ Volumetric, Nanoscale Optical Imaging of Mouse and Human Kidney via Expansion Microscopy. _Sci Rep_ 8, 10396 (2018).
https://doi.org/10.1038/s41598-018-28694-2 Download citation * Received: 15 February 2018 * Accepted: 21 June 2018 * Published: 10 July 2018 * DOI: https://doi.org/10.1038/s41598-018-28694-2
SHARE THIS ARTICLE Anyone you share the following link with will be able to read this content: Get shareable link Sorry, a shareable link is not currently available for this article. Copy
to clipboard Provided by the Springer Nature SharedIt content-sharing initiative