Corresponding Assessment Scenarios in Laboratory and on-Court Tests: Centrality Measurements by Complex Networks Analysis in Young Basketball Players
- Select a language for the TTS:
- UK English Female
- UK English Male
- US English Female
- US English Male
- Australian Female
- Australian Male
- Language selected: (auto detect) - EN
Play all audios:

Besides technical and tactical aspects, basketball matches involve high aerobic and anaerobic capacities, conferring the final performance of a team. Thus, the evaluation of physical and
technical responses is an effective way to predict the performance of athletes. Field and laboratory tests have been used in sports. The first involving high ecological validity and low
cost, and the second, greater control and accuracy but not easy application, considering the different preparation phases in a season. This study aimed, through complex networks analysis, to
verify whether centrality parameters analysed from significant correlations behave similarly in distinct scenarios (laboratory and on-court), emphasizing aerobic and anaerobic physical
parameters and technical performances. The results showed that, in a compelling analysis involving basketball athletes, the studied centralities (degree, betweenness, eigenvector and
pagerank) revealed similar responses in both scenarios, which is widely attractive considering the greater financial economy and lower time when applying tests in the field.
In basketball games, despite the large participation of the aerobic energy system during matches1,2, undoubtedly the high power tasks, which include fast running and vertical jumps,
predominate the actions and define the final results in competitions3. Thus, in terms of physical capacities to be evaluated in athletes of this modality, remarkable emphasis has been given
to the more anaerobic parameters, which include the use of anaerobic power determination protocols3. Still, in basketball matches and in addition to this physiological aspect, high demand
for tasks includes accelerations, decelerations and changes in direction in the more than 1000 intermittent actions (one every 2 seconds) performed during the game4. Together, these aspects
are even more critical in young athletes, as they need, through physical and technical training, to develop physical conditions capable of supporting such demands in high performance and
preventing injuries5. In this sense, the employment of more appropriate ergometers on data acquisition related to running force, velocity and power should better guide the training and
mechanical and metabolic evaluation processes specific to anaerobic power. The semi-tethered6,7 and tethered8,9,10 running performed in the field and laboratory includes a high-frequency
signal acquisition system with elevated sensitivity and accuracy, allowing, especially at the high-level performance, to obtain trustworthy and detailed information in an inter- and
intra-athlete evaluation process. On the other hand, although such evaluations performed, especially inside laboratories, can be considered relevant to the development of performance sport
and used in different parts of the world, it is necessary that other and complementary models of evaluation and implementation of training loads be applied. These field protocols that can be
present in the routine training sessions include slightly less robust evaluations, but which define greater methodological simplicity and ecological validity in their accomplishments. In
the laboratory, the maximal 30 s tethered running test was developed to give greater specificity to this movement, in an analysis pattern similar to that proposed by Bar-Or11 in the cycle
ergometer, and has been applied with very good resolutions12,13. In a very well applied field scenario, the running anaerobic sprint test (RAST) was suggested to obtain the same parameters
as those of the laboratory, allowing greater agility in the anaerobic parameter evaluation processes. The RAST was validated14 and applied to basketball in its original form15 and adapted to
the dimensions of the basketball court16, obtaining success in the evaluation of athletes of this modality. However, it is doubtful for both laboratory and basketball court scenarios
whether such assessments are indeed compatible and appropriate to the sport when included in a more dynamic model that may involve aerobic capacity as well as anthropometric and performance
parameters, such as the vertical jump, and determining the technical skill of shooting the basketball. This open question was addressed in the present study by applying centrality
distributions in complex networks. Thus, the objective of the present study was to apply and compare, in two different scenarios L (laboratory, all-out 30 s, AO30s) and C (on-court, RAST),
the degree, betweenness, eigenvector and pagerank centrality metrics in a complex networks model capable to verify the relationship of mechanical anaerobic responses obtained in each
scenario (L and C) with the other (common) physiological, anthropometric and technical parameters in young male basketball athletes. It was hypothesized that the centrality measurements
showed similar responses between both the L and C scenarios.
Thirteen male basketball players participated in the study (age 15 to 20 years old, body mass 71.7 ± 11.3 kg, height 1.8 ± 0.1 m, fatty mass 8.4 ± 5.0%). All subjects have participated in
the sport for at least 2 years, training daily (5 days a week) and participating uninterruptedly in regional- or state-level competitions in the last 12 months. The subjects were basketball
players of the base teams of two traditional Brazilian high-level clubs of this sport. The basketball players did not present pathologies or aggravations, as well as recent osteoarticular
injuries. The subjects were recruited by invitation and signed or had their legal guardian sign their agreement to participate in the study. This study was conducted in agreement with
ethical recommendations of the Declaration of Helsinki, and all experiments were approved by the Research Ethics Committee of the School of Medical Sciences (protocol number
69680217.3.0000.5404).
For this study, three evaluation sessions were accomplished. Participants were instructed to replicate their food intake prior to each experimental trial. The participants were asked to
refrain from exhaustive exercise as well as ingestion of alcohol and neuroexcitatory substances 48 h prior to each evaluation session. These recommendations were taken to avoid or at least
minimize bias in the results. During the first session, the participants underwent anthropometric and body composition evaluations. Body density was estimated using the generalized equation
of Jackson and Pollock17 (height, body mass and abdominal, suprailiac, tricipital and subscapular skinfolds) and converted to body fat percentage using the equation of Siri18. Then, the
athletes underwent a standardized warm-up consisting of low intensity running on a treadmill (5 minutes at 7 km/h) followed by three countermovement jumps on a force platform. After this,
the athletes were submitted to a tethered running familiarization on a flat non-motorized treadmill (NMT). This familiarization consisted of three maximal 10 s running with two minutes rest
among efforts.
At the second visit to the laboratory, the participants were kept at rest for 10 minutes, and then underwent the same warm-up as the first visit. After a 5 minutes recovery, the athletes
were submitted to all-out running for 30 s on the NMT.
Finally, the third evaluation session was carried out on the basketball court and initiated with similar warm-up and recovery procedures. After that, participants performed the basketball
technical test, consisting of the shooting basketball performance protocol (SBPP), with 10 two-point shots at five different places on the court. After 45 minutes, the athletes underwent the
same warm-up and recovery when starting the running anaerobic sprint test (RAST). Next, and using the RAST as acidosis inducer, the anaerobic threshold (AT, aerobic capacity) determination
was accomplished using the lactate minimum protocol, according to Camargo et al.16. So, the experimental design included two scenarios for complex networks analysis with analogous anaerobic
parameters, one obtained from laboratory procedures and the other at the basketball court. Both scenarios also included the “common” parameters, including anthropometric characteristics,
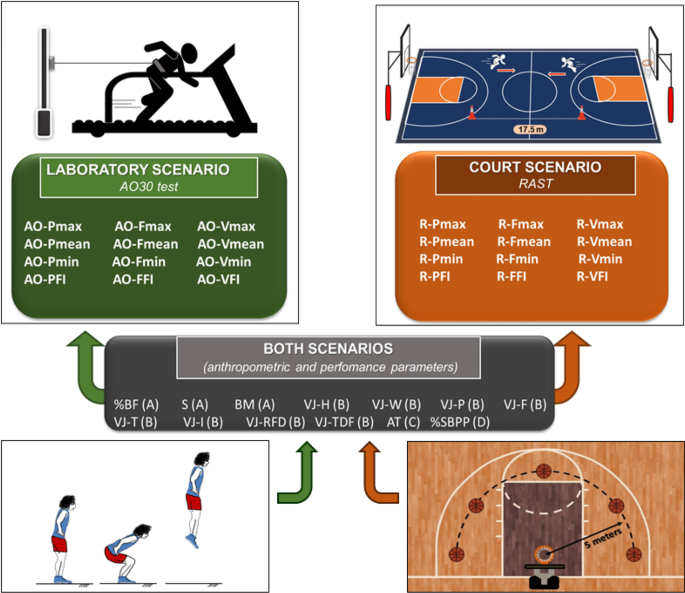
countermovement jumps, aerobic capacity and basketball technical shot performances. Figure 1 shows the common and scenario-specific parameters.
Specific parameters to Scenarios 1 (laboratory) and 2 (on-court), and the common parameters used in complex networks applied in both scenarios. The parameters at the same line (to Scenarios
1 and 2) are equivalents in mechanical terms. The common parameters include anthropometric characteristics (A) and countermovement jumps (B), anaerobic threshold (C) and technical
performances (D). Legend - Scenario 1 (laboratory): AO-Pmax = All-out 30 s maximal power, AO-Pmean = All-out 30 s mean power, AO-Pmin = All-out 30 s minimum power, AO-PFI = All-out 30 s
power fatigue index, AO-Fmax = All-out 30 s maximal force, AO-Fmean = All-out 30 s mean force, AO-Fmin = All-out 30 s minimum force, AO-FFI = All-out 30 s force fatigue index, AO-Vmax =
All-out 30 s maximal velocity, AO-Vmean = All-out 30 s mean velocity, AO-Vmin = All-out 30 s minimum velocity, and AO-VFI = All-out 30 s velocity fatigue index. Scenario 2 (on-court):
R-Pmax = RAST maximal power, R-Pmean = RAST mean power, R-Pmin = RAST minimum power, R-PF I = RAST power fatigue index, R-Fmax = RAST maximal force, R-Fmean = RAST mean force, R-Fmin = RAST
minimum force, R-FFI = RAST force fatigue index, R-Vmax = RAST maximal velocity, R-Vmean = RAST mean velocity, R-Vmin = RAST minimum velocity, and R-VFI = RAST velocity fatigue index.
Common parameters to both scenarios: %BF = percentage body fat, S = height, BM = body mass, VJ-H = vertical jump height, VJ-W = vertical jump work, VJ-P = vertical jump power, VJ-F = peak
vertical jump force, VJ-T = vertical jump time, VJ-I = vertical jump impulse, VJ-RFD = peak rate of jump force development, VJ-TFD = time of jump force development, AT = anaerobic threshold,
and %SBPP = success percentage of the shooting basketball performance protocol.
The athletes performed three maximal countermovement jumps (15 s among them) without aid to the arms on a force platform (signal capture of 1000 Hz). The force signals that the subject
reached during the highest vertical jump (VJ-H) were chosen to determine other parameters using an algorithm in the MATLAB environment. Thus, in addition to the VJ-H, the vertical jump (VJ)
variables were determined as work (VJ-W), power (VJ-P), force (VJ-F), time (VJ-T), impulse (VJ-I), rate of jump force development (VJ-RFD) and time of jump force development (VJ-TDF). All
results from these parameters were included in the complex networks analysis in both the L and C scenarios (Fig. 1).
During the 30 s test, the subjects ran tethered to a horizontal force determination system by a calibrated sensor attached to the structure positioned behind the treadmill. Another set of
force sensors (four load cells) were positioned at the base of the treadmill, aiming to obtain the vertical force component applied by the athletes throughout running. Thus, the force
resultant was obtained by the vector sum of the vertical and horizontal sensor responses. All records were captured at 1000 Hz. The treadmill was also equipped with Hall-effect sensors to
determine the linear displacement and thus velocity, and all signals were synchronized and conditioned by an extensometer source and integrator module (National Instruments). The records
were captured by LabVIEW SignalExpress software, and the signals were analysed from an algorithm in the MATLAB environment. Power was obtained by the product of force and velocity data from
the flat NMT ergometer. For this evaluation, upon arriving at the laboratory, the athletes were kept at rest for 10 minutes and then underwent the warm-up, running at 7 km/h for 5 minutes,
and then kept at rest for 5 more minutes. After this, the athletes were tied by the waist to an inextensible cable (linked to the horizontal force sensor) and instructed to run as fast as
possible for 30 s on the NMT. The participants were verbally encouraged to maintain the maximal speed throughout the all-out test. Data obtained from this analysis were the maximal, mean and
minimum power, force and velocity measurements, as well as fatigue indexes (FIs) for each one of these mechanical parameters. The FI was obtained as the percentage of the difference from
highest to lowest value divided by the highest result.
The SBPP technical performance test was arranged according to the two-point stationary test validated by Posjkic et al.19. SBPP consisted of 10 jump shots at five different positions on the
basketball court (see Fig. 1, shooting positions), which were all five metres away from the centre of the rim of the basket. This protocol evaluated the shooting performance (percentage of
success) of basketball players in a static condition, keeping the athlete at each position as shown in Fig. 1, and when the athlete would receive the ball from a partner under the basketball
table, jumped and shot the ball toward the basket. The shots were accomplished after a 10 minutes warm-up freely shooting balls toward the basket at different distances. Only after this,
the athletes were informed of the protocol and the placement of shots. Throughout the test, the athletes shot the balls continuously (two balls for each place) while changing the shooting
position until the final shot (10th ball). There was no time limit to complete the shots.
The RAST that was adapted consisted of six maximal 35 m running round trips, divided into two 17.5 m shuttle runs, and interspaced by 10 s of rest16. The times (t) obtained for each effort
were recorded manually by an experienced appraiser using a digital stopwatch, positioned at the finish line, to determine the mean velocity (V = 35/t) of each sprint, as well as acceleration
(a = V/t), force (F = body mass × a) and power (P = F × V). Like the laboratory all-out 30 s protocol, the athletes were verbally encouraged to maintain the maximal speed in each sprint.
So, the mean, maximal and minimum values were determined to the same mechanical parameters as in the laboratory test. The fatigue index was determined for each V, F and P, by the percentage
decrease from the maximal value to the minimum value. Blood samples (25 µL) were collected from the earlobe at rest and after 3, 5, and 7 minutes to determine the peak lactate concentrations
([LAC]) (YSI 2300 STAT Plus).
To determinate the AT parameter, the lactate minimum protocol was applied. So, after 8 minutes of passive recovery from the RAST and the hyperlactatemia phase, an incremental intensity test
was started on-court using metronome-controlled 20 m shuttle runs. The initial velocity was equivalent to 8 km/h, and 1 km/h was added every 3 minutes until exhaustion. Verbal instruction
was given throughout the test with emphasis at the moment of the intensity increase, so that the velocity adjustment was attained. Blood samples (25 µL) were collected from the earlobe after
each step of the incremental intensity test. Thus, at the end of each intensity in the incremental test, blood samples (25 µL) were collected to determine [LAC] (YSI 2300 STAT Plus). Blood
lactate values were plotted against time from peak concentration, and the second order polynomial fit was determined, as well as exercise intensity when the derivative of this function was
null15. This intensity can be considered the AT, which is the maximal running aerobic capacity.
Analysis by complex networks was performed using software (Gephi 0.9.2) after data processing by specific algorithm for this purpose in the MATLAB environment. The networks presented 25
nodes and, like a threshold as generally purposed on correlation networks construction20, their edges were obtained by the statistically significant “r” values (P