Hydrogen isotope analysis in w-tiles using fs-libs
- Select a language for the TTS:
- UK English Female
- UK English Male
- US English Female
- US English Male
- Australian Female
- Australian Male
- Language selected: (auto detect) - EN
Play all audios:

ABSTRACT Laser-Induced Breakdown Spectroscopy (LIBS) is a promising technology for in-situ analysis of Plasma-Facing Components in magnetic confinement fusion facilities. It is of major
interest to monitor the hydrogen isotope retention i.e. tritium and deuterium over many operation hours to guarantee safety and availability of the future reactor. In our studies we use
ultraviolet femtosecond laser pulses to analyze tungsten (W) tiles that were exposed to a deuterium plasma in the linear plasma device PSI-2, which mimics conditions at the first wall. A
high-resolution spectrometer is used to detect the Balmer-\(\alpha\) transition of the surface from implanted hydrogen isotopes (H and D). We use Calibration Free CF-LIBS to quantify the
amount of deuterium stored in W. This proof-of-principle study shows the applicability of femtosecond lasers for the detection of low deuterium concentration as present in first wall
material of prevailing fusion experiments. SIMILAR CONTENT BEING VIEWED BY OTHERS HYDROGEN ISOTOPES RETENTION STUDIES USING LASER AND MICROWAVE INDUCED PLASMA COUPLING Article Open access 12
April 2025 HIGH SENSITIVITY HYDROGEN ANALYSIS IN ZIRCALOY-4 USING HELIUM-ASSISTED EXCITATION LASER-INDUCED BREAKDOWN SPECTROSCOPY Article Open access 09 November 2021 ANALYSIS OF GADOLINIUM
OXIDE USING MICROWAVE-ENHANCED FIBER-COUPLED MICRO-LASER-INDUCED BREAKDOWN SPECTROSCOPY Article Open access 24 March 2023 INTRODUCTION The Plasma-Facing Components (PFCs) of a magnetically
confined fusion vacuum chamber are exposed to extreme environmental conditions including extraordinary high temperature, radiation, and high energy particle fluxes. All those circumstances
will lead to surface erosion, particle deposition, and potentially destruction with a resulting higher likelihood of fuel retention during the fusion-plasma operation1,2,3. To ensure the
safety and tritium self-sufficiency of an upcoming fusion reactor, the total absorbed amount of deuterium and tritium inside of the PFCs need to be tracked in-situ over many operation hours.
The use of Laser-Induced Breakdown Spectroscopy (LIBS) has been proposed4, as it has also numerous applications in hands-off, low invasive diagnostics like nuclear waste management5 or
material analysis in current and upcoming mars missions6. Especially, when it comes to the detection of minor elements and high depth resolution applications, LIBS appears as a powerful
tool7,8,9. One requirement for a quantitative LIBS method is a reduced heat diffusion to the bulk material by the laser pulses so that stoichometric approximations might hold, when the
expanding plasma is analyzed. To ensure this and to achieve a high depth resolution, the use of a laser pulse duration shorter than picoseconds is a preferred solution10. In this work we
used UV ultra-short laser pulses for laser plasma generation in an argon environment, coupled with optical emission detection with a high spectral resolution Czerny-Turner spectrometer. The
detection method here is similar to studies by Kurniawan et al.11. This system capabilities combined with a CF-LIBS approach allowed detection and quantification of the hydrogen and
deuterium content of tungsten tiles exposed to a deuterium plasma in the linear plasma device PSI-2 at Forschungszentrum Jülich12. These tiles serve as surrogates for PFCs in this context.
The deuterium content calculated with CF-LIBS was directly compared to results obtained with Thermal Desorption Spectroscopy (TDS). The UV wavelength of \(343\,{\mathrm{nm}}\) and the pulse
duration of \(500\,\mathrm{fs}\) were chosen to work towards the highest possible depth resolution, which is promising due to the small optical penetration depth of \(7.4\,{\mathrm{nm}}\) in
tungsten13. This work serves as a proof-of-principle for in-situ quantification of isotopes of hydrogen for future application in plasma-facing components in confinement fusion experiments.
RESULTS AND DISCUSSION The following experiments are executed with the setup described in detail in the methods section. Here, an argon gas flow, according to similar findings14, is used to
enhance the observed plasma emission. The heavier Ar atoms in the ambient gas (compared to nitrogen atoms in air) around the expanding plasma lead to a longer plasma persistence. This and a
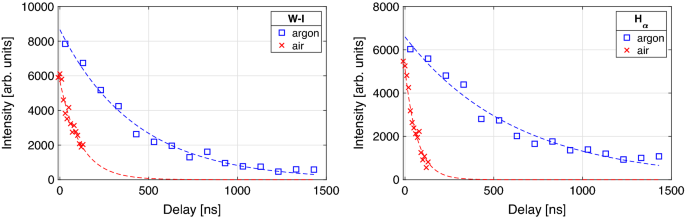
higher plasma temperature lead to stronger line emission. Figure 1 presents the temporal evolution of the emission of neutral tungsten (W-I at \(643.97\,{\mathrm{nm}}\)) and hydrogen
Balmer-\(\alpha\) (\(\text{H}_\alpha\) at \(656.28\,{\mathrm{nm}}\)) from the tiles surface using air and an argon flow in the ambient atmosphere. We observe an increase in half-life of more
than a factor of two. This results in a significant signal enhancement. The electron number density \(n_e\) and heavy particle temperature \(T_h\) in the plasma are determined by observing
the \(\text{H}_\alpha\) peak. The FWHA (Full Width at Half Area) line broadening contains information on \(n_e\) using equation (5) and the Doppler width (4) is used to determine \(T_h\).
This temperature can be compared to the electron temperature in the plasma \(T_e\) determined by the Boltzmann-plot method. In Local Thermodynamic Equilibrium (LTE) conditions these
temperatures can be assumed to be equal \(T_h=T_e=T\). Before we discuss the experimental requirements that are necessary to observe the deuterium impact on the exposed tungsten tiles, the
temporal optical emission of the laser-induced plasma in this experiment is presented using a laser fluence of \(31\,{\mathrm {J/cm}}^2\). This value is significantly above the ablation
threshold of tungsten \(F_{th}=(0.07\pm 0.06)\,\mathrm {J/cm^2}\), determined according widely applied procedure13,15,16,17. Figure 2 shows the temporal evolution of the spectra observed in
this configuration with a spectrometer of instrumental broadening \(w_{inst}=52\,{{\mathrm{pm}}}\) (Gaussian width) at a slit size of \(100\,\mu \mathrm{m}\). Here, the instrumental
broadening of the used device is determined by the spectral lines widths of a low pressure iron (Fe) Hollow Cathode Lamp (HCL). The spectral lines used for the Boltzmann-plot method are
given in table 1. Moreover, we can observe several atomic tungsten lines and the hydrogen Balmer-\(\alpha\) transition (\(\text{H}_\alpha\)). The temperatures, calculated using the
Boltzmann-plot method and the Doppler Broadening, similar to other recent evaluations of LIBS data19,20,21, are given in Fig. 3 (left) for gate delays larger than \(400\,{\mathrm{ns}}\). The
electron number density is evaluated by observing the FWHA of the \(\text{H}_\alpha\) line and is exponentially decreasing from \(2.5\times 10^{17}\,{\mathrm{cm}}^{-3}\) by one order of
magnitude in the first \(800\,{\mathrm{ns}}\) as shown in Fig. 3 (right). Note that the observed hydrogen Balmer-\(\alpha\) line interferes with a tungsten line at \(656.32\,{\mathrm{nm}}\)
and the weak signal from the low concentration deuterium \(\text{D}_\alpha\) at \(656.1\,{\mathrm{nm}}\). Most likely, the pseudo-Voigt fit is influenced by these disturbances and the
calculated temperature and density values may be overestimated. Summing up the result of the plasma observation from the given material, the plasma temperature and number density decreases
with time as expected. The parameters are in the range of \(T_e\approx 15,000\,\mathrm{K}\) to \(T_e\approx 10,000\,\mathrm{K}\) (Boltzmann-plot method) and \(n_e\approx 2.5\times
10^{17}\,{\mathrm{cm}}^{-3}\) to \(n_e\approx 10^{16}\,{\mathrm{cm}}^{-3}\). Note that the evaluated temperatures for delays lower than \(400\,{\mathrm{ns}}\) are strongly deviating from
reasonable values, that is why they are not plotted here. One reason for this is the high plasma density in the early expansion phase that brings a higher self-absorption and effects like
opacity broadening22 leading to an overestimation of the spectral width of the hydrogen emission. Another explanation might be given by the differences in the first ionization potential of
tungsten (\(7.86\,{\mathrm{eV}}\)) and hydrogen (\(13.598\,{\mathrm{eV}}\)) that influences the atom to ion proportion according to the Saha equation. As an example, the ionization rate
\(N_{ion}/N_{tot}\) is significantly higher for tungsten (factor 20) with \(T\approx 12,000\,\mathrm{K}\) and \(n_e\approx 10^{17}{\mathrm{cm}}^{-3}\). Similar observations were made by
Giacomo et al. (2008)23 who observed the hydrogen emission in an aluminum plasma. The higher influence of the continuum radiation can also be observed in this regime, as well as a high
plasma speed that can lead to blue shifts, slight broadening, and line asymmetry. Hence, the plasma parameters observed after \(400\,{\mathrm{ns}}\) are typical values for laser-induced
plasmas in an argon environment24. One important takeaway from the presented measurement is the transient character of the plasma observed by the exponential decrease of the number density.
This is also the critical point that has to be considered, when we apply a LTE to the observed plasma. The question is whether the relaxation time \(\tau _{rel}\) and corresponding diffusion
length \(\lambda =(D_h\cdot \tau _{rel})^{1/2}\) can be covered25. Here, \(D_h\) is the material dependent diffusion coefficient. Typical values for metals are on the order of \(\tau
_{rel}\sim 10^{-9}\,\mathrm{s}\) and \(\lambda \sim 10^{-5}\,\mathrm{m}\). The plasma persistence (about a few micro seconds) and plasma size (even larger than the beam diameter \(\sim
20\,\mu \mathrm{m}\)) of the observed expansion suggests that a LTE is reasonable in the recombination part of the process. Moreover, the McWhirter criterion in Eq. (2) is a necessary but
not sufficient condition to be fulfilled. As an example it is calculated for the tungsten plasma observed with a delay of \(830\,{\mathrm{ns}}\): \(T_e\approx 10,000\,\mathrm{K}, n_e\approx
4.7\times 10^{16}\,{\mathrm{cm}}^{-3}\) and \(\Delta E_{mn}\approx 3\,{\mathrm{eV}}\) fulfills the condition as \(n_e>4.3\times 10^{15}\,{\mathrm{cm}}^{-3}\). With this knowledge about
the process, we proceeded with the detection and evaluation of the hydrogen Balmer-\(\alpha\) transition from the tungsten tile with the high resolution spectrometer (instrumental broadening
\(w_{inst}=12.7\,{\mathrm{pm}}\) at slit width of \(120\,\mu \mathrm{m}\) determined by a deuterium lamp). In Fig. 4 the detected LIBS signals of a tungsten tile exposed to the deuterium
plasma in PSI-2 as in Jiang et al. (2021)12 is compared to an unexposed tile. In blue the accumulated LIBS emission data from 80 independent single pulse interactions on the unperturbed
sample surfaces are plotted and in orange the sum of all measurements from laser pulse number 2 to 5 on the same positions. First of all, a distinct deuterium line at
\(656.1\,{\mathrm{nm}}\) is detected in the exposed tile (left), while in the unexposed tile (right) only the hydrogen line at \(656.28\,{\mathrm{nm}}\) can be observed. The presence of the
hydrogen line in both tiles is most likely attributed to adsorbed moisture on the surface and hydrogen remaining in the bulk. Moreover, it is important to point out that after the first
laser pulse no Balmer-\(\alpha\) line can be detected. Only the atomic tungsten line at \(656.32\,{\mathrm{nm}}\) can be observed. Applying a pseudo-Voigt fit of the superposition of
\(\text{H}_\alpha , \text{D}_\alpha\) and the W-I line allows us to compare the broadening effects on the heavy and regular hydrogen atoms. Here, we observe FWHM of \(\Delta \lambda
_{H}=231\,{\mathrm{pm}}\) and \(\Delta \lambda _{D}=140\,{\mathrm{pm}}\) respectively. This discrepancy can be explained by different reduced masses \(\mu\) of the collision partners
influencing the Stark effect and the dependency of the Doppler width on the atomic mass as \(\sim \sqrt{m^{-1}}\). It is known that combination of collision and temperature effects are
responsible for the line broadening26. Observing the corresponding crater for this LIBS measurement provides information on the possible ablation rate that can be applied to this setup.
Figure 5 shows a typical crater produced by five single laser pulses in argon environment on the W-tile. We find that the ablation depth per pulse (depth resolution) that allows us to
observe signals from low-level hydrogen and deuterium concentration is \(600\,{\mathrm{nm}}\). In this configuration the laser beam diameter \(D_0\) is given as \(20\,\upmu \mathrm{m}\).
Integration over the whole crater brings the total ablated volume of \((282\pm 25)\,\upmu \mathrm{m}^3\) for five consecutive laser pulses. The combination of all presented data on the
temporal plasma emission dynamics and the possibility to separate the hydrogen isotopes in the first laser pulse gives us the opportunity to estimate the deuterium impact to the ablation
yield. Here, a quantitative investigation on the deposition is possible and given for the tungsten tiles. The measured temperature can be used to calculate the deuterium and hydrogen
concentration by plotting the measured intensity of the hydrogen Balmer-\(\alpha\) line to the Boltzmann-plot from equation (3). Here, it is assumed that the tungsten and hydrogen subsystems
exhibit the same temperature calculated by the Boltzmann-plot method. The used spectral characteristics of the \(\text{H}_\alpha\) line are presented in Table 1. Note that the measured
intensity needs to be adapted to the sensor sensitivity calibrated by a halogen lamp of defined emission characteristics. The estimations for CF-LIBS mentioned in the methods section are
applied to the calculation. In addition, the composition of the observed plasma in a LTE (delays longer than \(400\,{\mathrm{ns}}\)) is assumed to be purely tungsten, hydrogen and deuterium
atoms. Further impurities on the surface and in the bulk, and the argon atmosphere are ignored. From the intercept of the Boltzmann-plot the concentration of tungsten \(C_W\) and both
hydrogen isotopes \(\text{H}\) and \(\text{D}\) combined \(C_{H \& D}\) can be estimated. The evaluated fraction is given as $$\begin{aligned} \%(\text{H}+\text{D})=\frac{C_{H \&
D}}{C_{H \& D}+C_W}\cdot 100\,\%. \end{aligned}$$ (1) From the high spectral resolution measurement in Fig. 4 and the pseudo-Voigt fits, a ratio of the integrated peak-areas is
calculated as \(\text{D}_{\alpha }/\text{H}_{\alpha }\approx 0.08\). This relation is transferred to the total number ratio of deuterium and hydrogen atoms \(N_D/N_H\) and can then be used
to estimate the total deuterium concentration. With a total ablated volume of \((57\pm 5)\,\upmu \mathrm{m}^3\) per laser pulse, as estimated from the findings in Fig. 5, the total number of
ablated tungsten atoms is calculated as \(N_W=(3.6\pm 0.3)\times 10^{12}\). Taking into account the molar volume of tungsten as \(M_{V,W}=9.47\times
10^{-6}\,\mathrm{m}^{3}{\mathrm{mol}}^{-1}\) and applying Eq. (1), the found concentration values and the total number ratio, the number of hydrogen and deuterium atoms were calculated as
\(N_H=(7.8\pm 3.9)\times 10^{11}\) and \(N_D=(6.2\pm 2.8)\times 10^{10}\) respectively, as average values determined by the detected spectra with delay \(>400\,{\mathrm{ns}}\). Here, the
uncertainties are just statistical variations and have to be extended by the mentioned approximations and deviations of the ablated volume. This includes that the value is probably more an
upper limit due to the overestimated Balmer-\(\alpha\) intensity that is influenced by a \(\text{W}\)-I line. Considering this, the value holds up to a comparison to the TDS data. The total
number of deuterium atoms detected in the whole sample is estimated as \((3.8\pm 0.8)\times 10^{16}\). Here, an accuracy of around \(21\%\) is calculated. From this we expect up to \((1.2\pm
0.2)\times 10^{11}\) atoms on the laser irradiated spot in the LIBS experiment, which is a factor two larger than what we calculated by the CF-LIBS approach. This deviation might result
from the uncertainty of the two methods, as it can be expected from studies on PSI-227 that deuterium is only stored in depths of around \(100\,{\mathrm{nm}}\). Also note that the deuterium
distribution along one dimension of the tiles surface is not homogeneous due to the plasma gradient given in the exposure process. This can result in an over or underestimation of the
expected deuterium number depending on the position on the tile. The presented measurement is executed close to the center of the tile and along the axis where we do not expect significant
changes in the deposition. In conclusion, the presented CF-LIBS method can be used to determine the deuterium impact in the used W tiles as around \((1.7\pm 0.5)\,\text{at}\%\) in the first
\(600\,{\mathrm{nm}}\) behind the surface with a high lateral resolution of \(\sim 20\,\upmu \mathrm{m}\), according to the crater diameter. CONCLUSION We demonstrated the use of femtosecond
UV LIBS as a prospect high depth resolution diagnostic technique to analyze the hydrogen isotope impurities in metallic samples that are used as PFCs in confinement fusion experiments. With
an ablation rate of \(600\,{\mathrm{nm}}\) per pulse, deuterium and hydrogen can be detected with this method. Here the limitation of femtosecond LIBS can be observed compared to studies
with picosecond lasers that provide a higher pulse energy. In particular, the studies by Oelmann et al. (2021)28 exhibit a depth resolution of \(30\,{\mathrm{nm}}\) in a double-pulse
configuration. With an enormously shorter heat entry to the sample the heat affection by the laser is smaller and desorption of light particles from higher depths is less likely in relation
to ns-LIBS experiments. This will influence quantitative approaches like Xing et al.29, because the ablated volume can not be consulted to calculate the deposited deuterium fraction. The
applied CF-LIBS method here is an interesting quantitative approach to estimate the total deuterium content in the investigated tungsten tiles and is even more significant due to the use of
the femtosecond laser to provide a reasonable depth and high lateral resolution. The estimated deuterium content of approximately \(1.7\,\text{at}\%\) using this method is close to the
expected quantity in the tungsten tiles that were exposed to deuterium plasma. Moreover, similar concentrations of hydrogen retention was found like in the comparable study by Pardede et
al.30. Further studies on this approach with tiles of varying deuterium content would be the next logical step to develop this method and to determine the limit of detection. In addition,
interesting approaches to enhance the detected plasma emission will be beneficial to improve the signal-to-noise ratio31. In conclusion, this work provides insights into the use of
all-optical laser plasma techniques for future in-situ analysis of plasma-facing components in fusion applications. METHODS In the following, the used experimental setup, evaluation methods,
and sample preparation techniques are described. For more details on the determination of ablation threshold fluence of tungsten, and the results from the fitting function, refer to the
provided supplemental information. EXPERIMENTAL SETUP The basic setup of the LIBS experiment is shown in Fig. 6. It consists of a \(\lambda =1030\,{\mathrm{nm}}\), \(500\,\mathrm{fs}\) laser
in single pulse mode and a setup for second and third harmonic generation. In this set of experiments, the third harmonic of the fundamental laser frequency was used at
\(343\,{\mathrm{nm}}\). The generated pulses with an output pulse energy of up to \(100\,\upmu \mathrm{J}\) are focused by a 3x objective lens (working distance \(50\,{\mathrm{mm}}\)) to the
target placed in an experimental cell (\(10\,{\mathrm{cm}}\times 10\,{\mathrm{cm}}\times 5\,{\mathrm{cm}}\)) that can be filled with different gas compositions from an external inlet. Here
an argon gas flow of \(2\,{\mathrm {l/min}}\) is chosen to change the environmental conditions. The whole cell is placed on motorized stages to control the distance between the focusing lens
and the target and to irradiate different positions on the surface. A collection system consists of two plano-convex fused silica lenses (\(f_1=50\,{\mathrm{mm}}\) and
\(f_2=100\,{\mathrm{mm}}\)) and an optical fiber that is coupled to the setup to collect the plasma radiation and image it to the entrance slit of a Czerny-Turner spectrometer. The plasma
emission signal is detected by an iCCD camera. In this work, we studied the time resolved UV femtosecond LIBS emission from tungsten tiles that were exposed to a deuterium plasma in a linear
plasma device, and followed by the detection and quantification of the hydrogen isotopes in these samples. PREPARATION OF W-TILES The material under investigation is pure polished tungsten
(W, \(Z=74\)) with a surface roughness of \(S_a=60\,{\mathrm{nm}}\). The tiles (\(9.9\,{\mathrm{mm}}\times 9.9\,{\mathrm{mm}}\times 5.1\,{\mathrm{mm}}\)) are baked out under \(1000\,^\circ
\mathrm{C}\) for three hours and exposed to deuterium in the linear plasma device PSI-2 at Forschungszentrum Jülich. The tiles are arranged in a circle on a molybdenum mask while the ring
shaped plasma interacts with it. Plasma parameters are detected by a Langmuir probe frequently during the four hour process. The maximum deuterium flux is measured as \(2.9\times
10^{21}\,\mathrm{m}^{-2}\mathrm{s}^{-1}\) with a total fluence of \(3\times 10^{25}\,\mathrm{m}^{-2}\) onto the tile surface heated to a temperature of \(230\,^\circ \mathrm{C}\). The plasma
parameters in the PSI-2 to mimic the fusion plasma are described by Kreter et al.27. From this overview, a deuterium concentration of up to \(2\,{\mathrm {at\%}}\) in the first \(1\,\upmu
\mathrm{m}\) behind the surface is reasonable with the used settings. According to a Thermal Desorption Spectroscopy (TDS) measurement applied ex-situ after the exposure, the total number of
detected deuterium atoms deposited per area in the bulk are given as \(N_D=(3.9\pm 0.8)\times 10^{20}\,\mathrm{m}^{-2}\), and \(N_H=(4.1\pm 1.1)\times 10^{21}\,\mathrm{m}^{-2}\) hydrogen
atoms. The ratio of \(N_D\) to \(N_H\) is with 0.095 close to the calculated value from the high resolution LIBS experiment. EVALUATION OF THE RESULTS In this section we give an overview of
the used methods to evaluate the measured spectra and how to gain more information from the samples under investigation. Calculations of plasma parameters such as temperature and electron
number density are necessary to resolve a spectrum from hydrogen and deuterium impurities in the used metal tiles. Cristoforetti et al.25 showed that the expanding, transient plasma created
by the laser pulse and interacting with the ambient gas can be in a LTE under certain circumstances. This state is a necessary condition to make predictions on the plasma parameters.
Following the conditions formulated there and the criterion given by McWhirter et al.32, $$\begin{aligned} n_e>1.6\times 10^{12} \left( T[\mathrm{K}]\right) ^{1/2} \left( \Delta
E_{mn}[{\mathrm{eV}}]\right) ^3, \end{aligned}$$ (2) the tenability of this state is reviewed. Note that the McWhirter criterion alone is not sufficient in this context. The acceptance of a
LTE allows the application of the Saha equation and a Maxwellian velocity distribution on the electrons in the expanding plasma. Moreover, this implies that the temperature of electrons and
all other particles in the plasma plume are equal (\(T_e=T_h\)) and we want to assumed that it is optically thin. In this case we can apply the linear form of the Boltzmann-plot method as
$$\begin{aligned} \ln {\left( \frac{\lambda _{ki}I_{ki}}{hcA_{ki}g_k} \right) }=-\frac{E_k}{k_BT}+\ln {\left( \frac{FC_s}{U_s(T)}\right) }. \end{aligned}$$ (3) In this equation the indices
_k_ and _i_ represent the upper and lower state of the excited species respectively, the natural constants are given as _h_ for Planck, \(k_B\) for Boltzmann and _c_ for the vacuum light
velocity. Additional parameters for the transition wavelength \(\lambda _{ki}\) like transition probability \(A_{ki}\), statistical weight \(g_k\), and upper energy level \(E_k\) can be
extracted from common literature (e.g. NIST library18). \(U_s(T)\) is the temperature dependent partition function that can be calculated according to the statistical weight and energy
levels given for each material from the same library. Note that the experimental factor _F_ is the same for all analyzed materials in the same plasma as it depends on the collection system
and plasma size. The linear character (\(y=mx+q_s\)) of this form allows the extraction of the temperature value from the slope \(m=-(k_BT)^{-1}\) by plotting the data on a logarithmic axis.
In the intercept we can find the information on the species concentration \(C_s\) to the extend of the experimental factor _F_. This fact can be used in a Calibration Free LIBS method
(CF-LIBS) to estimate the amount of ablated deuterium in the detected plasma matrix. The application of this is discussed in detail in the experimental result section. For now we assume that
the ablated material contribution can be mapped by the spectral emission distribution. Specifically, we work under the assumption of stoichiometric ablation33,34, that the observed plasmas
(in a reasonable time frame) are optically thin, and that the used spectral lines for the Boltzmann-plot method are not self-absorbing. The evaluation of the electron number density is made
by analysis of the spectral line broadening of the hydrogen Balmer-\(\alpha\) emission. The spectral line shape is determined by the convolution of different effects, where natural line
broadening and van-der-Waals broadening are neglected and the instrumental broadening is determined for every measurement. The two dominant effects are the Doppler broadening, which is a
temperature effect, and the Stark broadening induced by collisions of the charged particles, especially electrons, with the other parts present in the plasma. Due to the assumed
Maxwell-Boltzmann velocity distribution the spectral lines are influenced by the plasma temperature and a Gaussian shape of width $$\begin{aligned} w_{Doppler}=\frac{\lambda _0}{c}\sqrt{2\ln
{2}\frac{k_BT}{m_s}}, \end{aligned}$$ (4) with spectral line wavelength \(\lambda _0\) and species mass \(m_s\), can be observed. This width is given as the full width at half maximum
(FWHM) divided by the factor \(2\sqrt{2\ln {2}}\). The Stark broadening follows a Lorentz profile and the electron number density \(n_e\) can be estimated by the half width \(w_{Stark}\),
also called Stark width, and the Stark broadening parameter \(w_0\) that can be found in literature. Note that \(w_0\) also depends on the plasma temperature. It has been shown in35,36 that
it is possible to neglect the temperature dependence by determining the Half Width at Half Area (HWHA) of the deconvoluted Lorentz part of the Balmer-\(\alpha\) emission line and calculate
\(n_e\) by $$\begin{aligned} \text{HWHA}[{\mathrm{nm}}]=0.549\cdot \left( \frac{n_e[{\mathrm{cm}}^{-3}]}{10^{17}}\right) ^{0.67965}. \end{aligned}$$ (5) Taking into account the convolution
of the Gaussian and the Lorentz shape, a pseudo-Voigt fit as described in37 is used in this contribution to extract the plasma parameter from the line shape characteristic. We found that
this fitting method was significantly more stable in the data processing compared to a real Voigt fit, also with data sets of lower signal-to-noise ratio. More information on the fitting
function can be found in the SI. DATA AVAILABILITY The experimental datasets generated during the current study are available from the corresponding author on reasonable request. REFERENCES
* Roth, J. _et al._ Tritium inventory in ITER plasma-facing materials and tritium removal procedures. _Plasma Phys. Controlled Fusion_ 50, 103001.
https://doi.org/10.1088/0741-3335/50/10/103001 (2008). Article ADS CAS Google Scholar * Brezinsek, S. _et al._ Beryllium migration in JET ITER-like wall plasmas. _Nucl. Fusion_ 55,
063021. https://doi.org/10.1088/0029-5515/55/6/063021 (2015). Article ADS CAS Google Scholar * Maurya, G. S., Marín-Roldán, A., Veis, P., Pathak, A. K. & Sen, P. A review of the LIBS
analysis for the plasma-facing components diagnostics. _J. Nucl. Mater._ 541, 152417. https://doi.org/10.1016/j.jnucmat.2020.152417 (2020). Article CAS Google Scholar * Huber, A. _et
al._ Development of laser-based diagnostics for surface characterisation of wall components in fusion devices. _Fusion Eng. Des._ 86, 1336–1340.
https://doi.org/10.1016/j.fusengdes.2011.01.090 (2011). Article CAS Google Scholar * Chan, G.C.-Y. _et al._ Analytical characterization of laser induced plasmas towards uranium isotopic
analysis in gaseous uranium hexafluoride. _Spectrochim. Acta Part B_ 176, 106036. https://doi.org/10.1016/j.sab.2020.106036 (2021). Article CAS Google Scholar * McCanta, M., Dobosh, P.,
Dyar, M. & Newsom, H. Testing the veracity of LIBS analyses on mars using the LIBSSIM program. _Planet. Space Sci._ 81, 48–54. https://doi.org/10.1016/j.pss.2013.03.004 (2013). Article
ADS Google Scholar * Heikkilä, P., Rostedt, A., Toivonen, J. & Keskinen, J. Elemental analysis of single ambient aerosol particles using laser-induced breakdown spectroscopy. _Sci.
Rep._ 12, 1–9. https://doi.org/10.1038/s41598-022-18349-8 (2022). Article CAS Google Scholar * Chirinos, J. R. _et al._ Simultaneous 3-dimensional elemental imaging with LIBS and
LA-ICP-MS. _J. Anal. At. Spectrom._ 29, 1292–1298. https://doi.org/10.1039/C4JA00066H (2014). Article CAS Google Scholar * Lu, Y., Zorba, V., Mao, X., Zheng, R. & Russo, R. E. UV
fs-ns double-pulse laser induced breakdown spectroscopy for high spatial resolution chemical analysis. _J. Anal. At. Spectrom._ 28, 743–748. https://doi.org/10.1039/C3JA30315B (2013).
Article CAS Google Scholar * Le Harzic, R. _et al._ Comparison of heat-affected zones due to nanosecond and femtosecond laser pulses using transmission electronic microscopy. _Appl. Phys.
Lett._ 80, 3886–3888. https://doi.org/10.1063/1.1481195 (2002). Article ADS CAS Google Scholar * Kurniawan, K. H. & Kagawa, K. Hydrogen and deuterium analysis using laser-induced
plasma spectroscopy. _Appl. Spectrosc. Rev._ 41, 99–130. https://doi.org/10.1080/05704920500510687 (2006). Article ADS CAS Google Scholar * Jiang, X., Sergienko, G., Kreter, A.,
Brezinsek, S. & Linsmeier, C. In situ study of short-term retention of deuterium in tungsten during and after plasma exposure in psi-2. _Nucl. Fusion_ 61, 096006.
https://doi.org/10.1088/1741-4326/ac112e (2021). Article ADS CAS Google Scholar * Werner, W. S., Glantschnig, K. & Ambrosch-Draxl, C. Optical constants and inelastic
electron-scattering data for 17 elemental metals. _J. Phys. Chem. Ref. Data_ 38, 1013–1092. https://doi.org/10.1063/1.3243762 (2009). Article ADS CAS Google Scholar * Hermann, J. _et
al._ Ideal radiation source for plasma spectroscopy generated by laser ablation. _Phys. Rev. E_ 96, 053210. https://doi.org/10.1103/PhysRevE.96.053210 (2017). Article ADS Google Scholar *
Mittelmann, S. _et al._ Laser-induced ablation of tantalum in a wide range of pulse durations. _Appl. Phys. A_ 126, 1–7. https://doi.org/10.1007/s00339-020-03838-2 (2020). Article CAS
Google Scholar * Chichkov, B. N., Momma, C., Nolte, S., Von Alvensleben, F. & Tünnermann, A. Femtosecond, picosecond and nanosecond laser ablation of solids. _Appl. Phys. A_ 63,
109–115. https://doi.org/10.1007/BF01567637 (1996). Article ADS Google Scholar * Lickschat, P., Metzner, D. & Weißmantel, S. Fundamental investigations of ultrashort pulsed laser
ablation on stainless steel and cemented tungsten carbide. _Int. J. Adv. Manuf. Technol._ 109, 1167–1175. https://doi.org/10.1007/s00170-020-05502-8 (2020). Article Google Scholar *
Kramida, A., Ralchenko, Y., Reader, J. & Team, N. A. Nist atomic spectra database (ver. 5.9). https://doi.org/10.18434/T4W30F(2021). * Dwivedi, V. _et al._ CF-LIBS study of pure ta, and
WTa+ D coating as fusion-relevant materials: a step towards future in situ compositional quantification at atmospheric pressure. _Eur. Phys. J. Plus_ 136, 1177.
https://doi.org/10.1140/epjp/s13360-021-02179-0 (2021). Article CAS Google Scholar * Mal, E., Junjuri, R., Gundawar, M. K. & Khare, A. Temporal characterization of laser-induced
plasma of tungsten in air. _Laser Part. Beams_ 38, 14–24. https://doi.org/10.1017/S0263034619000788 (2020). Article ADS CAS Google Scholar * Russo, R. E., Mao, X., Gonzalez, J. J.,
Zorba, V. & Yoo, J. Laser ablation in analytical chemistry. _Anal. Chem._ 85, 6162–6177. https://doi.org/10.1021/ac4005327 (2013). Article CAS Google Scholar * Hacar, A., Alves, J.,
Burkert, A. & Goldsmith, P. Opacity broadening and interpretation of suprathermal co linewidths: Macroscopic turbulence and tangled molecular clouds. _Astron. Astrophys._ 591, A104.
https://doi.org/10.1051/0004-6361/201527319 (2016). Article ADS CAS Google Scholar * De Giacomo, A. _et al._ Spatial distribution of hydrogen and other emitters in aluminum laser-induced
plasma in air and consequences on spatially integrated laser-induced breakdown spectroscopy measurements. _Spectrochim. Acta Part B_ 63, 980–987. https://doi.org/10.1016/j.sab.2008.06.010
(2008). Article ADS CAS Google Scholar * Aragón, C. & Aguilera, J. A. Characterization of laser induced plasmas by optical emission spectroscopy: A review of experiments and methods.
_Spectrochim. Acta Part B_ 63, 893–916. https://doi.org/10.1016/j.sab.2008.05.010 (2008). Article ADS CAS Google Scholar * Cristoforetti, G. _et al._ Local thermodynamic equilibrium in
laser-induced breakdown spectroscopy: Beyond the McWhirter criterion. _Spectrochim. Acta Part B_ 65, 86–95. https://doi.org/10.1016/j.sab.2009.11.005 (2010). Article ADS CAS Google
Scholar * Zhang, S. _et al._ Laser-induced plasma temperature. _Spectrochim. Acta Part B_ 97, 13–33. https://doi.org/10.1016/j.sab.2014.04.009 (2014). Article ADS CAS Google Scholar *
Kreter, A. _et al._ Influence of plasma impurities on the fuel retention in tungsten. _Nucl. Fusion_ 59, 086029. https://doi.org/10.1088/1741-4326/ab235d (2019). Article ADS CAS Google
Scholar * Oelmann, J., Wüst, E., Sergienko, G. & Brezinsek, S. Double pulse laser-induced breakdown spectroscopy for the analysis of plasma-facing components. _Phys. Scr._ 96, 124064.
https://doi.org/10.1088/1402-4896/ac379c (2021). Article ADS Google Scholar * Xing, Y. _et al._ Quantitative analysis of hydrogen isotopes in hydrogen storage material using laser-induced
breakdown spectroscopy. _Nucl. Mater. Energy_ 31, 101204. https://doi.org/10.1016/j.nme.2022.101204 (2022). Article CAS Google Scholar * Pardede, M. _et al._ High sensitivity hydrogen
analysis in zircaloy-4 using helium-assisted excitation laser-induced breakdown spectroscopy. _Sci. Rep._ 11, 1–10. https://doi.org/10.1038/s41598-021-01601-y (2021). Article CAS Google
Scholar * Yang, G., Lin, Q., Ding, Y., Tian, D. & Duan, Y. Laser induced breakdown spectroscopy based on single beam splitting and geometric configuration for effective signal
enhancement. _Sci. Rep._ 5, 1–11. https://doi.org/10.1038/srep07625 (2015). Article CAS Google Scholar * Fujimoto, T. & McWhirter, R. Validity criteria for local thermodynamic
equilibrium in plasma spectroscopy. _Phys. Rev. A_ 42, 6588. https://doi.org/10.1103/PhysRevA.42.6588 (1990). Article ADS CAS Google Scholar * Tognoni, E., Cristoforetti, G., Legnaioli,
S. & Palleschi, V. Calibration-free laser-induced breakdown spectroscopy: State of the art. _Spectrochim. Acta Part B_ 65, 1–14. https://doi.org/10.1016/j.sab.2009.11.006 (2010). Article
ADS CAS Google Scholar * Roldán, A. M., Pisarčík, M., Veis, M., Držík, M. & Veis, P. Calibration-free analysis of a tungsten-based target for diagnostics of relevant fusion
materials comparing picosecond and nanosecond libs. _Spectrochim. Acta Part B_ 177, 106055. https://doi.org/10.1016/j.sab.2020.106055 (2021). Article CAS Google Scholar * Gigosos, M. A.,
Gonzalez, M. A. & Cardenoso, V. Computer simulated Balmer-alpha,-beta and-gamma stark line profiles for non-equilibrium plasmas diagnostics. _Spectrochim. Acta Part B_ 58, 1489–1504.
https://doi.org/10.1016/S0584-8547(03)00097-1 (2003). Article ADS CAS Google Scholar * Konjević, N., Ivković, M. & Sakan, N. Hydrogen Balmer lines for low electron number density
plasma diagnostics. _Spectrochim. Acta Part B_ 76, 16–26. https://doi.org/10.1016/j.sab.2012.06.026 (2012). Article ADS CAS Google Scholar * Ida, T., Ando, M. & Toraya, H. Extended
pseudo-Voigt function for approximating the Voigt profile. _J. Appl. Crystallogr._ 33, 1311–1316. https://doi.org/10.1107/S0021889800010219 (2000). Article CAS Google Scholar Download
references ACKNOWLEDGEMENTS We want to thank Fulbright Germany for making this cooperation possible in the context of a research exchange program. We also want to give credits to the
research teams of the Laser Technologies Group at Lawrence Berkeley National Laboratory and the IEK-4 at Forschungszentrum Jülich for providing necessary equipment, expertise, sample
processing, and post mortem diagnostics. Moreover, we gratefully acknowledge the financial funding by the Deutsche Forschungsgemeinschaft (No. 410415657), and the US Department of Energy,
Office of Defense Nuclear Nonproliferation Research and Development under contract number DE-AC02-05CH11231 at the Lawrence Berkeley National Laboratory. FUNDING Open Access funding enabled
and organized by Projekt DEAL. AUTHOR INFORMATION AUTHORS AND AFFILIATIONS * Institute of Laser and Plasma Physics, Heinrich-Heine University Düsseldorf, 40225, Düsseldorf, Germany Steffen
Mittelmann & Georg Pretzler * Laser Technologies Group, Lawrence Berkeley National Laboratory, Berkeley, CA, 94720, USA Kévin Touchet, Xianglei Mao, Minok Park & Vassilia Zorba *
Forschungszentrum Jülich GmbH IEK-4 Plasmaphysik, 52425, Jülich, Germany Sebastijan Brezinsek * Department of Mechanical Engineering, University of California at Berkeley, Berkeley, CA,
94720-1740, USA Vassilia Zorba Authors * Steffen Mittelmann View author publications You can also search for this author inPubMed Google Scholar * Kévin Touchet View author publications You
can also search for this author inPubMed Google Scholar * Xianglei Mao View author publications You can also search for this author inPubMed Google Scholar * Minok Park View author
publications You can also search for this author inPubMed Google Scholar * Sebastijan Brezinsek View author publications You can also search for this author inPubMed Google Scholar * Georg
Pretzler View author publications You can also search for this author inPubMed Google Scholar * Vassilia Zorba View author publications You can also search for this author inPubMed Google
Scholar CONTRIBUTIONS S.M. and V.Z. conceived the experiment. S.M. conducted the experiment, analysed the results, and was writing the manuscript. K.T., M.P., and X.M. helped to conduct the
experiment. S.B. was consulted for the tile preparation. G.P. and V.Z. supervised the project. All authors discussed the results and reviewed the manuscript. CORRESPONDING AUTHOR
Correspondence to Steffen Mittelmann. ETHICS DECLARATIONS COMPETING INTERESTS The authors declare no competing interests. ADDITIONAL INFORMATION PUBLISHER'S NOTE Springer Nature remains
neutral with regard to jurisdictional claims in published maps and institutional affiliations. SUPPLEMENTARY INFORMATION SUPPLEMENTARY INFORMATION. RIGHTS AND PERMISSIONS OPEN ACCESS This
article is licensed under a Creative Commons Attribution 4.0 International License, which permits use, sharing, adaptation, distribution and reproduction in any medium or format, as long as
you give appropriate credit to the original author(s) and the source, provide a link to the Creative Commons licence, and indicate if changes were made. The images or other third party
material in this article are included in the article's Creative Commons licence, unless indicated otherwise in a credit line to the material. If material is not included in the
article's Creative Commons licence and your intended use is not permitted by statutory regulation or exceeds the permitted use, you will need to obtain permission directly from the
copyright holder. To view a copy of this licence, visit http://creativecommons.org/licenses/by/4.0/. Reprints and permissions ABOUT THIS ARTICLE CITE THIS ARTICLE Mittelmann, S., Touchet,
K., Mao, X. _et al._ Hydrogen isotope analysis in W-tiles using fs-LIBS. _Sci Rep_ 13, 2285 (2023). https://doi.org/10.1038/s41598-023-29138-2 Download citation * Received: 07 November 2022
* Accepted: 31 January 2023 * Published: 09 February 2023 * DOI: https://doi.org/10.1038/s41598-023-29138-2 SHARE THIS ARTICLE Anyone you share the following link with will be able to read
this content: Get shareable link Sorry, a shareable link is not currently available for this article. Copy to clipboard Provided by the Springer Nature SharedIt content-sharing initiative