Enhancing medical explainability in deep learning for age-related macular degeneration diagnosis
- Select a language for the TTS:
- UK English Female
- UK English Male
- US English Female
- US English Male
- Australian Female
- Australian Male
- Language selected: (auto detect) - EN
Play all audios:

ABSTRACT Deep learning models hold significant promise for disease diagnosis but often lack transparency in their decision-making processes, limiting trust and hindering clinical adoption.
This study introduces a novel multi-task learning framework to enhance the medical explainability of deep learning models for diagnosing age-related macular degeneration (AMD) using fundus
images. The framework simultaneously performs AMD classification and lesion segmentation, allowing the model to support its diagnoses with AMD-associated lesions identified through
segmentation. In addition, we perform an in-depth interpretability analysis of the model, proposing the Medical Explainability Index (MXI), a novel metric that quantifies the medical
relevance of the generated heatmaps by comparing them with the model’s lesion segmentation output. This metric provides a measurable basis to evaluate whether the model’s decisions are
grounded in clinically meaningful information. The proposed method was trained and evaluated on the Automatic Detection Challenge on Age-Related Macular Degeneration (ADAM) dataset.
Experimental results demonstrate robust performance, achieving an area under the curve (AUC) of 0.96 for classification and a Dice similarity coefficient (DSC) of 0.59 for segmentation,
outperforming single-task models. By offering interpretable and clinically relevant insights, our approach aims to foster greater trust in AI-driven disease diagnosis and facilitate its
adoption in clinical practice. SIMILAR CONTENT BEING VIEWED BY OTHERS AN INTERPRETABLE AND INTERACTIVE DEEP LEARNING ALGORITHM FOR A CLINICALLY APPLICABLE RETINAL FUNDUS DIAGNOSIS SYSTEM BY
MODELLING FINDING-DISEASE RELATIONSHIP Article Open access 12 April 2023 DETECTING MULTIPLE RETINAL DISEASES IN ULTRA-WIDEFIELD FUNDUS IMAGING AND DATA-DRIVEN IDENTIFICATION OF INFORMATIVE
REGIONS WITH DEEP LEARNING Article 08 December 2022 DEEP LEARNING-BASED AUTOMATED DETECTION FOR DIABETIC RETINOPATHY AND DIABETIC MACULAR OEDEMA IN RETINAL FUNDUS PHOTOGRAPHS Article 01 July
2021 INTRODUCTION State-of-the-art deep learning algorithms have achieved impressive performance in analyzing fundus images to detect eye diseases such as glaucoma, age-related macular
degeneration (AMD), and pathological myopia1,2,3,4,5,6. Despite these advancements, these models often lack transparency in their decision-making processes. This issue, commonly referred to
as the AI “black box” problem, presents a significant challenge in the medical field, where understanding the reasoning behind a diagnosis is crucial for both clinicians and patients7,8. The
AI “black box” problem is widely recognized as a key barrier to the broader adoption of AI in clinical practice9,10,11. The field of explainable AI (XAI) seeks to improve understanding of
how neural networks make decisions. A common XAI approach in biomedical imaging is to identify regions of an image most relevant to a model’s decisions, using techniques such as Class
Activation Mapping (CAM) and Gradient-weighted CAM (Grad-CAM)12,13,14. However, these methods lack the ability to provide meaningful medical insights needed to explain the model’s reasoning.
Critical questions remain unanswered: Do the regions highlighted in the heatmaps correspond to clinically relevant features? Can the model support its diagnosis with medical knowledge and
reasoning? Another challenge in XAI is performance evaluation. Unlike traditional deep learning tasks with standardized metrics, there is currently no widely accepted method for assessing
explainability. Our paper aims to address these challenges. We use the term _medical explainability_ to refer to the model’s ability to justify its diagnostic decisions based on medical
knowledge and reasoning, as opposed to _algorithmic explainability_, which relies on general interpretability techniques such as CAM and Grad-CAM. Distinguishing between these two concepts
allows for a more comprehensive framework for addressing the “black box” issue in AI. Medical explainability is essential for building trust in AI-based diagnoses among clinicians and
patients. However, most existing research focuses on algorithmic explainability, while medical explainability remains underexplored. This paper’s contribution is to develop a methodology
that enhances the medical explainability of a deep learning model for diagnosing AMD using fundus images. AMD, a degenerative disorder affecting the macula, is the leading cause of vision
loss in individuals over 50, affecting approximately 200 million people worldwide15,16. Early detection is crucial, as the vision loss caused by AMD is irreversible and the effectiveness of
treatments declines with disease progression. However, access to eye healthcare is often limited, particularly in low-income and rural areas. Therefore, it is important to develop effective
and low-cost methods for AMD detection, and deep learning has shown considerable promise as a solution. Models such as convolutional neural networks (CNNs) have achieved high accuracy in
detecting AMD using retinal fundus images, sometimes outperforming traditional manual approaches17,18,19,20,21. However, the lack of explainability in these models presents a major obstacle
to their clinical adoption, hindering the potential for large-scale AMD screening and early diagnosis. Our methodology enhances medical explainability through two innovative approaches.
First, we propose a multi-task learning framework that simultaneously performs disease classification and lesion segmentation, leveraging the extraction and segmentation of AMD-related
biomarkers to validate the model’s binary classification results. The AMD-related lesions include drusen, exudates, hemorrhages, and scars, among which drusen is a key indicator and defining
feature of the disease, particularly in its early stages. The lesions identified by the segmentation task can provide evidence for the model’s positive AMD diagnosis. This approach of
supporting an AMD diagnosis with associated lesions mirrors the diagnostic process used by clinicians, where the morphological characteristics of lesions play a crucial role in accurate
disease identification. Second, we introduce a novel metric, the Medical Explainability Index (MXI), to enable an in-depth interpretability analysis of the model. The model incorporates a
Grad-CAM module to generate heatmaps from the AMD classification task, and the MXI assesses their medical relevance by measuring the degree of overlap between the highlighted regions in the
heatmaps and AMD-related lesions identified in the segmentation masks. The MXI provides a quantifiable basis for evaluating the medical explainability of the model. It offers valuable
insights into whether and how the model’s predictions are grounded in clinically meaningful information and helps identify the lesions or biomarkers that influence its decisions. By
enhancing understanding of the model’s decision-making process, this new metric can help build greater confidence and trust in AI-assisted diagnoses. The proposed model, Deep Learning with
Medical eXplainability (DLMX), not only enhances medical explainability but also improves model performance by exploiting the inherent correlation between lesion segmentation and disease
classification. The segmentation task provides detailed spatial information about morphological features, while the classification task assesses the overall features and patterns of the
image. By sharing the learned representations between tasks within a shared learning framework, the model effectively utilizes both local and global features, leading to more accurate
predictions for both tasks. Several studies have used the multi-task learning approach to enhance performance and reduce computational costs in medical imaging. Pascal et al. employs a
multi-task model with glaucoma classification, optic disc and optic cup segmentation, and fovea localization for glaucoma detection22. Ju et al. trains a model with two classification tasks
for diabetic retinopathy (DR) and AMD, diseases that share some pathological similarities and thus improve performance of both DR and AMD diagnosis23. To the best of our knowledge, our paper
is the first to utilize the multi-task framework to enhance medical explainability of a deep learning model. In summary, the main contributions of our work are as follows: * 1. We propose a
multi-task learning framework that integrates AMD classification and lesion segmentation, enabling the model to support its diagnoses with AMD-associated lesions identified from
segmentation. Moreover, by leveraging the correlation between AMD classification and lesion segmentation, this model achieves improved performance for both tasks. * 2. We introduce a new
interpretability metric (MXI) to enhance understanding of the model’s decision-making process, ensuring that its predictions are medically explainable. * 3. We evaluate our proposed approach
and validate its effectiveness through extensive experiments on the Automatic Detection Challenge on Age-Related Macular Degeneration (ADAM) fundus image dataset21. METHODS NETWORK
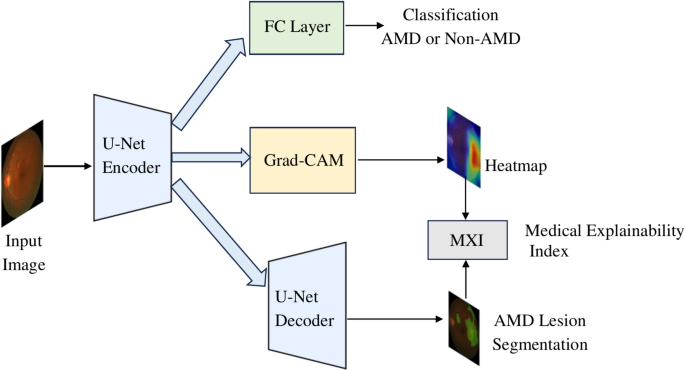
ARCHITECTURE Our proposed model, Deep Learning with Medical eXplainability (DLMX), utilizes a U-Net encoder-decoder architecture and integrates four modules as illustrated in Fig. 1: (1) AMD
classification using a state-of-the-art CNN, (2) Grad-CAM for generating a heatmap, (3) Segmentation of AMD-related lesions, and (4) Generation of MXI, the medical explainability metric, by
evaluating the overlap between the heatmap and the segmented lesion. The DLMX model is based on a U-Net architecture, which is known for its strong performance in biomedical image
segmentation24. The encoder, implemented using a CNN, extracts high-level features while progressively downsampling the input image. We evaluate several state-of-the-art CNN architectures
for the encoder, including EfficientNet-B725, EfficientNet-B3, EfficientNet-B0, and ResNet26. Fig. 2 provides an example of the U-Net architecture with EfficientNet-B7 as the encoder. For
the AMD classification task, the output of the final EfficientNet block in the encoder is passed through a fully connected layer to predict the probability of AMD at the image level. The
decoder in the U-Net follows a standard structure, progressively upsampling feature maps using transposed convolutions. Skip connections, a critical component of the U-Net design,
concatenate feature maps from corresponding encoder layers to those in the decoder. This preserves detailed spatial information at each resolution level and ensures that high-level semantic
features are merged with precise spatial details, improving segmentation accuracy and localization. MULTI-TASK TRAINING The encoder in the U-Net extracts deep feature representations from
the input image, enabling the classification branch to predict AMD. Meanwhile, the decoder feeds into a segmentation block that generates pixel-level maps of AMD-related lesions. The tasks
of classification and segmentation are trained simultaneously within a multi-task learning architecture, leveraging shared information for mutual gain27,28. In this framework, the loss
functions for the classification and segmentation tasks are combined into a single aggregate loss function, and model parameters are shared across tasks, allowing the model to draw on the
strengths of both tasks and enhance its overall performance. For the classification task, a binary cross-entropy loss is used as the objective function to optimize the model parameters:
$${L}_{cls}=-{y}_{i}\text{log}{p}_{i}-\left(1-{y}_{i}\right)\text{log}(1-{p}_{i})$$ (1) where \({p}_{i}\) is the predicted probability and \({y}_{i}\) is the corresponding ground truth
label. For the segmentation task, a combination of cross-entropy loss and Dice loss is employed. Cross-entropy loss, commonly used for pixel-wise classification, penalizes incorrect
predictions at the pixel level and works well when class distributions are balanced. Dice loss measures the overlap between predicted and ground-truth regions, making it effective for
handling class imbalances—common in medical imaging where segmented regions often cover a small fraction of the image. By combining these two loss functions, the model better handles class
imbalance and yields more stable convergence. The cross-entropy and Dice loss functions are denoted as \({L}_{ce}\) and \({L}_{dice}\) and are shown in Eq. (2) and (3), respectively:
$${L}_{ce}=-\frac{1}{{N}_{pix}}{\sum }_{i=1}^{{N}_{pix}}({y}_{i}\text{log}{p}_{i}-\left(1-{y}_{i}\right)\text{log}(1-{p}_{i}))$$ (2) $${L}_{dice}=1-\frac{2{\sum
}_{i=1}^{{N}_{pix}}{p}_{i}{y}_{i}}{\sum_{i=1}^{{N}_{pix}}{p}_{i}+{\sum }_{i=1}^{{N}_{pix}}{y}_{i}}$$ (3) where \({y}_{i}\) is the predicted result of pixel _i_ and \({p}_{i}\) is the
corresponding ground truth label for all \({N}_{pix}\) number of pixels in the image. The combined loss function for the segmentation task, \({L}_{seg}\), is as follows:
$${L}_{seg}={L}_{ce}+{L}_{dice}$$ (4) For the overall loss function, we combine the classification loss and segmentation loss with equal weight to optimize the shared model parameters:
$${L}_{total}={L}_{cls}+{L}_{seg}$$ (5) SINGLE-LESION AND MULTI-LESION SEGMENTATION To demonstrate the proposed methodology, we first focus on drusen as the primary AMD-related lesion before
incorporating additional lesion types. Drusen is the most common and defining feature of AMD, while other lesions may be associated with multiple diseases. For instance, exudates are often
linked to DR but can also indicate AMD, while hemorrhages may be present in AMD, glaucoma, and DR. In the ADAM dataset, drusen has the highest occurrence rate, while other lesions appear
less frequently, which may potentially introduce data imbalance issues. Therefore, drusen serves as the most reliable lesion to demonstrate the effectiveness of the proposed methodology.
After validating our method with drusen for the segmentation task, we expand the model to include additional lesion types, specifically exudates, hemorrhages, and scars. DATASET The proposed
model is evaluated using the ADAM dataset21, which consists of 1,200 retinal fundus images stored in JPEG format, with 8 bits per color channel. These fundus images were captured using a
Zeiss Visucam 500 fundus camera with a resolution of 2124 × 2056 pixels and a Canon CR-2 device with a resolution of 1444 × 1444 pixels. The dataset includes binary labels for AMD and
non-AMD cases and pixel-wise annotations for segmentation masks of the optic disc and various lesions, including drusen, exudates, hemorrhages, and scars. Of the original 1,200 images, 800
are publicly available, with 400 of these containing lesion annotations. Consequently, this study focuses on the 400 annotated images. The dataset exhibits a class imbalance, with 89 images
labeled as AMD and 311 as non-AMD. For this study, the dataset is split into training and testing sets, consisting of 320 and 80 images, respectively. MODEL TRAINING DETAILS We use the
stochastic gradient descent (SGD) optimizer for model training. All models are optimized for 100 epochs. The initial learning rate is set to 0.001, and the learning rate is modulated using a
cosine annealing strategy. The batch size is set to 32. All images are resized to 256 × 256. To address the class imbalance problem, resampling techniques are applied. We use pre-trained
weights on ImageNet to initialize the model parameters, which enables the model to effectively fine-tune for the target tasks and achieve better performance with relatively limited data. In
addition, data augmentation techniques such as random flipping and random cropping are employed to enhance the model’s generalization capability. All models are implemented using the PyTorch
deep learning framework, and experiments are conducted on eight 3090 GPUs. Five-fold cross-validation with re-splitting of the training and testing data is performed to evaluate the
variability of the results. RESULTS MODEL PERFORMANCE RESULTS The DLMX model consists of four modules as illustrated in Fig. 1: (1) AMD classification, (2) Grad-CAM for generating a heatmap,
(3) Lesion segmentation, and (4) Generation of the MXI metric by evaluating the overlap between the heatmap and the segmented lesion. Fig. 3 illustrates an example set of model input,
ground truth lesion annotations, and output images, including (a) a fundus image serving as the input to the model, (b) ground truth lesion annotations; and three output images generated by
the DLMX model: (c) segmentation mask of drusen, (d) a heatmap generated by Grad-CAM, and (e) a heatmap mask converted from the heatmap. Note that Image (d), the heatmap, is produced in the
form of a two-dimensional numerical representation at the pixel level, with values ranging from 0 to 255. It is converted into a binary heatmap mask with pixel values of 0 or 1, seen in (e),
to facilitate comparison with the segmentation mask for the computation of MXI. To convert the heatmap into a binary mask, we apply Otsu’s method29, an automatic thresholding technique that
determines the optimal threshold by maximizing the variance between foreground and background pixel intensities. This approach allows each image to be thresholded based on its own intensity
distribution. Unlike traditional “black box” models that provide only a classification outcome without explanation, the DLMX model’s lesion segmentation supports and substantiates its
classification results. In Fig. 3, the identified drusen in the segmentation mask (c) reinforces a positive AMD diagnosis, as drusen is the most common feature associated with the disease.
Additionally, the MXI measured based on images (c) and (e) reveals whether the regions the model relies on for its diagnosis correspond to medically relevant features, offering insights into
how the model makes decisions and whether the decisions are medically explainable. We first discuss the performance of the classification and segmentation tasks below and follow with a
discussion of the MXI results in the next section. The DLMX model is implemented and evaluated using four state-of-the-art CNNs as the encoder backbone, specifically, EfficientNet-B725,
EfficientNet-B3, EfficientNet-B0, and ResNet26. To evaluate the classification task performance, baseline models trained on a single task of AMD classification are compared with the DLMX
model. The baselines employ the same CNNs as those used in the encoder of DLMX, i.e., EfficientNet-B7, EfficientNet-B3, EfficientNet-B0, or ResNet. Similarly, for segmentation tasks,
baseline models trained on a single segmentation task using the same U-Net architecture as employed in DLMX are compared to the DLMX model. For the classification task, the evaluation
metrics used are accuracy, sensitivity, specificity, F1 score, and area under the curve (AUC), with their definitions summarized in Table 1. AUC is a particularly useful metric for
imbalanced datasets and thus is a key metric for our experiments. The classification results are summarized in Table 2. DLMX based on EfficientNet-B7 achieves the strongest overall
performance. Between DLMX and the baseline models, with EfficientNet-B7 as the backbone encoder, DLMX outperforms the baseline in all performance metrics. For example, DLMX based on
EfficientNet-B7 achieves an AUC of 0.96 ± 0.03 and accuracy of 0.94 ± 0.05, surpassing the baseline AUC of 0.94 ± 0.04 and 0.91 ± 0.06. When ResNet is used as the backbone, DLMX performs
better in specificity and worse in other metrics relative to the baseline model with similar AUC (0.94 and 0.95, respectively). For lesion segmentation tasks, the evaluation metrics include
the Dice similarity coefficient (DSC) and intersection over union (IoU), as defined as follows: $$DSC= \frac{2\times |A\cap B|}{\left|A\right|+|B|}$$ (6) $$IoU= \frac{|A\cap B|}{|A\cup B|}$$
(7) DSC is particularly useful for measuring the model’s ability to detect small objects, such as small lesions in medical imaging. Table 3 presents the results for the segmentation of
drusen. The DLMX model performs better than the corresponding baseline model across all four CNN backbones. DLMX based on EfficientNet-B7 achieves the highest performance among all models,
with a DSC of 0.59 ± 0.18 and an IoU of 0.44 ± 0.17. The superior performance in segmentation accuracy reflects the DLMX’s enhanced ability to capture relevant features associated with
lesions. The overall strong performance of DLMX can be attributed to the underlying multi-task architecture. Multi-task deep learning has demonstrated the ability to generate superior
results compared to single-task models when the tasks are related22,23,27,28. Given that drusen is a core biomarker of AMD, integrating its extraction into a multi-task model along with
classification of AMD enhances overall model performance. The drusen segmentation can capture fine morphological features that aid in AMD classification, while the classification task can
provide non-morphological clues pertinent to the diagnosis, thus improving the joint learning of both tasks. Compared with AMD classification, the drusen segmentation is a more challenging
task as reflected in the performance measures. The highest AUC for classification is 0.96, while the highest DSC for segmentation is 0.59. This is likely due to two reasons: the irregular
shape of the lesion, and the class imbalance with relatively few positive drusen cases21. Notably, the improvement of DLMX over the single-task baselines across all backbone CNNs are more
consistent for segmentation tasks relative to classification tasks, suggesting that the benefits of multiple-task training for performance improvement are greater for more challenging tasks.
MXI METRIC The DLMX model integrates a module to generate heatmaps and interpret their medical significance. CAM and Grad-CAM are the most widely used techniques to generate heatmaps in the
XAI literature, particularly for deep learning-based medical image analysis12,13,14. We use Grad-CAM in our model due to its ability to adapt to a broader range of CNNs and generate more
detailed heatmaps14. Our proposed metric, the Medical Explainability Index (MXI), evaluates the overlap between the segmented lesion mask and the heatmap mask, both generated by the model
(i.e., images c and e in Fig. 3). Specifically, MXI is calculated as the inclusion ratio (IR) between the heatmap mask and the segmentation mask: $$IR(A,B)= \frac{|A\cap B|}{|B|}$$ (8) $$MXI
= IR \, (Heatmap \, mask, \, Segmentation)$$ (9) Here, \(|A\cap B|\) represents the number of overlap pixels between the heatmap mask and segmentation mask, and |B| represents the number of
pixels in the segmentation mask. MXI quantifies the extent to which the segmented lesion mask is represented in the heatmap, a value ranging from zero to one. A value of zero indicates no
overlap, suggesting that none of the lesion features are captured within the heatmap or used by the model to make decisions; in contrast, a value of one indicates complete overlap,
suggesting that the model utilizes all lesion features in its decision-making process. This measure identifies the medical features that influence its decisions, thus offering a mechanism
for the model to reveal the reasoning behind its diagnostic outputs. Another metric that measures the overlap between two regions is the DSC, as defined in Eq. (6). For the MXI metric, we
choose IR over DSC, as IR is useful for capturing the extent of lesion inclusion without penalizing additional areas of interest identified in the heatmap. DSC, on the other hand, calculates
the degree of overlap scaled by the combined area of the regions, which can result in low scores if the heatmap includes broader areas beyond a particular lesion. Since MXI depends on
lesion segmentation, it is essential for the segmentation task to achieve high accuracy for MXI to be a reliable measure. An alternative approach is to utilize the expert-labeled ground
truth lesion annotations to calculate the lesion-heatmap overlap, a parallel metric which we call MXI_GT, computed as the inclusion ratio between the ground truth annotation and the heatmap
mask (i.e., images b and e in Fig. 3): $$MXI\_GT = IR \, (Heatmap \, mask, \, Ground \, Truth)$$ (10) While MXI_GT does not depend on the segmentation accuracy of the model, it requires
ground truth annotations, limiting its applicability in clinical deployment. The advantage of MXI is its sole reliance on model-generated outputs, thus eliminating the need for
clinician-generated ground truth annotations. To our knowledge, this is the first study to propose a method for automatic assessment of whether the deep learning decision-making process
includes disease-related biomarkers generated by the model. The MXI results are presented based on EfficientNet-B7 as the backbone CNN for the DLMX model. Fig. 4 (a) and (b) show the
distribution of MXI and MXI_GT, respectively. Both MXI and MXI_GT display similar distributions, characterized by a distinct bimodal pattern. The mean and median MXI are 0.432 and 0.378, and
the mean and median MXI_GT are 0.462 and 0.410, respectively, suggesting that close to half of the drusen features are represented in the heatmaps. Fig. 4 (c) presents the scatter plot of
MXI vs. MXI_GT and results from two nonparametric rank correlation tests: Spearman’s rank correlation yields ρ = 0.921 (p = 1.28 × 10⁻19), and Kendall’s Tau yields τ = 0.775 (p = 2.59 ×
10⁻13), both indicating a strong positive monotonic association between the two metrics. These statistical results support the validity of MXI by demonstrating its close alignment with
MXI_GT, the ground truth-based metric. We note that when expert-level ground truth annotations are available, MXI_GT is a valuable metric. However, in scenarios where such annotations are
unavailable, as is often the case in real-world clinical deployment, MXI offers a practical, model-generated alternative for assessing medical explainability. Fig. 5 presents examples of two
image sets categorized by their MXI values. In Fig. 5 (a), the MXI is 0.94, indicating that 94% of the segmented drusen is contained within the heatmap mask. This large overlap can be
visualized by comparing the segmentation image with the heatmap mask image in Fig. 5 (a). This result suggests that the model’s decision process relies on the majority of the drusen features
contained in the fundus image, providing reassurance that the model utilizes disease-related, medically relevant features for its diagnosis. Conversely, in Fig. 5 (b), the value of MXI is
0.13, indicating that only a small portion of the drusen region is relevant to the model’s decision-making. The heatmap in Fig. 5 (b) highlights the optic disc/cup area rather than the
drusen-rich regions, suggesting the model based its decision on other features not directly related to the segmented lesion. The DLMX framework is scalable to incorporate more biomarkers. In
addition to focusing on drusen in our model, we add three new segmentation tasks for additional lesion types from the ADAM dataset, specifically exudate, hemorrhage, and scar. This expanded
model performs a more comprehensive analysis by creating separate segmentation masks for each lesion type, which are then aggregated into a single composite lesion mask. This aggregate mask
represents the combined presence of multiple lesions in the image and serves as the benchmark for evaluating the model’s decision-making. The MXI is computed as the IR between this
aggregate multi-lesion segmentation mask and the heatmap mask. Fig. 6 (a) and (b) show the histogram of the MXI and MXI_GT, respectively, for the multi-lesion model. The mean and median MXI
for the multi-lesion model are 0.417 and 0.331, respectively, slightly lower than the corresponding values in the drusen-only model (0.432 and 0.378). This modest decrease likely reflects
the increased complexity introduced by aggregating multiple lesion types into a single benchmark. As the model must attend to a broader range of features, its attention may be more
distributed across the image, resulting in slightly lower overlap with the composite segmentation mask. Nevertheless, the strong positive correlation between MXI and MXI_GT, as shown by
Spearman’s rank correlation of 0.943 (p = 1.88 × 10⁻44) and Kendall’s Tau of 0.822 (p = 8.04 × 10⁻28), supports the robustness of MXI in capturing medically relevant features even in the
more complex multi-lesion setting. DISCUSSION To make deep learning models’ diagnostic outcomes medically explainable, the models must integrate clinical knowledge. However, deep learning
excels at uncovering complex patterns without predefined rules, and imposing domain-specific knowledge risks limiting their ability to learn and generalize effectively. Our approach tackles
this trade-off by incorporating medical explainability in a way that enhances, rather than compromises, the predictive power of deep learning. The proposed multi-task learning architecture
preserves the strengths of conventional deep learning while generating biomarkers through the segmentation path to support and validate classification results. By integrating segmentation
loss into the overall loss function, the model prioritizes disease-related biomarkers in training while retaining the flexibility to learn nuanced patterns through the classification path.
This shared learning mechanism enhances the model’s focus on AMD-associated lesions, leading to improved performance and robustness. Our proposed MXI metric further ensures that the model’s
decisions are medically explainable. The DLMX model demonstrates competitive results when compared to those from the ADAM Challenge Competition21. For AMD classification, DLMX with an
EfficientNet-B7 backbone achieves an AUC of 0.96, compared to the best and median result from the ADAM competition of 0.9714 and 0.9287, respectively, across 10 participating teams. For
drusen segmentation, DLMX achieves a DSC of 0.59, compared to the competition’s best and median result of 0.5549 and 0.4483, respectively. Our approach relies on established medical
knowledge and known biomarkers to provide clinical explanations to the model output. This approach aligns with current diagnostic practices, where decisions are based on recognized
biomarkers. As new biomarkers are identified, they can be incorporated into the DLMX framework, enhancing its diagnostic capabilities and adaptability. Analysis of heatmaps indicates that
the model typically focuses on two regions: the drusen area and the optic disc/cup area. The emphasis on the optic disc/cup region may be attributed to its rich vascular network, potentially
revealing pathological features associated with AMD. This observation suggests the potential for future work to incorporate vascular network features into the segmentation path, as deep
learning models may uncover new, clinically relevant biomarkers that have yet to be recognized. In summary, our proposed methodology offers a practical solution for advancing explainable AI
in medical imaging. By integrating clinical reasoning into model outputs, this method enables clinicians and patients to better understand the model’s decisions, fostering trust in AI-based
diagnoses. Furthermore, the DLMX model provides a scalable framework for enhancing medical explainability, as future work can incorporate a broader range of biomarkers and validate the model
across diverse datasets and diseases. DATA AVAILABILITY The Automatic Detection Challenge on Age-Related Macular Degeneration (ADAM) dataset is available at
https://ieee-dataport.org/documents/adam-automatic-detection-challenge-age-related-macular-degeneration. REFERENCES * Akkara, J. D. & Kuriakose, A. Role of artificial intelligence and
machine learning in ophthalmology. _Kerala J. Ophthalmol._ 31(2), 150–160. https://doi.org/10.4103/kjo.kjo_54_19 (2019). Article Google Scholar * Ting, D. S. W. et al. Deep learning in
ophthalmology: The technical and clinical considerations. _Prog. Retin. Eye Res._ https://doi.org/10.1016/j.preteyeres.2019.04.003 (2019). Article PubMed Google Scholar * Li, T. et al.
Applications of deep learning in fundus images: A review. _Med. Image Anal._ https://doi.org/10.1016/j.media.2021.101971 (2021). Article PubMed PubMed Central Google Scholar * Pead, E.
et al. Automated detection of age-related macular degeneration in color fundus photography: A systematic review. _Surv. Ophthalmol._ 64(4), 498–511.
https://doi.org/10.1016/j.survophthal.2019.02.003 (2019). Article PubMed PubMed Central Google Scholar * Thompson, A. C., Jammal, A. A. & Medeiros, F. A. A review of deep learning
for screening, diagnosis, and detection of glaucoma progression. _Transl. Vis. Sci. Technol._ https://doi.org/10.1167/tvst.9.2.42 (2020). Article PubMed PubMed Central Google Scholar *
Hagiwara, Y. et al. Computer-aided diagnosis of glaucoma using fundus images: A review. _Comput. Method. Progr. Biomed._ 165, 1–12. https://doi.org/10.1016/j.cmpb.2018.07.012 (2018). Article
Google Scholar * Wadden, J. J. Defining the undefinable: The black box problem in healthcare artificial intelligence. _J. Med. Ethic._ 48, 764–768.
https://doi.org/10.1136/medethics-2021-107529 (2022). Article Google Scholar * van der Velden, B. H. M., Kuijf, H. J., Gilhuijs, K. G. A. & Viergever, M. A. Explainable artificial
intelligence (XAI) in deep learning-based medical image analysis. _Med. Image Anal._ https://doi.org/10.1016/j.media.2022.102470 (2022). Article PubMed Google Scholar * Rajpurkar, P.,
Chen, E., Banerjee, O. & Topol, E. J. AI in health and medicine. _Nat. Med._ 28, 31–38. https://doi.org/10.1038/s41591-021-01614-0 (2022). Article CAS PubMed Google Scholar * Singh,
R. P. et al. Current challenges and barriers to real-world artificial intelligence adoption for the healthcare system, provider, and the patient. _Transl. Vis. Sci. Technol._
https://doi.org/10.1167/tvst.9.2.45 (2020). Article PubMed PubMed Central Google Scholar * Kundu, S. AI in medicine must be explainable. _Nat. Med._ 27, 1328.
https://doi.org/10.1038/s41591-021-01461-z (2021). Article CAS PubMed Google Scholar * de Vries, B. M. et al. Explainable artificial intelligence (XAI) in radiology and nuclear medicine:
A literature review. _Front. Med._ https://doi.org/10.3389/fmed.2023.1180773 (2023). Article Google Scholar * Zhou, B., Khosla, A ., Lapedriza, A ., Oliva, A ., & Torralba, A.
Learning deep features for discriminative localization. In _Proc. of the IEEE conference on computer vision and pattern recognition_. 2921–2929 https://doi.org/10.1109/CVPR.2016.319 (2016).
* Selvaraju, R. R. _et al_. Grad-CAM: Visual explanations from deep networks via gradient-based localization. In _Proc. of the IEEE international conference on computer vision (ICCV)_.
618–626 https://doi.org/10.1109/ICCV.2017.74 (2017). * Wong, W. L. et al. Global prevalence of age-related macular degeneration and disease burden projection for 2020 and 2040: A systematic
review and meta-analysis. _Lancet Glob Health._ https://doi.org/10.1016/S2214-109X(13)70145-1 (2014). Article PubMed Google Scholar * Mitchell, P., Liew, G., Gopinath, B. & Wong, T.
Y. Age-related macular degeneration. _Lancet_ 392(10153), 1147–1159. https://doi.org/10.1016/S0140-6736(18)31550-2 (2018). Article PubMed Google Scholar * Burlina, P. M. et al. Use of
deep learning for detailed severity characterization and estimation of 5-year risk among patients with age-related macular degeneration. _JAMA Ophthalmol._ 136(12), 1359–1366.
https://doi.org/10.1001/jamaophthalmol.2018.4118 (2018). Article PubMed PubMed Central Google Scholar * Grassmann, F. et al. A deep learning algorithm for prediction of age-related eye
disease study severity scale for age-related macular degeneration from color fundus photography. _Ophthalmol._ 125(9), 1410–1420. https://doi.org/10.1016/j.ophtha.2018.02.037 (2018). Article
Google Scholar * Burlina, P. M. et al. Automated grading of age-related macular degeneration from color fundus images using deep convolutional neural networks. _JAMA Ophthalmol._ 135(11),
1170–1176. https://doi.org/10.1001/jamaophthalmol.2017.3782 (2017). Article PubMed PubMed Central Google Scholar * González-Gonzalo, C. et al. Evaluation of a deep learning system for
the joint automated detection of diabetic retinopathy and age-related macular degeneration. _Acta Ophthalmol._ 98(4), 368–377. https://doi.org/10.1111/aos.14306 (2020). Article PubMed
Google Scholar * Fang, H. et al. ADAM Challenge: Detecting age-related macular degeneration from fundus images. _IEEE Trans. Med. Imaging_ 41(10), 2828–2847.
https://doi.org/10.1109/TMI.2022.3172773 (2022). Article PubMed Google Scholar * Pascal, L. et al. Multi-task deep learning for glaucoma detection from color fundus images. _Sci. Rep._
https://doi.org/10.1038/s41598-022-16262-8 (2022). Article PubMed PubMed Central Google Scholar * Ju, L. et al. Synergic adversarial label learning for grading retinal diseases via
knowledge distillation and multi-task learning. _IEEE J. Biomed. Health Inform._ 25(10), 3709–3720. https://doi.org/10.1109/JBHI.2021.3052916 (2021). Article PubMed Google Scholar *
Ronneberger, O., Fischer, P., & Brox, T. U-Net: Convolutional networks for biomedical image segmentation. In_ Medical Image Computing and Computer-Assisted Intervention (MICCAI)_.
https://doi.org/10.1007/978-3-319-24574-4_28 (2015). * Tan, M., & Le, Q. V. EfficientNet: Rethinking Model Scaling for Convolutional Neural Networks. In _Proc. of the 36th International
Conference on Machine Learning (ICML)_. 6105–6114 http://proceedings.mlr.press/v97/tan19a.html (2019). * He, K., Zhang, X., Ren, S., & Sun, J. Deep Residual Learning for Image
Recognition. In _Proc. of the IEEE Conference on Computer Vision and Pattern Recognition (CVPR)_. 770–778, https://doi.org/10.1109/CVPR.2016.90 (2016). * Caruana, R. Multitask learning.
_Mach. Learn._ 28, 41–75. https://doi.org/10.1023/A:1007379606734 (1997). Article Google Scholar * Zhao, Y., Wang, X., Che, T., Bao, G. & Li, S. Multi-task deep learning for medical
image computing and analysis: A review. _Comput. Biol. Med._ 153, 106496. https://doi.org/10.1016/j.compbiomed.2022.106496 (2023). Article PubMed Google Scholar * Otsu, N. A threshold
selection method from gray-level histograms. _IEEE Trans. Syst. Man Cybern._ 9(1), 62–66. https://doi.org/10.1109/TSMC.1979.4310076 (1979). Article Google Scholar Download references
AUTHOR INFORMATION AUTHORS AND AFFILIATIONS * The Harker School, San Jose, CA, 95129, USA Lily Shi Authors * Lily Shi View author publications You can also search for this author inPubMed
Google Scholar CONTRIBUTIONS The author was responsible for the conceptualization, study design, methodology, presented results, and manuscript preparation. CORRESPONDING AUTHOR
Correspondence to Lily Shi. ETHICS DECLARATIONS COMPETING INTERESTS The author declares no competing interests. ADDITIONAL INFORMATION PUBLISHER’S NOTE Springer Nature remains neutral with
regard to jurisdictional claims in published maps and institutional affiliations. RIGHTS AND PERMISSIONS OPEN ACCESS This article is licensed under a Creative Commons
Attribution-NonCommercial-NoDerivatives 4.0 International License, which permits any non-commercial use, sharing, distribution and reproduction in any medium or format, as long as you give
appropriate credit to the original author(s) and the source, provide a link to the Creative Commons licence, and indicate if you modified the licensed material. You do not have permission
under this licence to share adapted material derived from this article or parts of it. The images or other third party material in this article are included in the article’s Creative Commons
licence, unless indicated otherwise in a credit line to the material. If material is not included in the article’s Creative Commons licence and your intended use is not permitted by
statutory regulation or exceeds the permitted use, you will need to obtain permission directly from the copyright holder. To view a copy of this licence, visit
http://creativecommons.org/licenses/by-nc-nd/4.0/. Reprints and permissions ABOUT THIS ARTICLE CITE THIS ARTICLE Shi, L. Enhancing medical explainability in deep learning for age-related
macular degeneration diagnosis. _Sci Rep_ 15, 16975 (2025). https://doi.org/10.1038/s41598-025-01496-z Download citation * Received: 09 January 2025 * Accepted: 05 May 2025 * Published: 15
May 2025 * DOI: https://doi.org/10.1038/s41598-025-01496-z SHARE THIS ARTICLE Anyone you share the following link with will be able to read this content: Get shareable link Sorry, a
shareable link is not currently available for this article. Copy to clipboard Provided by the Springer Nature SharedIt content-sharing initiative KEYWORDS * Medical explainability *
Explainable AI * Deep learning * Medical imaging * Lesion segmentation * Age-related macular degeneration