Assessment of agricultural drought severity using multi-temporal remote sensing data in Lorestan region
- Select a language for the TTS:
- UK English Female
- UK English Male
- US English Female
- US English Male
- Australian Female
- Australian Male
- Language selected: (auto detect) - EN
Play all audios:

Download PDF Article Open access Published: 27 May 2025 Assessment of agricultural drought severity using multi-temporal remote sensing data in Lorestan region M. Ghobadi1 & Z. Badehian2
Scientific Reports volume 15, Article number: 18528 (2025) Cite this article
800 Accesses
1 Altmetric
Metrics details
Subjects Climate sciencesEcologyEnvironmental sciences AbstractAgricultural drought is a complex phenomenon with major impacts on ecosystems, biodiversity, and ecosystem services. This study examines drought severity in Lorestan, Iran, using spatial
analysis of vegetation indices, including the Normalized Difference Vegetation Index (NDVI), Vegetation Condition Index (VCI), Temperature Condition Index (TCI), and Vegetation Health Index
(VHI). Landsat images from 2004, 2014, and 2024 were processed using TerrSet software to assess drought trends. The results show a clear increase in drought severity in Lorestan over the
past 20 years, with fewer areas free from drought and more regions facing mild to moderate drought conditions. The analysis of results reveals that drought-free areas changed by
approximately 14.7%, while areas under mild drought increased by 6.5% and moderate drought by 8.2%. These shifts show a strong correlation with observed land degradation (bare land + 8.1%,
dense vegetation − 8.5%), confirming heightened ecosystem stress through integrated drought indices. This trend indicates a growing threat to crops, water resources, and ecosystem stability.
The study demonstrates the effectiveness of using vegetation indices like NDVI, VCI, TCI, and VHI for monitoring drought patterns. These tools can help detect early warning signs, allowing
farmers and policymakers to take timely action. To reduce the damaging effects of drought, improved water management, sustainable farming practices, and long-term adaptation strategies are
urgently needed. By incorporating these monitoring techniques into regular assessments, authorities can better prepare for and respond to future droughts, protecting both agriculture and the
environment.
Similar content being viewed by others An improved global vegetation health index dataset in detecting vegetation drought Article Open access 31 May 2023 Extreme droughtalong the tropic of cancer (Yunnan section) and its impact on vegetation Article Open access 29 March 2024 Investigation into the temporal impacts of drought on vegetation dynamics in China
during 2000 to 2022 Article Open access 21 February 2025 Introduction
Drought is a complex and multifaceted natural disaster that poses significant challenges to environmental sustainability, agricultural productivity, and water resource management1,2. It is
characterized by prolonged periods of insufficient rainfall, leading to a deficiency in water availability that adversely impacts soil moisture, vegetation health, and overall ecosystem
stability3,4. The increasing frequency and severity of droughts, exacerbated by climate change, necessitate robust and efficient methods for monitoring and assessing drought conditions5,6.
Traditional ground-based observations, while valuable, are often limited in spatial coverage and temporal resolution7,8. Consequently, there is a growing reliance on remote sensing
technologies and satellite-based indices to provide comprehensive and timely assessments of drought severity9,10. Remote sensing offers a powerful toolset for capturing large-scale
environmental data with high temporal frequency and spatial resolution7. Among the various indices derived from satellite data, the Normalized Difference Vegetation Index (NDVI), Vegetation
Condition Index (VCI), Temperature Condition Index (TCI) and Vegetation Health Index (VHI) stand out as critical indicators for evaluating drought impacts11,12,13. One of the foundational
indices in drought monitoring is the Normalized Difference Vegetation Index (NDVI), which measures vegetation greenness and has been widely used to track changes in plant health over
time14,15,16,17. Building on the NDVI, the Vegetation Condition Index (VCI) has been developed to offer a more context-sensitive assessment by comparing current NDVI values to historical
ranges, thus identifying anomalies that indicate drought conditions17,18. Studies have shown that VCI can effectively highlight areas experiencing significant vegetation stress relative to
long-term averages, making it a valuable tool for drought monitoring18,19,20. Complementing these indices, the Temperature Condition Index (TCI) incorporates thermal data to evaluate the
impact of temperature on vegetation health21. TCI helps distinguish between vegetation stress caused by temperature extremes and other factors, thereby providing a more nuanced understanding
of drought conditions22. The Vegetation Health Index (VHI) integrates both NDVI and TCI to deliver a comprehensive view of vegetation health2. This combined index has been demonstrated to
improve the accuracy of drought severity assessments by capturing both biophysical and thermal stressors on vegetation23. Research indicates that VHI is particularly effective in diverse
climatic conditions, enhancing its applicability across different geographic regions2,20,23. The integration of these satellite-based indices into environmental monitoring systems has
significantly advanced the field of drought assessment9,18,19. Studies have validated their efficacy in various settings, from arid and semi-arid regions to agricultural landscapes,
underscoring thei
r versatility and robustness2,15,20,24,25,26,27. As remote sensing technologies continue to evolve, these indices are expected to become even more precise, further aiding in the timely and
accurate assessment of drought severity and informing mitigation strategies. While existing studies have demonstrated the efficacy of VCI, TCI, and VHI in drought monitoring, several
critical gaps remain unaddressed. First, many prior applications of these indices focus on large-scale or homogeneous regions, often overlooking localized variations in diverse topographies
like Lorestan Province, where microclimates and elevation gradients may significantly alter drought impacts. Second, while integrated indices are well-validated for general vegetation
assessment, their adaptation to region-specific drought dynamics—particularly in semi-arid, agriculturally vulnerable zones like Lorestan—has not been thoroughly explored. This study aims to
assess drought severity using these vegetation indices, leveraging their unique capabilities to provide a detailed and nuanced understanding of drought dynamics in the Lorestan area. The
necessity of examining drought in Lorestan Province, Iran, stems from its significant impact on the region’s agricultural productivity, water resources, and overall environmental
sustainability. Lorestan, with its diverse topography and climatic conditions, is particularly vulnerable to the adverse effects of prolonged dry periods28. These drought conditions not only
threaten the livelihoods of local farming communities but also jeopardize the delicate balance of the region’s ecosystems. As climate change continues to exacerbate the frequency and
intensity of drought events, it becomes imperative to implement robust monitoring and assessment strategies. By focusing on Lorestan, tailored drought management practices can be developed
that address the specific needs and challenges of the region, thereby enhancing resilience and promoting sustainable development in this critical area. By integrating data from
satellite-based indices, the multifaceted nature of drought and its varied impacts on different regions and ecosystems can be captured. This comprehensive approach not only enhances the
ability to monitor current drought conditions but also improves predictive models, thereby supporting more effective drought management and mitigation strategies. As Lorestan area faces the
escalating challenges posed by climate change, such advanced methodologies are essential for safeguarding environmental health, ensuring agricultural sustainability, and maintaining water
security.
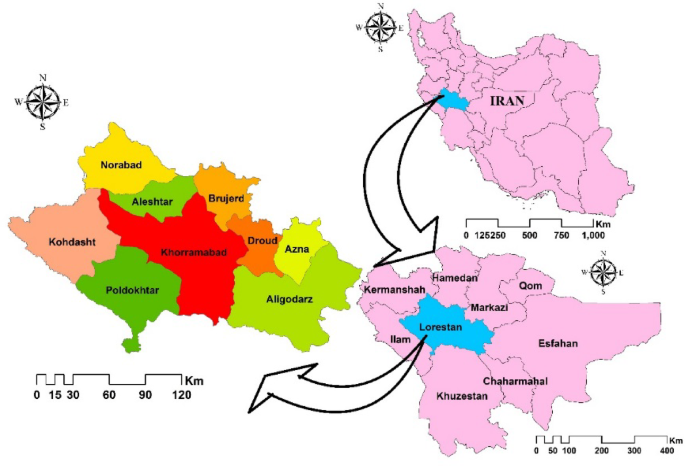
Materials and methodsCase studyLorestan province, located in western Iran, is situated between latitudes 32°00′ to 34°30′ N and longitudes 47°34′ to 49°30′ E (Fig. 1). Geographically, it spans diverse landscapes including
mountainous regions, with elevations ranging from approximately 500 m to over 4000 m above sea level in the Zagros Mountains. The province experiences a continental climate characterized by
hot summers and cold winters. Annual precipitation averages vary across different parts of Lorestan, generally ranging from 400 to 800 mm, with higher amounts in the mountainous areas. The
average temperature in Lorestan ranges from 10 to 25 °C, depending on elevation and season. The region faces periodic drought conditions, especially in its more arid plains and lowland
areas, necessitating effective water resource management and agricultural practices to mitigate the impacts of water scarcity28. This area is characterized by diverse vegetation cover,
ranging from dense forests in its northern regions to semi-arid plains in the south. Oak, walnut, and almond trees dominate the mountainous areas, contributing to a rich biodiversity that
supports various wildlife species29. In contrast, the southern plains feature sparse vegetation such as shrubs and grasses adapted to arid conditions. The province experiences periodic
droughts due to its continental climate, exacerbated by uneven rainfall distribution across seasons and geographical zones. These drought events significantly impact agriculture, livestock,
and local communities reliant on natural water sources.
Fig. 1Location map of the study area.
Full size imageMethodologyIn this study, Landsat satellite data from the years 2004, 2014, and 2024 were used to evaluate and monitor agricultural drought in the Lorestan region (Table 1). All preprocessing,
processing, and post-processing stages on the remote sensing data were conducted using the TerrSet software environment. To analyze drought, the indices NDVI, VCI, TCI, and VHI were
utilized. The process of analyzing satellite imagery involves three main stages: preprocessing, processing, and post-processing. In the preprocessing stage, raw satellite data undergoes
critical adjustments to enhance its accuracy and usability. This includes radiometric calibration to correct sensor noise and atmospheric correction to eliminate distortions caused by
atmospheric gases, water vapor, and aerosols. The raw satellite imagery underwent radiometric and atmospheric correction using ENVI 5.6 with the FLAASH (Fast Line-of-sight Atmospheric
Analysis of Spectral Hypercubes) module. Radiometric calibration converted digital numbers to reflectance values. In FLAASH, we selected the MODTRAN5 radiative transfer model with the
mid-latitude summer atmospheric profile and rural aerosol model. Water vapor retrieval was enabled using the 1135 nm band, and adjacency correction was applied to minimize scattering
effects. Aerosol optical thickness was estimated via the 2-band (K-T) method. Final reflectance data was masked for clouds and outliers before further analysis. Additionally, geometric
correction aligns the images spatially to a standardized map projection, compensating for Earth’s curvature and terrain variations. Moving to the processing stage, the focus shifts to
extracting meaningful information from the preprocessed data. Following classification, the post-processing stage evaluates the accuracy and reliability of the classified results. This
includes conducting an overall accuracy assessment by comparing the classified map with ground truth data. An error matrix, or confusion matrix, quantifies the agreement between the
classified and reference data, offering insights into the classification’s effectiveness. The minimum acceptable threshold for overall accuracy is 85%30. Moreover, the Kappa coefficient is
calculated to measure the classification’s agreement beyond chance, providing a more robust assessment of accuracy. Error matrix analysis further identifies specific areas of
misclassification, aiding in understanding the sources and implications of classification errors31. Together, these stages ensure that satellite image analysis produces reliable information
for various applications, including environmental monitoring, land use planning, and disaster management. The stages of conducting research include the following steps:
a.Data collection
Landsat satellite imagery from 2004, 2014, and 2024 was acquired for the Lorestan region. The satellite images from Landsat 7, Landsat 8, and Landsat 9 for the years 2004, 2014, and 2024
were acquired via the USGS Earth Explorer.
b.Data preprocessing
Preprocessing of the satellite images was performed in TerrSet to ensure data quality and accuracy. This included radiometric calibration, atmospheric correction, and geometric
correction.
c.Index calculation
NDVI Index was calculated from the preprocessed satellite images.
VCI Index was computed to reflect vegetation health based on NDVI variations.
TCI Index was derived to assess vegetation response to temperature.
VHI Index was calculated by combining VCI and TCI to provide a comprehensive measure of vegetation health.
d.Data analysis
The calculated satellite-based indices were analyzed to assess the spatial and temporal patterns of agricultural drought in the Lorestan region over the specified years.
The results were interpreted to understand the severity and extent of drought conditions and their impact on agricultural activities.
This method provided a robust framework for monitoring and analyzing agricultural drought using remote sensing data and advanced drought indices (Fig. 2).
The validation process integrates field measurements, official records, and expert evaluation to ensure a robust accuracy assessment. The study collects 127 georeferenced field plots (30 ×
30 m) coinciding with satellite overpasses, soil moisture, and land cover characteristics. These field data are supplemented with the Lorestan Agricultural Organization’s annual drought
reports and meteorological records from 58 stations.
Table 1 Details of Landsat satellite images for the years 2004, 2014, and 2024.Full size tableFig. 2Methodological framework for the study.
Full size imageNDVI is one of the most well-known, simplest, and most practical vegetation indices. NDVI is calculated using the following equation16:
$${\text{NDVI}}=\left( {{\text{NIR}}\, -\,{\text{Red}}} \right)/\left( {{\text{NIR}}\,+\,{\text{Red}}} \right)$$
where NIR is the reflectance recorded in the near-infrared band and Red is the reflectance recorded in the red band. The NDVI values range between − 1 and 1. Typical values of NDVI for
various land cover types are as follows15:
Sparse: −0.05 to 0.2.
Moderate: 0.2 to 0.6.
Dense: 0.6 to 0.8.
Bare: Approximately 0.05.
VCI reflects rainfall variability better than NDVI, especially in heterogeneous areas17. VCI describes the spatial and temporal variations in vegetation cover and indicates the impact of
weather on vegetation18. VCI is calculated using the following equation17:
$${\text{VCI}}\,=\,100 \times \left( {{\text{NDVIi}} - {\text{NDVImin}}} \right)/\left( {{\text{NDVImax}} -{\text{NDVImin}}} \right)$$
In this equation, NDVImin and NDVImax represent the minimum and maximum NDVI values for each month, respectively. High VCI values indicate non-drought or healthy vegetation conditions, while
values close to zero indicate severe drought. VCI values below 35% denote drought conditions, while values near 50% or higher indicate normal or relatively good thermal conditions.
TCI measures the vegetation’s response to temperature. TCI is calculated using the following equation22:
$${\text{TCI}}\,=\,100 \times \left( {{\text{BTmax}} - {\text{BTi}}}\right)/\left( {{\text{BTmax}} - {\text{BTmin}}} \right)$$
In this equation, BT is the brightness temperature of the target pixel, while BTmax and BTmin are the maximum and minimum brightness temperatures for each pixel over the specified time
period, respectively (in Kelvin, K)22. Persistently low TCI values indicate drought development. TCI values below 35% denote drought conditions, while values near 50% or higher indicate
normal or relatively good thermal conditions.
VHI combines the TCI and VCI to indicate both thermal and moisture conditions of vegetation20. VHI provides a reliable tool for drought monitoring and crop assessment when used together. VHI
is calculated using the following equation2:
$$VH = a \times VCI + (1-a) \times TCI.$$The coefficient a determines the relative contribution of TCI and VCI to the VHI. If the specific value for a is not known for a particular region, it is typically set to 0.5 for equal
weighting22. VHI values below 10% indicate extremely severe drought, values between 10% and 20% indicate severe drought, values between 20% and 30% indicate moderate drought, values between
30% and 40% indicate mild drought, and values above 40% indicate no drought.
ResultsThe overall accuracy and Kappa coefficient for the years 2004, 2014, and 2024 are 92.4% and 87.6, 91.8% and 88.7, and 93.6% and 91.2, respectively. These metrics indicate the reliability and
agreement of the land cover classification results over these years, with the highest accuracy and Kappa coefficient observed in 2024, suggesting improved classification precision and
consistency in the most recent dataset. The analysis of the NDVI data for the years 2004, 2014, and 2024 indicates significant changes in land cover over time (Fig. 3). The area of bare land
has consistently increased from 7593.6 km2 (26.8%) in 2004 to 8783.2 km2 (31.0%) in 2014 and further to 9887.5 km2 (34.9%) in 2024 (Table 2). Similarly, the area with sparse vegetation also
shows an increase from 10634.9 km2 (37.6%) in 2004 to 11155.5 km2 (39.4%) in 2024, though the rise is less pronounced. This trend may indicate a gradual degradation of more densely
vegetated areas. In contrast, the moderately vegetated area initially increased from 6251.5 km2 (22.1%) in 2004 to 6867.8 km2 (24.3%) in 2014, but then decreased to 5842.5 km2 (20.6%) in
2024, suggesting a shift towards more sparsely vegetated or bare land. Most notably, the area with dense vegetation has sharply declined from 3824.4 km2 (13.5%) in 2004 to 1418.7 km2 (5.0%)
in 2024, reflecting possible deforestation, climate change impacts, or detrimental human activities. Overall, these changes highlight a worrying environmental trend of decreasing dense
vegetation and increasing bare and sparsely vegetated areas, underscoring the need for better management and conservation efforts to reverse this degradation.
Fig. 3NDVI maps of the study area.
Full size imageTable 2 Statistical distribution of NDVI.Full size tableBased on the VCI data from 2004, 2014, and 2024, there is a clear trend indicating worsening drought conditions over the two decades (Fig. 4). The area experiencing no drought decreased
significantly from 77.4% in 2004 to 66.1% in 2014 and further to 64.9% in 2024 (Table 3). Concurrently, the area affected by mild drought increased from 17.4% in 2004 to 25.8% in 2014 and
slightly to 26.05% in 2024. Additionally, moderate drought conditions expanded from 5.2% in 2004 to 8.1% in 2014 and to 9.02% in 2024 (Fig. 5). Notably, there were no instances of severe
drought recorded in any of the years analyzed. These findings highlight a gradual but persistent increase in drought severity, emphasizing the need for enhanced drought management and
mitigation strategies. The analysis of the VCI data reveals a clear trend of increasing drought conditions. The areas experiencing no drought have significantly decreased, while mild and
moderate drought conditions have become more prevalent. Although severe drought has not been reported, the rising trend in mild and moderate droughts underscores the growing impact of
drought on the region. This trend necessitates urgent attention to drought mitigation and adaptation strategies to manage and reduce the adverse effects of drought on vegetation and overall
ecosystem health.
Fig. 4Map of spatial distribution of drought based on VCI.
Full size imageTable 3 Statistical distribution of VCI.Full size tableFig. 5Changing pattern of DS according to VCI.
Full size imageBased on the TCI data from 2004, 2014, and 2024 (Fig. 6), the area experiencing no drought has decreased significantly from 68.6% (19,410.92 km2) in 2004 to 67.1% (19,029.37 km2) in 2014 and
further to 57.8% (16,358.37 km2) in 2024 (Table 4). In contrast, the area affected by mild drought increased from 17.8% (5025.19 km2) in 2004 to 19.1% (5427.42 km2) in 2014 and surged to
28.5% (8064.62 km2) in 2024 (Fig. 7). Moderate drought areas remained relatively stable between 2004 (7.5%, 2149.79 km2) and 2014 (7.6%, 2143.33 km2), but increased to 10.6% (3054.85 km2) in
2024. The area experiencing severe drought slightly declined from 6.1% (1718.39 km2) in 2004 to 6.2% (1704.18 km2) in 2014, and then dropped significantly to 2.9% (826.45 km2) in 2024.
Notably, no instances of extreme drought were recorded during these years.
Fig. 6Map of spatial distribution of drought based on TCI.
Full size imageTable 4 Statistical distribution of TCI.Full size tableFig. 7Changing pattern of DS according to TCI.
Full size imageBased on the VHI data from 2004, 2014, and 2024 (Fig. 8), the area experiencing no drought has decreased significantly from 64.6% (18,292.5 km2) in 2004 to 54.5% (15,429.7 km2) in 2014 and
further to 49.9% (14,124.3 km2) in 2024 (Table 5). Meanwhile, the area affected by mild drought increased from 28.4% (8030.1 km2) in 2004 to 34.3% (9703.5 km2) in 2014 and slightly to 34.9%
(9878.2 km2) in 2024. Moderate drought areas expanded from 7.0% (1981.7 km2) in 2004 to 11.2% (3171.1 km2) in 2014 and further to 15.2% (4301.8 km2) in 2024 (Fig. 9). Notably, there were no
instances of severe or extreme drought recorded during these years. These findings reveal a trend towards worsening drought conditions, with a marked increase in areas experiencing mild and
moderate drought, underscoring the importance of implementing effective drought mitigation measures.
Fig. 8Map of spatial distribution of DS according to VHI assessment.
Full size imageTable 5 Statistical distribution of VHI.Full size tableFig. 9Changing pattern of DS according to VHI.
Full size imageDiscussionThe integrated analysis of land cover changes and drought indices from 2004 to 2024 reveals significant environmental transformation across Lorestan. Vegetation indices show a clear pattern
of increasing drought severity, with drought-free areas consistently shrinking while mild and moderate drought zones expand annually. This trend correlates strongly with visible landscape
changes, where bare lands have progressively replaced vegetated areas over the study period. The NDVI data demonstrate a fundamental shift in ecosystem composition, with dense vegetation
cover dramatically declining while moderately vegetated areas show concerning instability. These changes reflect a climate-vegetation feedback loop where rising land surface temperatures
reduce soil moisture, stressing vegetation communities and ultimately diminishing their capacity to moderate local microclimates. The VHI synthesis provides particularly compelling evidence
of this deterioration, showing steady progression toward more arid baseline conditions. The observed expansion of moderate drought areas, coupled with the absence of severe drought
conditions, can be attributed to several key factors:
Climatic Patterns: Lorestan’s semi-arid climate typically experiences prolonged dry periods that manifest as moderate rather than extreme drought conditions.
Agricultural Adaptation: Local farming practices and irrigation systems may be mitigating the progression to severe drought levels.
Vegetation Resilience: The region’s native vegetation shows moderate drought tolerance, potentially delaying the onset of severe drought conditions.
Temporal Resolution: Our 10-year study intervals (2004-2014-2024) may not capture shorter-term severe drought events.
This pattern suggests that while climate pressures are increasing (as shown by expanding moderate drought), the region’s natural and managed systems are currently preventing escalation to
severe drought levels. However, the sustained expansion of moderate drought areas indicates growing vulnerability that warrants close monitoring. While the absence of severe drought
classifications might initially appear encouraging, this actually suggests landscapes are becoming “drought-hardened” - a phenomenon where degraded ecosystems no longer register extreme
stress because they have permanently adapted to arid conditions. Spatial analysis confirms previously resilient areas are now showing persistent stress patterns, likely due to combined
climate change impacts and human activities. The most recent data reveal an acceleration in these trends compared to earlier decades, indicating potential non-linear degradation.
Particularly vulnerable are transitional vegetation zones that appear to be approaching ecological thresholds. These areas warrant urgent research attention as potential early warning
indicators for broader system collapse. From a management perspective, the synchronized shifts across all drought indices underscore the value of integrated monitoring systems. The
documented changes, while not yet catastrophic, clearly signal the need for immediate intervention strategies. Recommended measures include adopting drought-resistant agricultural practices,
implementing strict land-use protections for remaining vegetated areas, and initiating large-scale watershed restoration projects. The observed patterns mirror early-stage desertification
processes documented in similar semi-arid regions globally. Without rapid, science-based policy responses, Lorestan risks permanent ecological transitions that would fundamentally alter its
agricultural capacity and biodiversity. The observed intensification of drought conditions aligns with regional climate change projections for western Iran, which predict increasing
temperatures and declining precipitation reliability28. The 20-year trend of rising thermal stress (TCI) and vegetation stress (VCI) particularly corresponds to IPCC (Intergovernmental Panel
On Climate Change) projections of amplified aridity in Mediterranean-climate regions21. The VCI data reflects not just temporary fluctuations but a persistent deterioration in vegetation
vitality18. This degradation can lead to a cascade of ecological consequences, including reduced agricultural yields, loss of biodiversity, and weakened ecosystem services such as soil
stabilization and water filtration17,18,19,20. The transition from healthy to mildly and moderately drought-affected areas signifies a critical threshold being crossed, where the resilience
of vegetation is compromised2. This ongoing stress makes ecosystems more vulnerable to future climate variability and extreme weather events20. Therefore, the VCI data is crucial for
informing sustainable land
management practices and developing targeted drought mitigation strategies. Enhanced monitoring, adaptive agricultural techniques, and the preservation of native vegetation are essential to
counteract these adverse trends and support ecosystem recovery and resilience. The TCI maps provides valuable insights into the thermal stress affecting vegetation and its implications for
drought severity. Over the observed years, TCI data indicates a significant shift in climate patterns, with increasing areas experiencing mild and moderate drought conditions. This trend
suggests that higher temperatures are exacerbating the frequency and intensity of droughts, adversely impacting soil moisture levels and plant physiology. The rise in mild drought conditions
reflects the initial stages of thermal stress, where plants begin to experience reduced growth rates and early signs of water deficiency. Moderate drought conditions, on the other hand,
indicate more severe stress where plants may exhibit stunted growth, wilting, and reduced productivity. The consistent presence of these conditions across the years’ points to a changing
climate that is steadily becoming less conducive to optimal plant growth4. This thermal stress not only affects crop yields but also influences the broader ecosystem, disrupting the natural
balance and resilience7. The absence of severe and extreme drought conditions in the TCI data may provide a silver lining, suggesting that while conditions are worsening, they have not yet
reached the most critical levels. However, the persistent increase in milder drought categories underscores the urgency for proactive measures. Adaptation strategies such as the development
of heat-tolerant crop varieties, improved irrigation techniques, and effective water management policies are essential to mitigate the impacts of rising temperatures and sustain agricultural
productivity and ecosystem health in the long term. The comparative analysis of satellite-based indices highlights the strengths and limitations of each index. NDVI serves as a primary
indicator of vegetation health, while VCI and TCI refine this assessment by accounting for temporal variability and temperature stress, respectively8,9. VHI’s integration of these indices
provides a comprehensive assessment tool that captures the multifaceted nature of drought impacts. In practical terms, the combined use of these indices in a remote sensing framework
enhances the accuracy and reliability of drought monitoring and assessment10. This approach allows for the early detection of drought conditions, facilitating timely intervention and
mitigation efforts12. Moreover, the ability to monitor drought on a large scale and over extended periods provides valuable data for long-term climate and vegetation studies, contributing to
more informed decision-making in agriculture, water resource management, and environmental conservation. These consistent findings across different timeframes reinforce the urgenc
y for enhanced drought management strategies. The increasing prevalence of drought conditions underscores the need for comprehensive environmental policies focused on sustainable water
management, reforestation, and climate adaptation measures. Implementing such strategies can help mitigate the adverse effects of drought, protect agricultural productivity, and preserve
ecosystem health. This comparative analysis highlights the importance of ongoing monitoring and adaptive management in response to evolving climatic challenges. This study introduces a
integrated approach to assessing agricultural drought severity in Lorestan Region by integrating multiple vegetation indices with high-resolution satellite data, providing a more precise and
localized evaluation compared to conventional methods. The research employs advanced remote sensing techniques to capture real-time vegetation health dynamics, offering a cost-effective and
scalable solution for drought monitoring in semi-arid regions. For policymakers, the findings enable targeted drought mitigation strategies by identifying high-risk areas and optimizing
water resource allocation. Researchers benefit from the methodological framework, which can be adapted to other regions with similar climatic conditions, fostering further studies on climate
resilience and sustainable agriculture. Ultimately, this work bridges the gap between theoretical remote sensing applications and practical agricultural management, supporting
evidence-based decision-making. The extensive consequences of drought for agriculture, water resources, and ecosystem services in Lorestan include: (a)Agricultural impacts: the progressive
expansion of moderate drought areas has direct consequences for Lorestan’s agricultural sector. The VHI-identified stress zones overlap significantly with major rainfed wheat and barley
cultivation areas, suggesting potential yield reductions under current trends. This aligns with recent field studies reporting declining cereal productivity in drought-affected villages15,
(b) Water resource implications: The synchronized deterioration in VCI and TCI indicators correlates with declining groundwater levels in the Kashkan and Seymareh watersheds. Our analysis
suggests the current drought patterns may reduce surface water availability during critical irrigation periods, exacerbating conflicts between agricultural and domestic water use9, and (c)
Ecosystem service degradation: The conversion of moderately vegetated areas to bare land corresponds to: loss in soil organic matter, Increased flash flood frequency in downstream areas, and
Reduced habitat connectivity for key species like Persian oak. These changes mirror ecosystem service valuation studies from similar regions. This study supports the United Nations
Sustainable Development Goals (SDGs) by monitoring drought-driven land degradation (SDG 15), food security risks (SDG 2), and water resource pressures (SDG 6), offering actionable insights
for po
licymakers. The following recommendations are suggested in alignment with the UN SDGs:
(a) SDG 2.4: Promote drought-resistant crops and sustainable farming, (b) -SDG 6.4: Advocate for efficient irrigation systems in drought-prone areas, and (c) -SDG 13.1: Integrate remote
sensing into national climate adaptation strategies. Future research should focus on improving the resolution and accuracy of remote sensing data, as well as developing more sophisticated
algorithms for index calculation and interpretation. Integrating additional data sources, such as soil moisture and precipitation measurements, can further enhance drought monitoring
capabilities. Further studies should incorporate climate model data to: (a) quantify precipitation variability impacts on drought indices, (b) evaluate temperature-precipitation
interactions, and (c) project future drought scenarios under different climate change pathways. Such analysis would strengthen the linkage between observed trends and climate change drivers.
Additionally, advancements in machine learning and artificial intelligence offer promising avenues for automating the analysis and interpretation of remote sensing data32,33,34, making
drought assessment more efficient and accessible. Future research directions could explore deep learning architectures for: (a) predictive modeling of drought progression based on historical
index patterns, (b) automated classification of drought severity using convolutional neural networks, and (c) integration of heterogeneous data sources (e.g., satellite, climate, and soil
data) through ensemble learning approaches.
ConclusionThis study’s findings highlight the critical need for transformative approaches to drought management in Lorestan. Three key policy recommendations emerge: (a) implementation of index-based
drought early warning systems integrating VHI monitoring, (b) targeted adoption of climate-smart agriculture in high-risk zones identified by our analysis, and (c) establishment of
cross-sectoral water governance frameworks to address competing demands. Future research should prioritize: (a) development of predictive models coupling our indices with climate
projections, (b) economic valuation of drought impacts across different land use types, and (c) community-based evaluation of adaptation strategies. The methodological framework presented
here provides a foundation for these advancements while demonstrating the value of integrated remote sensing for regional environmental management. Most importantly, these findings call for
immediate action to prevent the transition from moderate to severe drought conditions that could irreversibly alter Lorestan’s agricultural potential and ecosystem services.
Dataavailability
All data generated or analyzed during this study are included in this published article. The data used in this study, including the vegetation indices and related drought assessment metrics
for the Lorestan region, are available upon reasonable request. Interested researchers can contact the corresponding author for access to the datasets. Due to the nature of the data, which
involves satellite imagery and environmental measurements, certain restrictions may apply in sharing raw data directly, but all derived data supporting the findings of this study are fully
accessible.
References Wang, F. et al. Dynamic variations of agricultural drought and its response to meteorological drought: A drought event-based perspective. J. Geophys. Res. 12, 041044.
https://doi.org/10.1029/2024JD041044 (2024).
Article Google Scholar
Chere, Z. & Debalke, D. B. Modeling agricultural drought based on the earth observation-derived standardized precipitation evapotranspiration index and vegetation health index in the
Northeastern highlands of Ethiopia. Nat. Hazards. 3, 3127–3151. https://doi.org/10.21203/rs.3.rs-2824034/v1 (2024).
Article Google Scholar
Rahman, K. U. et al. A robust integrated agricultural drought index under climate and land use variations at the local scale in Pakistan. Agric. Water Manage. 295, 108748.
https://doi.org/10.1016/j.agwat.2024.108748 (2024).
Article Google Scholar
Jiao, W., Wang, L. & McCabe, M. F. Multi-sensor remote sensing for drought characterization: current status, opportunities and a roadmap for the future. Remote Sens. Environ. 256, 112313.
https://doi.org/10.1016/j.rse.2021.112313 (2021).
Article Google Scholar
Jiang, T., Su, X., Singh, V. P. & Zhang, G. A novel index for agricultural drought monitoring based on ecological water deficit. Ecol. Indic. 129, 107804.
https://doi.org/10.1016/j.ecolind.2021.107804 (2021).
Article Google Scholar
Kumar, V. & Chu, H. J. Spatiotemporal consistency and inconsistency of meteorological and agricultural drought identification: A case study of India. Remote Sens. Appl. Soc. Environ. 33,
101134. https://doi.org/10.1016/j.rsase.2023.101134 (2024).
Article Google Scholar
Pandey, V., Srivastava, P. K., Singh, A. K., Suman, S. & Maurya, S. Techniques and tools for monitoring agriculture drought: A review. Geogr. Inf. Sci. 9, 497–519.
https://doi.org/10.1007/s12517-012-0707-2 (2024).
Article Google Scholar
Bhowmik, S. & Bhatt, B. Drought monitoring using MODIS derived indices and Google Earth engine platform for Vadodara district. Gujarat J. Indian Soc. Remote Sens. 7, 1–16.
https://doi.org/10.1007/s12524-024-01922-1 (2024).
Article Google Scholar
Buzhani, F. I., Sadr, M. K., Sobhanardakani, S., Lorestani, B. & Cheraghi, M. Remote sensing assessment of multi-year drought vulnerability of agriculture in Kangavar, Kermanshah Province,
Western Iran. Nat. Hazards. 4, 3865–3890. https://doi.org/10.21203/rs.3.rs-2982596/v1 (2024).
Article Google Scholar
Wang, F. et al. The response of vegetation dynamics to drought and its driving factors identification in inner Mongolia of China. Ecol. Indic. 164, 112125.
https://doi.org/10.1016/j.ecolind.2024.112125 (2024).
Article Google Scholar
Sur, K. & Lunagaria, M. M. Association between drought and agricultural productivity using remote sensing data: a case study of Gujarat state of India. J. Water Clim. Chang. 11, 189–202.
https://doi.org/10.2166/wcc.2020.157 (2020).
Article Google Scholar
Karimi, M., Shahedi, K., Raziei, T., Miryaghoubzadeh, M. & Moradi, E. Analysis of agricultural drought in Southwest Iran using remote sensing indices. Integr. Drought Manage. 2, 423–444.
https://doi.org/10.1201/9781003276548-23 (2023).
Article Google Scholar
Mustapha, M. & Zineddine, M. An evaluative technique for drought impact on variation in agricultural LULC using remote sensing and machine learning. Environ. Monit. Assess. 6, 515.
https://doi.org/10.1007/s10661-024-12677-0 (2024).
Article Google Scholar
Yoon, D. H. et al. Agricultural drought assessment in East Asia using satellite-based indices. Remote Sen. 12, 444. https://doi.org/10.3390/rs12030444 (2020).
Article ADS Google Scholar
Pouyan, S. et al. Spatiotemporal monitoring of droughts in Iran using remote-sensing indices. Nat. Hazards. 17, 1–24. https://doi.org/10.1007/s11069-023-05847-9 (2023).
Article Google Scholar
Rouse, J. W., Haas, R. H., Schnell, J. A. & Deering, D. W. Monitoring the vernal advancement and retrogradation (green wave effect) of natural vegetation. NASA/GSFC Type II Progress Report.
Greenbelt, MD (1973). https://ntrs.nasa.gov/citations/19750020419
Chere, Z., Abegaz, A., Tamene, L. & Abera, W. Modeling and mapping the Spatiotemporal variation in agricultural drought based on a satellite-derived vegetation health index across the
highlands of Ethiopia. Model. Earth Syst. Env. 8, 4539–4552. https://doi.org/10.1007/s40808-022-01439-x (2022).
Article Google Scholar
Mullapudi, A., Vibhute, A. D., Mali, S. & Patil, C. H. A review of agricultural drought assessment with remote sensing data: Methods, issues, challenges and opportunities. Appl. Geomat. 15,
1–13. https://doi.org/10.1007/s12518-022-00484-6 (2023).
Article Google Scholar
Hakam, O., Baali, A., Azennoud, K., Lyazidi, A. & Bourchachen, M. Assessments of drought effects on plant production using satellite remote sensing technology, GIS and observed climate data
in Northwest Morocco, case of the lower Sebou basin. Int. J. Plant. Prod. 17, 267–282. https://doi.org/10.1007/s42106-023-00236-5 (2023).
Article Google Scholar
Alito, K. T. & Kerebih, M. S. Spatio-temporal assessment of agricultural drought using remote sensing and ground-based data indices in the Northern Ethiopian Highland. J. Hydrol. Reg. 52,
101700. https://doi.org/10.1016/j.ejrh.2024.101700 (2024).
Article Google Scholar
Shahzaman, M. et al. Remote sensing indices for spatial monitoring of agricultural drought in South Asian countries. Remote Sen. 13, 2059. https://doi.org/10.3390/rs13112059 (2021).
Article ADS Google Scholar
Kogan, F. N. Droughts of the late 1980s in the United States as derived from NOAA polarorbiting satellite data. Bull. Am. Meteorol. Soc. 76, 655–668. https://doi.org/10.1175/1520-0477
(1995). (1995)076%3C0655:DOTLIT%3E2.0.CO;2.
Article ADS Google Scholar
Gidey, E., Dikinya, O., Sebego, R., Segosebe, E. & Zenebe, A. Analysis of the long-term agricultural drought onset, cessation, duration, frequency, severity and Spatial extent using
vegetation health index (VHI) in Raya and its environs, Northern Ethiopia. Environ. Syst. Res. 7, 1–18. https://doi.org/10.1186/s40068-018-0115-z (2018).
https://environmentalsystemsresearch.springeropen.com/articles/
Article Google Scholar
Du, T. L. T., Bui, D. D., Nguyen, M. D. & Lee, H. Satellite-based, multi-indices for evaluation of agricultural droughts in a highly dynamic tropical catchment. Cent. Vietnam Water. 10, 659.
https://doi.org/10.3390/w10050659 (2018).
Article Google Scholar
Palchaudhuri, M. & Biswas, S. Application of LISS III and MODIS-derived vegetation indices for assessment of micro-level agricultural drought. Egypt. J. Remote Sens. Space Sci. 2, 221–229.
https://doi.org/10.1016/j.ejrs.2019.12.004 (2020).
Article Google Scholar
Wu, B., Ma, Z. & Yan, N. Agricultural drought mitigating indices derived from the changes in drought characteristics. Remote Sens. Environ. 244, 111813.
https://doi.org/10.1016/j.rse.2020.111813 (2020).
Article Google Scholar
Ghazaryan, G., Dubovyk, O., Graw, V., Kussul, N. & Schellberg, J. Local-scale agricultural drought monitoring with satellite-based multi-sensor time-series. GISci Remote Sens. 5, 704–718.
https://doi.org/10.1080/15481603.2020.1778332 (2020).
Article Google Scholar
Ghobadi, M. & Ahmadipari, M. Enhancing flood susceptibility modeling: A hybrid deep neural network with statistical learning algorithms for predicting flood prone areas. Water Resour. Manag.
8, 2687–2710. https://doi.org/10.1007/s11269-024-03770-7 (2024).
Article Google Scholar
Mansori, M., Badehian, Z., Ghobadi, M. & Maleknia, R. Assessing the environmental destruction in forest ecosystems using landscape metrics and Spatial analysis. Sci. Rep. 13, 15165.
https://doi.org/10.1038/s41598-023-42251-6 (2023).
Article ADS CAS PubMed PubMed Central Google Scholar
Taiwo, B. E. et al. Monitoring and predicting the influences of land use/land cover change on cropland characteristics and drought severity using remote sensing techniques. Environ. Sustain.
Ind. 18, 100248. https://doi.org/10.1016/j.indic.2023.100248 (2023).
Article Google Scholar
Avand, M., Moradi, H. R. & Hazbavi, Z. Interactive changes in climatic and hydrological droughts, water quality, and land use/cover of Tajan watershed, Northern Iran. Water 16, 1784.
https://doi.org/10.3390/w16131784 (2024).
Article CAS Google Scholar
Anees, S. A. et al. Integration of machine learning and remote sensing for above ground biomass estimation through Landsat-9 and field data in temperate forests of the Himalayan region.
Ecol. Inf. 82, 102732. https://doi.org/10.1016/j.ecoinf.2024.102732 (2024).
Article Google Scholar
Anees, S. A. et al. Spatiotemporal dynamics of vegetation cover: Integrative machine learning analysis of multispectral imagery and environmental predictors. Earth Sci. Inf. 18, 1–23.
https://doi.org/10.1007/s12145-024-01673-0 (2025).
Article Google Scholar
Anees, S. A. et al. Unveiling fractional vegetation cover dynamics: A spatiotemporal analysis using modis NDVI and machine learning. Environ. Sustain. Indic. 24, 100485.
https://doi.org/10.1016/j.indic.2024.100485 (2024).
Article Google Scholar
Download references
AcknowledgementsThe authors would like to acknowledge and thank the Lorestan University for their invaluable support provided throughout the current study (grant number: 14031241404).
FundingThis research received no funding.
Author informationAuthors and Affiliations Faculty of Natural Resources, Lorestan University, Khorramabad, Iran
M. Ghobadi
Faculty of Agriculture, Fasa University, Fasa, Iran
Z. Badehian
AuthorsM. GhobadiView author publications You can also search for this author inPubMed Google Scholar
Z. BadehianView author publications You can also search for this author inPubMed Google Scholar
ContributionsM.G.: Conceptualization, Methodology, formal analysis, writing-review and editing; Z.B.: Writing-original draft, data curation.
Corresponding author Correspondence to M. Ghobadi.
Ethics declarations Competing interestsThe authors declare no competing interests.
Additional informationPublisher’s noteSpringer Nature remains neutral with regard to jurisdictional claims in published maps and institutional affiliations.
Rights and permissionsOpen Access This article is licensed under a Creative Commons Attribution-NonCommercial-NoDerivatives 4.0 International License, which permits any non-commercial use, sharing, distribution
and reproduction in any medium or format, as long as you give appropriate credit to the original author(s) and the source, provide a link to the Creative Commons licence, and indicate if you
modified the licensed material. You do not have permission under this licence to share adapted material derived from this article or parts of it. The images or other third party material in
this article are included in the article’s Creative Commons licence, unless indicated otherwise in a credit line to the material. If material is not included in the article’s Creative
Commons licence and your intended use is not permitted by statutory regulation or exceeds the permitted use, you will need to obtain permission directly from the copyright holder. To view a
copy of this licence, visit http://creativecommons.org/licenses/by-nc-nd/4.0/.
Reprints and permissions
About this articleCite this article Ghobadi, M., Badehian, Z. Assessment of agricultural drought severity using multi-temporal remote sensing data in Lorestan region. Sci Rep 15, 18528
(2025). https://doi.org/10.1038/s41598-025-03087-4
Download citation
Received: 20 August 2024
Accepted: 19 May 2025
Published: 27 May 2025
DOI: https://doi.org/10.1038/s41598-025-03087-4
Share this article Anyone you share the following link with will be able to read this content:
Get shareable link Sorry, a shareable link is not currently available for this article.
Copy to clipboard Provided by the Springer Nature SharedIt content-sharing initiative
KeywordsDrought severity (DS)Spatial monitoringSemi-arid ecosystemRemote sensingAgricultural drought