Global online social response to a natural disaster and its influencing factors: a case study of typhoon haiyan
- Select a language for the TTS:
- UK English Female
- UK English Male
- US English Female
- US English Male
- Australian Female
- Australian Male
- Language selected: (auto detect) - EN
Play all audios:

ABSTRACT The global public interest in a natural disaster event will help disaster-stricken areas obtain post-disaster international relief and assistance. However, knowledge gaps still
exist in regard to global online social responses and their socioeconomic influencing factors. We used big social media data regarding the 2013 Super Typhoon Haiyan to explore global online
social responses and to investigate the socioeconomic factors influencing this behavior based on the Geographical Detector (Geodetector) model and geographically weighted regression (GWR)
model. The results show that global online social responses have little relation with geographical distance and follow the disaster’s development. In addition to the most response in the
disaster-affected countries, Western countries and neighboring countries have more online social response to the disaster than other regions. Among all the influencing factors, economic
factors have the strongest effect on public interest both before and after the typhoon’s landfall. Our findings indicate that online social users are of great potential for volunteers and
donors. SIMILAR CONTENT BEING VIEWED BY OTHERS CROSS-PLATFORM ANALYSIS OF PUBLIC RESPONSES TO THE 2019 RIDGECREST EARTHQUAKE SEQUENCE ON TWITTER AND REDDIT Article Open access 31 January
2022 TWITTER DATA FROM THE 2019–20 AUSTRALIAN BUSHFIRES REVEALS PARTICIPATORY AND TEMPORAL VARIATIONS IN SOCIAL MEDIA USE FOR DISASTER RECOVERY Article Open access 08 October 2022 EVENT
TRIGGERS AND OPINION LEADERS SHAPE CLIMATE CHANGE DISCOURSE ON WEIBO Article Open access 24 February 2025 INTRODUCTION Natural disasters frequently occur around the world and bring massive
casualties, economic losses, and social disruptions to countries and international society (Shen et al., 2018; United Nations Office For Disaster Risk Reduction (2020)). The synergies
between disaster risk reduction and sustainable development require global efforts (Aitsi-Selmi et al., 2016). Especially for developing countries and less developed regions, international
humanitarian assistance and foreign governmental aid are particularly essential for disaster risk reduction and mitigation (Cook et al., 2018). In addition to governmental rescuing relief
and financial and economic assistance, donations from the foreign private sector are critical resources for disaster-stricken countries (Coppola, 2020). Evidence has confirmed the
significant impact of disasters on global public interest and responses (David et al., 2016; Tan and Maharjan, 2018; Kam et al., 2021). Online social responses are the main reflection of
public interest, especially on a global scale. Due to the unbelievably rapid progress in information and communication technologies and personal mobile devices, online social networks have
become a vital and primary channel of information communication and dissemination (Tang et al., 2021). Before, during, and after the occurrence of a disaster event, global social media users
are highly active in posting, discussing, and forwarding the situation (Kumar, 2020). In this manner, information related to a local disaster event can be enhanced and immediately
disseminated to and spread through international society. Consequently, a local natural disaster, especially a catastrophic disaster, will provoke global social responses and attract more
significant public interest through online social networks (Ruan et al., 2022). Thus, aid agencies and humanitarian organizations are increasingly aware of the significance of communication
during natural disasters, which is conducive to not only the effective implementation of relief but also timely social responses, and it can stimulate the enthusiasm of donors even in remote
countries (Kam et al., 2021). Understanding global social responses to disaster events and the influencing factors will help integrate global society, enterprises, nongovernmental
organizations and other social forces to participate in humanitarian assistance. This is of great significance and key to post-disaster reconstruction for impoverished countries.
Nevertheless, research on global public interest in or online social responses to a disaster is still a challenging issue, and it is even more difficult on a global scale. Existing research
on online social responses follows three narratives: the emotions of social media users, the themes of social media posts, and the Twitter communication mechanism. In a study on users’
emotions after a disaster, Chen et al. (2020) explored the emotions and Twitter forwarding patterns of affected and nonaffected areas before and after the disaster, revealing the significant
impact of public emotional expression on the release and redistribution of disaster-related information. Later, scholars further studied the spatial and temporal distribution
characteristics of people’s negative emotions caused by disasters. Garske et al. (2021) used the global and local Moran’s I to analyze Twitter data with geographic references and negative
emotions and found that all negative emotions were clustered in the local space during a disaster. Gruebner et al. (2018) used an ordinary least squares regression model to evaluate the
association between pre-disaster and post-disaster discomfort rates and to detect spatial clusters of negative emotions in various administrative regions of New York City. In addition, some
scholars have combined machine learning methods to assess regional post-disaster reconstruction recovery by studying the emotions and perspectives of social media users after a disaster (Yan
et al., 2020; Contreras et al., 2022). In research on the posting themes of social media users, García-Ramírez et al. statistically analyzed the posting themes of social media users only in
the disaster response stage (García-Ramírez et al., 2021). Brandt et al. analyzed the posting themes of social media users during the pre-disaster, disaster occurrence, and post-disaster
short-term and long-term periods (Brandt et al., 2019). Zhang and Cheng used a machine learning method to classify social media data, explored the change process of the public’s discussion
topics at different stages during disasters, and analyzed the differences in people’s discussion content under different emotions (Zhang and Cheng, 2021). Some scholars have also studied
different themes of online social response when disasters occur. Correlation analyses demonstrate that there are differences in themes between different genders and between black and white
groups when extreme disasters occur (Yuan et al., 2020; Zhu and Liu, 2021). Regarding the transmission mechanism of Twitter, Takahashi et al. investigated the use of Twitter when and after
Typhoon Haiyan hit the Philippines and explored the external factors (using time and geographical location) and internal factors affecting the use of social media (Takahashi et al., 2015).
However, the area covered by this study covered only affected countries. Kam et al. (2021) established a model to simulate global attention to disaster events by using the relative search
activities of users of Google products, revealing that Western countries play a dominant role in global attention to disasters. However, there is still a lack of understanding of global
online social responses to disaster events and their influencing factors. Applications of social media data in the global public interest to disaster events have not been well investigated
due to the lack of typical datasets. To fill this knowledge gap, this study takes the 2013 Super Typhoon Haiyan, a historic deadly disaster in the western Pacific, as a representative case
to investigate the spatiotemporal changes in global social responses and to attribute their socioeconomic influencing factors in various countries. DATA AND METHODS OVERVIEW OF TYPHOON
HAIYAN Super Typhoon Haiyan is one of the most representative extreme disaster events. As the most powerful typhoon (maximum sustained winds near the center of 315 km/h) ever recorded in the
western Pacific, it swept across the Philippines and other regions (Fig. 1) and caused severe losses to the Philippines. According to official statistics, the direct economic loss suffered
by the Philippines was approximately 8.96 billion Philippine pesos (approximately 1.63 billion current US dollars), and more than 16 million people were affected by the disaster (NDRRMC
Philippines, 2013). Due to its historic intensity and damage power, Super Typhoon Haiyan attracted global attention and public interest, and information flooded Twitter (David et al., 2016;
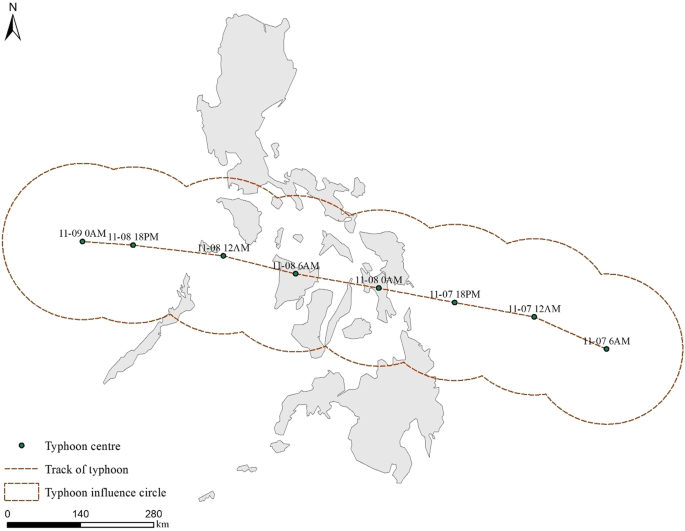
Shen et al., 2021). The track of Typhoon Haiyan is shown in Fig. 3. Typhoon Haiyan generated and developed rapidly in the South Pacific Ocean on November 4, 2013. It was officially upgraded
to a tropical storm. On November 8, Typhoon Haiyan made landfall along the coast of Guiuan in the Philippines with extremely destructive winds, causing devastating damage to the country.
Typhoon Haiyan entered the central South China Sea on November 9, and its intensity significantly weakened. Affected by the circulation and the northeast monsoon, Typhoon Haiyan turned to
the north on November 10 and attacked the Hainan Province of China. On November 11, due to the further influence of topography and wind direction, the intensity of Typhoon Haiyan rapidly
weakened, and it gradually dissipated. DATA AND PREPROCESSING Tweets were obtained from the Twitter platform using disaster hashtags and web crawler scripts based on the method and data
provided in previous publications (Murzintcev and Cheng, 2017; Shen et al., 2021; Zhang et al., 2021). The resulting global tweets related to Typhoon Haiyan from November 4 to 20, 2013,
totaled 234,042. The data contain the location attributes or mobile phone location addresses of social media users and were then geo-decoded into points through ArcGIS 10.7 software. In
total, there are 113 countries included in the following attributional analysis of this study (Fig. 2). Countries were filtered out based on two criteria: (1) tweets from a country are
missing or number less than 30; and (2) the subsequent acquisition of relevant data on influencing factors. In addition, due to a very low penetration rate of Twitter users, China was
excluded from this study. Therefore, the countries in the attribution analysis include 8 South American countries, 10 countries in North America, 27 countries in Asia, 33 European countries,
33 countries in Africa, and two Oceania countries (Australia and New Zealand). The influencing factors and data sources in this study are shown in Table 1. In the era of globalization, the
interpretation of online social responses to disasters is quite complex. They interact with political power, surrounding social relations and cultural significance and the process of global
interdependence (Kam et al., 2021). Therefore, this paper explores the political, economic, social, cultural, natural and demographic factors that affect the differences in online social
responses to a disaster in different countries. All of the specific factors and corresponding indices are 2013 values. (1) Political dimension: The government effectiveness can be used to
measure the quality of public and civil services, independence from political pressure, the quality of policy formulation and implementation, and the credibility of the government’s
commitment to such policies around the world (Sadaf et al., 2018). People in high government effectiveness countries have more willingness to express their response to natural disasters. (2)
Economic dimension: The level of economic development can reflect people’s capability to aid foreign countries in a country. The economic development of a country can be measured by per
capita GDP. If a country is more connected to other countries, its citizens are more interested in international events. Therefore, exports of goods and services are selected to measure the
degree of trade openness. (3) Social dimension: Transparent countries advocate the construction of a harmonious and mutually supportive society (Raschky and Schwindt, 2012). The corruption
perceptions index (CPI) can be used to measure the social development of a country and the position of the national public toward foreign aid. Citizens of countries with higher levels of
social development may have more empathy and willingness to respond to foreign disasters. (4) Cultural dimension: Culture affects people’s willingness to call for help and their views on
aid, and it is an important background for people to understand and respond to disasters (Hoffman and Oliver-Smith, 2002). The level of education explains the level of public awareness of
disasters, which is measured by the higher education enrollment rate here (Zhang and Cheng, 2021). In addition, different religions have different understandings of humanitarianism, which
will also affect people’s response to disasters to some extent. Here, religious influence is measured by the proportion of mainstream religious beliefs (i.e., Christianity, Islam, Buddhism,
Hinduism) and the proportion of nonreligious beliefs in a country. (5) Natural dimension: The risks of natural disasters in a country will affect the sensitivity and attention of domestic
people to extreme disaster events. The expected death rate, the affected population rate and the GDP loss rate can be used to measure the comprehensive natural disaster risk level of each
country. In addition, distance is an obstacle to generously responding to others’ needs or caring actions, and it is one of the determinants of online social responses to disaster events.
The geographical distance between countries and disaster places is expressed by the Euclidean distance from different country capitals to Manila calculated with ArcGIS. (6) Demographic
dimension: The social media user base of a country will affect people’s response to disasters. Due to the lack of precise accounts of Twitter users in each country in 2013, a country’s total
population is employed as a proxy index to indicate the number of social media users. RESEARCH WORKFLOW The specific research flow of this study is shown in Fig. 3. In this study, we used
the number of disaster-related tweets posted over a period to represent the online social response to a disaster. Hence, the daily online social response was obtained by calculating the
number of daily tweets issued in a region using the zonal statics tool in ArcGIS 10.7. We calculated the daily global and country-wide online social response to analyze the spatiotemporal
evolution of online social responses around the world. Based on its temporal changes, the research period is divided into two stages: before and after the typhoon lands. Then, the online
social response changes before and after the typhoon lands are mapped and revealed by calculating the number of tweets and the relative and absolute differences in the two stages. This study
focuses on investigating the influencing factors of online social responses. First, we selected indicators combined with the literature, collected data (details in Section 2.3), conducted a
single-factor analysis of the differences in online social responses to disasters in various countries using the Geographical Detector (Geodetector), and then selected the leading factors
for the geographically weighted regression (GWR) model for multifactor analysis. Finally, the spatial differentiation of influencing factor coefficients and the variation in the influencing
factor coefficients before and after typhoon landing are discussed. STANDARD DEVIATION ELLIPSE In this paper, the standard deviation ellipse is used to quantitatively describe the spatial
distribution characteristics of global social media users’ attention to extreme disaster events. This method can explain the spatial distribution characteristics of geographical elements
from global and spatial perspectives (Lefever, 1926). Its calculation formula is as follows: $$\begin{array}{*{20}{c}} {SDE_x = \sqrt {\frac{{\mathop {\sum }\nolimits_{i = 1}^n \left( {x_i -
\bar{x}} \right)^2}}{n}} } \end{array}$$ (1) $$\begin{array}{*{20}{c}} {SDE_y = \sqrt {\frac{{\mathop {\sum }\nolimits_{i = 1}^n \left( {y_i - \bar{y}} \right)^2}}{n}} } \end{array}$$ (2)
In the formulas, _x__i_ and _y__i_ are the coordinates of the _i_th subregion. \(\bar{x}\) and \(\bar{y}\) represent the coordinates of the center of gravity of subregion _i_. _n_ is the
total number of subregions. GEOGRAPHICAL DETECTOR There are a large number of factors selected in attribution analysis, and multicollinearity among factors easily occurs; leading factors and
invalid factors cannot be filtered out. Therefore, this paper utilized the Geodetector model (Wang et al., 2010) to explain the driving forces influencing online social responses to
disaster events in various countries. Its calculation formula is as follows: $$q = 1 - \frac{{\mathop {\sum}\nolimits_{h = 1}^L {N_h\sigma _h^2} }}{{N\sigma ^2}}$$ (3) In the formula, _q_ is
the measurement factor of the explanatory power of the independent variable, and the range is [0,1]. _L_ is the independent variable. _N_ and _N__h_ are the number of samples in the whole
study area and layer _h_, respectively. σ_h_2 and σ2 are the variances in the Y value of layer _h_ and the whole study area, respectively. GEOGRAPHICALLY WEIGHTED REGRESSION In this paper,
before fitting the GWR model, it is necessary to use spatial autocorrelation to test whether there is an agglomeration of an attribute in space. Moran’s I index is generally used to describe
the spatial characteristics of the distribution of an attribute in the study area (Moran, 1950). Its calculation formula is as follows: $$\begin{array}{*{20}{c}} {I = \frac{{n\mathop
{\sum}\nolimits_{i = 1}^n {\mathop {\sum}\nolimits_{j = 1}^n {W_{ij}\left( {x_i - \bar{x}} \right)\left( {x_j - \bar{x}} \right)} } }}{{\mathop {\sum}\nolimits_{{{{\mathrm{i}}}} = 1}^n
{\mathop {\sum}\nolimits_{j = 1}^n {W_{ij}} \mathop {\sum}\nolimits_{i = 1}^n {\left( {x_i - \bar{x}} \right)^2} } }}} \end{array}$$ (4) In the formula, _x__i_ is the observed value of
country _i_. _W__ij_ is the spatial weight matrix. GWR is a local form of regression that models the spatial heterogeneity of relations (Brunsdon et al., 1996). With the change in local
geographical position in space, the estimated parameters are also different. The calculation formula is as follows: $$\begin{array}{*{20}{c}} {y_i = \beta _0\left( {u_i,v_i} \right) +
\mathop {\sum }\limits_{k = 1}^p \beta _k\left( {u_i,v_i} \right)x_{ik} + \varepsilon _i} \end{array}$$ (5) In the formula, _y__i_ is the dependent variable of sample _i_. (_u__i_, _v__i_)
are the latitude and longitude coordinates of sample _i_. β0(_u__i_, _v__i_) is the regression constant of sample _i_. βk(_u__i_, _v__i_) is the coefficient of the _k_th independent variable
of sample _i_. _p_ is the number of independent variables. _x__ik_ is the _k_th independent variable of sample _i_. ε_i_ is the random error of the model. RESULTS TEMPORAL EVOLUTION OF
GLOBAL ONLINE SOCIAL RESPONSES Figure 4 shows the temporal evolution of the total number of global daily tweets related to Typhoon Haiyan from November 4 to 20. The number of tweets
increased significantly from November 4 to 8 and decreased from November 9 to 20, with a slight increase from November 10 to 11. The trend of global online social response followed the
development of Typhoon Haiyan. Typhoon Haiyan generated and developed rapidly in the South Pacific Ocean on November 4, 2013, and was soon upgraded to a tropical storm and quickly attracted
widespread interest from social media users around the world. On November 8, Typhoon Haiyan landed along the coast of Guiuan, the Philippines, with the highest wind speed, caused thousands
of casualties and heavy economic losses, and attracted the highest global interest. From November 9 to 20, the intensity of Typhoon Haiyan gradually weakened, it moved throughout the
Philippines, and global attention to it gradually decreased. There are two reasons for the increase in global online social responses from November 10 to 11. First, the weakening Typhoon
Haiyan attacked the Hainan Province of China during this period and caused minor casualties, which again attracted global attention. Second, as disaster relief work was in full swing after
the disaster, global social media users increased their attention and actively provided humanitarian relief (Zhang and Cheng, 2021). In short, the response of global social media users to
extreme disaster events will change with the intensity of disasters and the severity of damage caused in the process. Moreover, we carried out a clustering analysis using the Euclidean
distance and the connection between groups to obtain the time clustering tree diagram (Supplementary Fig. S1). Based on Supplementary Fig. S1, online social responses were divided into four
categories: November 4–7, November 8, November 9–13, and November 14–20. These four types are closely related to the evolutionary process of Typhoon Haiyan. November 4–7 is the development
stage, November 8 is the peak stage, November 9–13 is the extinction stage, and November 14–20 is the complete dissipation stage. Therefore, in the following analysis, the response of social
media users to disasters around the world was divided into two stages: before (November 4–8) and after (November 9–20) Typhoon Haiyan’s landing. SPATIAL PATTERN CHANGES IN GLOBAL ONLINE
SOCIAL RESPONSES The online social responses around the world to Typhoon Haiyan are roughly the same in the spatial distribution before and after the typhoon’s landing (Fig. 5). Users in the
Philippines, the main affected country, had the strongest responses to Typhoon Haiyan. Additionally, users in developed countries in Europe and North America paid more attention to Typhoon
Haiyan, mainly because citizens in developed countries had greater capabilities, resources, and capital for disaster relief than those in developing countries. After the Philippines, users
in the U.S. had the greatest interest in Typhoon Haiyan. The reason may be that the Philippines was once a colony of the U.S., and there were more common political and economic values, as
well as stronger social and cultural connections, between these two countries and their citizens. Due to geographical proximity, neighboring countries (e.g., Australia, Vietnam, and
Indonesia) paid relatively strong attention to Typhoon Haiyan. Africa and West Asia had the fewest responses to Typhoon Haiyan. By calculating the relative and absolute differences in tweets
before and after Typhoon Haiyan’s landing, we analyzed the spatial distribution of online social response differences around the world. As shown in Fig. 6, most countries had more responses
to disaster events after the typhoon made landfall. Among them, Bhutan, Botswana, Luxembourg, Mongolia, Uruguay, and Nigeria saw increases of 39 times, 15 times, 12.5 times, 12 times, 11.6
times, and 11.4 times, respectively, compared to the countries before Typhoon Haiyan’s landing. However, some small countries saw decreases in responses. For instance, in Andorra, Guyana,
Seychelles, North Korea, and Papua New Guinea, responses decreased by 50%, 50%, 50%, 43% and 10%, respectively, compared with those before the typhoon’s landing. The online social responses
in Liechtenstein, Chad, Antigua and Barbuda even dropped to zero. This may be because these countries have weak national strength and are unable to provide more attention and assistance to
the outside world. In addition, some countries restrict the use of Twitter, making it impossible to truly reflect the attention of domestic social media users to Typhoon Haiyan. FACTOR
DETECTION OF ONLINE SOCIAL RESPONSES TO THE DISASTER The results of single factors affecting online social responses before Typhoon Haiyan’s landing are listed in Table 2. Overall, economic
factors have the greatest influence on the response, while natural, demographic and cultural factors have a relatively weak influence. The social factors are the weakest, while the political
factors are not significant. The impact of economic factors may be due to the social and geographical disparities in the use of Twitter, and areas with higher disaster-related Twitter usage
are generally communities with better socioeconomic conditions (Zou et al., 2018). Specifically, six factors have significant impacts on online social responses. According to the _q_
values, their explanatory power is, in descending order, export value, the GDP loss rate, total population, per capita GDP, the proportion of nonreligious beliefs, and the CPI. Among them,
export value, the CPI, the proportion of nonreligious beliefs, the GDP loss rate, and population are higher than other factors and are all significant at the 0.05 level, indicating that
these influencing factors have major explanatory power in regard to the dependent variable. Table 2 shows that the major factors do not change much after landing. Economic factors still have
the greatest influence on the response in various countries, while natural, demographic, cultural, and social factors have a weak influence. All six factors are significant at the 0.01
level. In addition, political factors have the weakest but most significant influence. Based on the _q_ value, the explanatory power of these factors is ranked as follows: export value, per
capita GDP, the GDP loss rate, population, the proportion of nonreligious beliefs, the CPI, and the DI. Comparing the dominant factors before and after the typhoon’s landing, we find that
the difference lies in whether political factors are included. Before and during the disaster, social media users focused more on reporting the progress of the disaster, the extent of
damage, property losses and other disaster situation facts. Tweets mainly reflected users’ views, attitudes, and thoughts on reports of disaster events and the official emergency response.
Therefore, the political effect is relatively weak in the five target layers. In contrast, during the post-disaster period, users focused more on disaster recovery and international
humanitarian assistance. Governments in more democratic countries tended to be more inclined to help disaster-hit countries. Moreover, the actions taken by the national government attract
the attention and assistance of the local people. Therefore, compared with the stage before and during the disaster, the dominant factor in the post-disaster stage involved political
factors. ATTRIBUTING MULTIPLE FACTORS AFFECTING ONLINE SOCIAL RESPONSES BEFORE LANDFALL After the normalization of the dominant factor and the dependent variable, the GWR model was
regressed, and the results are summarized in Table 3. Only one factor was selected as the dominant factor of each target layer to achieve dimensionality reduction of the influencing factor
to obtain more accurate research conclusions and avoid the repeatability and inefficiency of the research (Garske et al., 2021). Nevertheless, both per capita GDP and export value could
represent the economic target layer. The export value was selected since it can also reflect a country’s connection to others. The _R_2 values of the two research stages (before and after
landing) are 0.94 and 0.90, respectively, indicating that the model fitting effect is good. As shown in Table 3, the coefficients of the factors are both positive and negative, indicating
that these five influencing factors fluctuate greatly in space and have an unstable influence on the interest of social media users. Overall, from Fig. 7, export values and population have a
more positive influence on online social responses around the world. CPI and the proportion of nonreligious beliefs generally have a negative influence on the online social response in many
countries. The GDP loss rate has a complicated influence on the online social response which has a positive influence in North America, North Africa, and Russia but a negative impact in
other regions. Regarding spatial distributions, the coefficients of export value are overwhelmingly positive around the world (Fig. 7a). This pattern indicates that the economic and trade
links between countries have positive impacts on the online social responses to natural disasters. In detail, the coefficients are relatively high in North and South American countries. The
coefficients of Western Europe, West Africa, East Africa, Oceania, and Southeast Asia follow. Countries in Eastern Europe and Southern Africa have lower coefficients. In addition, exports of
goods and services have only a significant negative effect in Iceland. This exception may be due to its few economic connections to the Philippines. Figure 7b indicates that the CPI has
both positive and negative effects on online social responses in different countries. The countries with higher influencing factor coefficients are mainly distributed in Western Europe,
among which Iceland, the U.K., France, and Switzerland have the highest influencing factor coefficients, i.e., 0.13, 0.06, 0.06, and 0.05, respectively. Countries with lower coefficients of
the CPI are mainly distributed in North America and northern South America. In addition, the CPI has positive effects in 82.3% of countries, which are mainly distributed in North Africa,
Oceania and Europe. The coefficients of the proportion of nonreligious beliefs have both positive and negative effects on the social response to disasters in different countries (Fig. 7c).
From the perspective of the spatial distribution, the countries with higher coefficients of the proportion of nonreligious beliefs are mainly distributed in southern South America and
Central Africa, among which Madagascar, Lesotho, Argentina, Malawi, and Costa Rica have the highest influencing factor coefficients, i.e., 0.07 for all these countries. Countries with lower
coefficients of the proportion of nonreligious beliefs are mainly distributed in northern North America and West Africa. In addition, the proportion of nonreligious beliefs showed a negative
influence in 34.5% of countries, mainly distributed in North America, western South America, Western Europe, and West Africa. Although the proportion of nonreligious beliefs in these
countries is not low, the religious belief in these regions is mainly Christianity. This may be due to the characteristics of Christianity’s religious belief, leading to the positive effect
of the proportion of unbelief in these regions. The GDP loss rate has a positive effect on the responses in most countries (Fig. 7d), indicating that countries prone to natural disasters and
vulnerable carriers are more sensitive to extreme disaster events, and social media users will have more interest in disasters. The countries with higher coefficients of the GDP loss rate
are mainly distributed in Eastern Europe, among which Ukraine, Russia, and Lithuania have the highest influencing factor coefficients, i.e., 0.33, 0.32, and 0.31, respectively. Countries
with lower coefficients of the GDP loss rate are mainly distributed in Western Europe, among which Switzerland, the Netherlands, France and the United Kingdom have the lowest influencing
factor coefficients, i.e., −0.17, −0.15, −0.15, and −0.12, respectively. In addition, the GDP loss rate of 11.5% of countries has negative effects; the countries are mainly distributed in
Western Europe, Oceania, and Southeast Asia. It may be that these countries are close to the disaster area and have a relatively high level of natural risk; thus, users in these countries
pay more attention to calming people’s emotions rather than the disaster itself. The population has a generally positive effect on online social responses to disasters in various countries
(Fig. 7e), indicating that countries with a large population base will pay more active responses to extreme disaster events. The countries with higher coefficients of population are mainly
distributed in Western Europe, among which Iceland, the U.K., France and Switzerland have the highest influencing factor coefficients, i.e., 3.27, 1.47, 1.47, and 1.23, respectively.
Countries with lower influencing factor coefficients are mainly distributed in North and South America, among which Chile, Peru, and Brazil have the lowest influencing factor coefficients,
i.e., −0.91, −0.86, and −0.84, respectively. ATTRIBUTING MULTIPLE FACTORS AFFECTING ONLINE SOCIAL RESPONSES AFTER LANDFALL The GWR coefficients of each influencing factor after landing are
statistically summarized in Table 4 and shown in Fig. 8. The coefficient statistics of export value, the CPI, the proportion of nonreligious beliefs, the GDP loss rate, and population are
similar to the situation before landing. The coefficient value of the GE of the increased influencing factor is positive and negative, indicating that the influencing factor also fluctuates
in space and its effect is changeable. Figure 8a shows that the influencing factor coefficient of the GE has significant spatial heterogeneity, with values ranging from approximately −0.16
to 0.10. These results indicate that most of GE has positive and negative effects on the attention of social media users to disasters. From the perspective of spatial distribution, the
countries with high influencing factor coefficients are Australia (0.10) and European countries, such as Norway (0.98), Denmark (0.96), Sweden (0.94), and Germany (0.92). Countries with
lower influencing factor coefficients are mainly distributed in American countries, among which Mexico, Ecuador, Guatemala, El Salvador and Costa Rica have the lowest five influencing factor
coefficients, i.e., −0.16, −0.15, −0.14, −0.14, and −0.14, respectively. In addition, the negative effects of GE are mainly distributed in the Western Hemisphere and Western Africa. The
export value is positively correlated with the attention of social media users to the disaster and is generally consistent with the distribution pattern of the influencing factor coefficient
of export value before the typhoon made landfall (Fig. 8b). However, the influencing factor coefficient changed. Chile, Peru, Argentina, Uruguay, and Brazil had the five highest influencing
factor coefficients, i.e., 1.24, 1.23, 1.22, 1.21 and 1.19, respectively. Iceland, Indonesia, Malaysia, Ireland, and Cambodia had the lowest five coefficients, i.e., −0.15, 0.02, 0.04, 0.05
and 0.06, respectively. The CPI is positively and negatively correlated with the attention of social media users to the disaster (Fig. 8c) and changes with the distribution pattern of the
influencing factor coefficient of the CPI before the typhoon’s landing. Canada, U.S., Mexico, Guatemala, and El Salvador had the highest influencing factor coefficients, i.e., 0.19, 0.16,
0.14, 0.13, and 0.13, respectively. Sweden, Finland, Estonia, Latvia and Norway had the lowest influencing factor coefficients, i.e., −0.07, −0.06, −0.06,−0.06, and −0.06, respectively. The
proportion of nonreligious beliefs has both positive and negative correlations to the attention of social media users to the disaster (Fig. 8d) and is basically consistent with the pattern
of the influencing factor coefficient of the proportion of nonreligious beliefs before the typhoon’s landing. However, the influencing factor coefficient changed. Iceland, Brazil, Uruguay,
Kenya, and Tanzania had the highest influencing factor coefficients, i.e., 0.025, 0.010, 0.008, 0.008, and 0.008, respectively. Cuba, Jamaica, Mexico, Guatemala, and Honduras had the lowest
influencing factor coefficients, i.e., −0.15, −0.14, −0.14, −0.13 and −0.13, respectively. The GDP loss rate is positively correlated with the attention of social media users to the disaster
(Fig. 8e) and is different from the distribution pattern of the influencing factor coefficient of the GDP loss rate before the typhoon’s landing. The influencing factor coefficient changed.
Iceland, Ireland, Canada, the U.S., and Cuba had the highest influencing factor coefficients, i.e., 1.53, 0.47, 0.35, 0.29, and 0.15, respectively. Poland, Denmark, Germany, Moldova, and
Sweden had the lowest influencing factor coefficients, i.e., −0.12, −0.10, −0.09, −0.08, and −0.07, respectively. Population is positively correlated with the attention of social media users
to the disaster (Fig. 8f) and is basically consistent with the distribution pattern of the influencing factor coefficient of population before the typhoon’s landing. However, the
influencing factor coefficient changed. Iceland, Canada, Ireland, Portugal, and the U.S. had the highest impact factor coefficients, i.e., 2.35, 1.95, 1.52, 1.11, and 1.09, respectively.
Chile, Peru, Argentina, Uruguay, and Brazil had the lowest impact factor coefficients, i.e., −0.99, −0.94, −0.94, −0.93, and −0.84, respectively. CHANGES IN INFLUENCING FACTORS BEFORE AND
AFTER THE TYPHOON’S LANDING We further compared and analyzed the changes in the five influencing factors before and after the typhoon made landfall. Figure 9 shows the influencing factor
coefficient differences (left panel) and their change directions (right panel) before and after the typhoon’s landing in corresponding countries or regions. The letters P and N indicate
positive or negative coefficients, respectively. It is found that the influencing factor coefficients of the export value, the CPI, the proportion of nonreligious beliefs, the GDP loss rate
and population increased and decreased significantly. By comparing the changes in the effect direction of the influencing factors before and after the typhoon, this study finds that the
effect direction of export value, the GDP loss rate and population basically did not change before and after the typhoon landing, and the effect direction of the CPI and proportion of
nonreligious beliefs changed in some countries. The countries with enhanced effects of export value before and after the typhoon’s landing are mainly distributed in Europe, South America,
and East and Southern Africa (Fig. 9a, b). Among these countries, Argentina, Uruguay, Panama, and Costa Rica have significantly enhanced effects, with difference values of export value being
1.14, 1.14, 1.03, and 1.02, respectively. Countries with a weakened effect of export value were mainly distributed in northern South Asia, North America, Central America, Southeast Asia,
and Oceania, among which the United States, Cuba, Guatemala, and El Salvador had significantly weakened effects, and the differences in the change in export value were −0.47, −0.16, −0.11,
and −0.11, respectively. Figure 9b shows that the effect directions of export value before and after the typhoon’s landing both have a negative effect on social media users’ attention to the
disaster in Iceland, and both have positive effects on social media users in other countries. The countries with enhanced effects of the CPI before and after the typhoon’s landing are
mainly distributed in North America and South America (Fig. 9c, d). The United States, Guatemala, El Salvador, and Cuba have significantly enhanced effects, with difference values of the CPI
being 0.21, 0.19, 0.19, and 0.18, respectively. Countries with weakened effects of the CPI are mainly distributed in the Eastern Hemisphere, among which Norway, Sweden, the Netherlands, and
Denmark have significantly weakened effects, and the differences in the change in the CPI are −0.10, −0.10, −0.09, and −0.09, respectively. The countries where the effect direction of the
CPI changed from positive to negative are mainly distributed in Southern Africa before and after the typhoon’s landing (Fig. 9d). The countries where the effect direction of the CPI changed
from negative to positive were mainly distributed in southern North America and northern South America. The countries for which the CPI maintained the same direction are distributed in
Europe, Southeast Asia, Oceania, and Africa. Figure 9e, f shows that the countries with enhanced effects of the proportion of nonreligious beliefs before and after the typhoon’s landing are
mainly distributed in North America, South America, and Africa. The U.S., Iceland, Senegal and Omen have significantly enhanced effects, and the difference values of the proportion of
nonreligious beliefs are 0.02, 0.01, 0.01, and 0.003, respectively. Countries with a weakened effect of the proportion of nonreligious beliefs are mainly distributed around the world, among
which Jamaica, Mexico, Costa Rica, and Panama have a significantly weakened effect, and the difference in the change in the proportion of nonreligious beliefs are −0.20, −0.20, −0.19, and
−0.18, respectively. Figure 9f shows that the countries where the effect direction of the proportion of nonreligious beliefs changed from positive to negative are mainly distributed in
Oceania and Southeast Asia before and after the typhoon’s landing. The countries in which the proportion of nonreligious beliefs maintained the same direction are distributed in North and
South America, Europe, South Asia and Africa. Figure 9g, h shows that the countries with enhanced effects of the GDP loss rate before and after the typhoon’s landing are mainly distributed
in North and Central America, West Europe, and Northern and Southern Africa. Iceland, Ireland, Canada, and Switzerland have significantly enhanced effects, with difference values of the GDP
loss rate being 1.32, 0.31, 0.26, and 0.19, respectively. The GDP loss rate has a weak influence on the countries distributed in Southeast Asia, Europe, Northwestern Africa, and Oceania,
such as Lithuania, Ukraine, Austria and Slovenia, with changes of −0.37, −0.37, −0.34, and −0.32, respectively. Meanwhile, the effect direction of the GDP loss rate does not change in most
countries before and after the typhoon’s landing (Fig. 9h), whereas countries in Northern Europe and Eastern Europe changed from positive to negative. Figure 9i, j shows that the countries
with enhanced effects of population before and after the typhoons’ landing are mainly distributed in North and South America, South Asia, and Central Africa. Canada, the United States,
Ireland, and Cuba have significantly enhanced effects, with change values of 1.72, 1.54, 1.05, and 0.50, respectively. Countries with weakened effects of population are mainly distributed in
Southeast Asia, Oceania, Europe, and Southern and East Africa. Argentina, Uruguay, Iceland, and France have significantly weakened effects with changes of −1.18, −1.17, −0.91, and −0.83,
respectively. The effect direction of population remains consistent in most countries before and after the typhoon’s landing (Fig. 9j). However, several countries in Central America,
Argentina, and New Zealand changed from positive to negative. DISCUSSION WESTERN COUNTRIES ARE THE MAIN FOREIGN GROUP OF ONLINE SOCIAL RESPONSES TO THE NATURAL DISASTER Western countries are
the major foreign group with active online social responses to natural disasters. Similar to recent research on the global public interest in earthquakes, which found that Western countries
are dominant (Kam et al., 2021), we found that Western countries have stronger online social responses to natural disasters. This result is explained by the strong economic conditions and
high trade connections between Western countries and the Philippines. Moreover, our research reveals that countries neighboring the Philippines are a major group. This difference is rooted
in the geophysical divergence of typhoons and earthquakes since neighboring countries are more likely to be impacted by typhoons than earthquakes. DISTANCE HAS LITTLE INFLUENCE ON THE ONLINE
SOCIAL RESPONSES Geographical distance has a limited influence on online social responses. Previous research found that the distance between the country where news media are located and the
country where the disasters occur impacts the likelihood that a disaster will be covered by the media (Berlemann and Thomas, 2019). Whereas we found no global significant impact of
geographical distance between countries and the country where the disaster occurred. On one hand, the neighboring countries have more responses than African countries, but they are
comparable to Western countries. On the other hand, the timing of online social response is consistent with the evolution of Typhoon Haiyan. This nonsignificant spatial disparity and
temporal consistency reflect that online social networks have almost eliminated the spatiotemporal barriers of social responses to a disaster. ECONOMY IS THE MAIN DRIVER OF ONLINE SOCIAL
RESPONSES Overall, economic factors have more significant influence on the drivers of online social responses than other factors except the population. As shown by the Geodetector results,
economic factors have the strongest explanatory power in regard to the number of tweets posted before the typhoon’s landing, while natural, demographic and cultural factors were weaker, and
social factors were the weakest. Political factors were not significant. Economic factors had the strongest explanatory power in regard to the number of tweets posted after the typhoon’s
landing, while natural, demographic, cultural and social factors were weaker, and political factors were the weakest. Based on the GWR model before landing, export value is basically
positively correlated with the intensity of online social responses, and the factor coefficients are generally high in the west and low in the east. The coefficient of the CPI has
significant spatial heterogeneity, with positive effects in North Africa, Oceania and Europe and negative effects in North and South America, Southern Africa and Southeast Asia. The
proportion of nonreligious beliefs has a negative effect in North America, western South America, Western Europe, West Africa and Oceania and has a positive effect in eastern South America,
Eastern Europe, Asia and Southern Africa before landing. The GDP loss rate has a positive effect on social media users’ attention to disasters, and 18.58% of countries show a negative effect
before landing but 31.86% after landing, Population has a generally positive effect on disaster attention among social media users in countries, with only 18.58% (before landing) and 17.70%
(after landing) of countries having a negative effect, mainly in North and South America. Comparing the coefficient changes in influencing factors, it is found that the influencing factor
coefficients of export value, the CPI, the proportion of nonreligious beliefs and the GDP loss rate before and after Typhoon Haiyan’s landing have spatial heterogeneity. By comparing the
direction of the influencing factors, we find that the direction of the influencing factor of export value did not change before and after the typhoon’s landing. There are four types of
changes in the effect direction of the CPI: from positive to negative, from negative to positive, and no change. There are three types of change in the effect direction of the proportion of
nonreligious beliefs, that is, from positive to negative, from negative to positive, and no change. The effect direction of the GDP loss rate and population remains unchanged in most
countries. IMPLICATIONS AND LIMITATION Based on the above results and analysis, this paper reveals that the online social response to a natural disaster is beyond geographical limitation and
has a global impact. This online social response will be mainly influenced by economic factors and active in Western countries. It indicates that western active online social media users
have the most willingness and economic capacity for foreign aid. Hence, this information is of great potential for governments and humanitarian agencies to expand their pool of potential
volunteers and donors. There are limitations to this study. Due to the lack of relevant data from sources, not all the countries are obtained in our analysis. Hence it will lead to the
uncertainty of GWR’s results, whereas due to our limited knowledge, the selection of influencing factors may still involve omitted variables, and only the influence of the target layer and
the first-level factors are discussed. Besides, the religious rate data are collected from Wikipedia, which may lead to the uncertainty of our analysis. Whereas the GE is controversial
regarding its definition and algorithm, which will also introduce the analysis’ uncertainty. In addition, we noticed that Hainan Province in China, also severely affected by the typhoon, has
caused a much weaker global online social response compared to the Philippines. This is also a question worth further exploration in the future. CONCLUSION This study takes Typhoon Haiyan
in 2013 as a case study to explore the global online social responses to a natural disaster and to investigate their influencing factors. In conclusion, the global online social responses to
Typhoon Haiyan are beyond the geographical limit and consistent with the development of disaster. Except for the Philippines, Western countries and surrounding countries had higher
responses than others. Economic factors dominated the online social response. The influences of social, cultural, and demographic factors were relatively weak. Political factors had only a
weak impact during the post-disaster stage. Our findings demonstrate active online social groups in Western countries are of great potential for governments and humanitarian agencies to call
for foreign volunteers and donors. This information will deepen our understanding of online social behavior and help coordinate the humanitarian assistance of various countries and provide
a reference for the efficient and orderly implementation of international rescue work after disasters. DATA AVAILABILITY The global dataset tweets on Typhoon Haiyan and other dataset used in
this study is available at: https://doi.org/10.6084/m9.figshare.23617725. This dataset was proposed in xlsx and csv format and can be processed using Microsoft Excel software and GIS
software. REFERENCES * Aitsi-Selmi A, Blanchard K, Murray V (2016) Ensuring science is useful, usable and used in global disaster risk reduction and sustainable development: a view through
the Sendai framework lens. Palgrave Commun 2(1):1–9 Article Google Scholar * Berlemann M, Thomas T (2019) The distance bias in natural disaster reporting—empirical evidence for the United
States. Appl Econ Lett 26(12):1026–1032 Article Google Scholar * Brandt HM, Turner-McGrievy G, Friedman DB, Gentile D, Schrock C, Thomas T, West D (2019) Examining the role of Twitter in
response and recovery during and after historic flooding in South Carolina. J Public Health Manag Pract 25(5):E6 Article PubMed Google Scholar * Brunsdon C, Fotheringham AS, Charlton ME
(1996) Geographically weighted regression: a method for exploring spatial nonstationarity. Geogr Anal 28(4):281–298 Article Google Scholar * Chen S, Mao J, Li G, Ma C, Cao Y (2020)
Uncovering sentiment and retweet patterns of disaster-related tweets from a spatiotemporal perspective: a case study of Hurricane Harvey. Telemat Inform 47:101326 Article Google Scholar *
Contreras D, Wilkinson S, Balan N, James P (2022) Assessing post-disaster recovery using sentiment analysis: the case of L’Aquila, Italy. Earthq Spectra 38(1):81–108 Article Google Scholar
* Cook ADB, Shrestha M, Zin Bo Htet (2018) An assessment of international emergency disaster response to the 2015 Nepal earthquakes. Int J Disaster Risk Reduct 31:535–547 Article Google
Scholar * Coppola DP (2020) Introduction to international disaster management, 4th edn. Butterworth-Heinemann. Oxford, England. https://doi.org/10.1016/B978-0-12-817368-8.00008-7 * David
CC, Ong JC, Legara EFT (2016) Tweeting supertyphoon Haiyan: evolving functions of Twitter during and after a disaster event. PLoS ONE 11(3):e0150190 Article PubMed PubMed Central Google
Scholar * García-Ramírez GM, Bogen KW, Rodríguez-Guzmán VM, Nugent N, Orchowski LM (2021) #4645Boricuas: Twitter reactions to the estimates of deaths by Hurricane María in Puerto Rico. J
Community Psychol 49(3):768–790 Article PubMed Google Scholar * Garske SI, Elayan S, Sykora M, Edry T, Grabenhenrich LB, Galea S, Lowe SR, Gruebner O (2021) Space-time dependence of
emotions on Twitter after a natural disaster. Int J Environ Res Public Health 18(10):5292 Article PubMed PubMed Central Google Scholar * Gruebner O, Lowe SR, Sykora M, Shankardass K,
Subramanian SV, Galea S (2018) Spatio-temporal distribution of negative emotions in New York City after a natural disaster as seen in social media. Int J Environ Res Public Health
15(10):2275 Article PubMed PubMed Central Google Scholar * Hoffman S, Oliver-Smith A (eds) (2002) Catastrophe & culture: the anthropology of disaster. School of American Research
Press, Santa Fe * Kam J, Park J, Shao W, Song J, Kim J, Gizzi FT, Porrini D, Suh Y-J (2021) Data-driven modeling reveals the Western dominance of global public interest in earthquakes.
Humanit Soc Sci Commun 8(1):1–9 Article Google Scholar * Kumar P (2020) Twitter, disasters and cultural heritage: a case study of the 2015 Nepal earthquake. J Contingencies Crisis Manag
28(4):453–465 Article Google Scholar * Lefever DW (1926) Measuring geographic concentration by means of the standard deviational ellipse. Am J Soc 32(1):88–94 Article Google Scholar *
Moran PAP (1950) Notes on continuous stochastic phenomena. Biometrika 37(1–2):17–23 Article MathSciNet CAS PubMed MATH Google Scholar * Murzintcev N, Cheng C (2017) Disaster hashtags
in social media. ISPRS Int J Geo-Inf 6(7):204 * NDRRMC Philippines (2013) Final report re: effects of Typhoon Yolanda (Haiyan), p 65.
http://ndrrmc.gov.ph/attachments/article/1329/FINAL_REPORT_re_Effects_of_Typhoon_YOLANDA_ (HAIYAN)_06-09NOV2013.pdf * Raschky PA, Schwindt M (2012) On the channel and type of aid: the case
of international disaster assistance. Eur J Polit Econ 28(1):119–131 Article Google Scholar * Ruan T, Kong Q, McBride SK, Sethjiwala A, Lv Q (2022) Cross-platform analysis of public
responses to the 2019 Ridgecrest earthquake sequence on Twitter and Reddit. Sci Rep 12(1):1634 Article ADS CAS PubMed PubMed Central Google Scholar * Shen S, Cheng C, Song C, Yang J,
Yang S, Su K, Yuan L, Chen X (2018) Spatial distribution patterns of global natural disasters based on biclustering. Nat Hazards 92(3):1809–1820 Article Google Scholar * Shen S, Huang J,
Cheng C, Zhang T, Murzintcev N, Gao P (2021) Spatiotemporal evolution of the online social network after a natural disaster. ISPRS Int J Geo-Inf 10(11):744 Article Google Scholar * Sadaf
R, Oláh J, Popp J, Máté D (2018) An investigation of the influence of the worldwide governance and competitiveness on accounting fraud cases: a cross-country perspective. Sustainability
10(3):588 * Takahashi B, Tandoc EC, Carmichael C (2015) Communicating on Twitter during a disaster: an analysis of tweets during Typhoon Haiyan in the Philippines. Comput Hum Behav
50:392–398 Article Google Scholar * Tan YJ, Maharjan R (2018) What googling trends tell us about public interest in earthquakes. Seismol Res Lett 89(2A):653–657 Article Google Scholar *
Tang J, Yang S, Wang W (2021) Social media-based disaster research: development, trends, and obstacles. Int J Disaster Risk Reduct 55:102095 Article Google Scholar * United Nations Office
For Disaster Risk Reduction (2020) Human cost of disasters: an overview of the last 20 years 2000–2019, UNDRR, pp 1–17 * Wang J, Li X, Christakos G, Liao Y, Zhang T, Gu X, Zheng X (2010)
Geographical detectors‐based health risk assessment and its application in the neural tube defects study of the Heshun Region, China. Int J Geogr Inf Sci 24(1):107–127 Article CAS Google
Scholar * Yan Y, Chen J, Wang Z (2020) Mining public sentiments and perspectives from geotagged social media data for appraising the post-earthquake recovery of tourism destinations. Appl
Geogr 123:102306 Article Google Scholar * Yuan F, Li M, Zhai W, Qi B, Liu R (2020) Social media based demographics analysis for understanding disaster response disparity. In: Proceedings
of Construction Research Congress 2020: Computer Applications, pp 1020–1028. https://doi.org/10.1061/9780784482865.108 * Zhang T, Cheng C (2021) Temporal and spatial evolution and
influencing factors of public sentiment in natural disasters—a case study of Typhoon Haiyan. ISPRS Int J Geo-Inf 10(5):299 Article Google Scholar * Zhang T, Shen S, Cheng C, Su K, Zhang X
(2021) A topic model based framework for identifying the distribution of demand for relief supplies using social media data. Int J Geogr Inf Sci 35:2216–2237 * Zhu H, Liu K (2021) Temporal,
spatial, and socioeconomic dynamics in social media thematic emphases during Typhoon Mangkhut. Sustainability 13(13):7435 Article Google Scholar * Zou L, Lam NSN, Cai H, Qiang Y (2018)
Mining Twitter data for improved understanding of disaster resilience. Ann Am Assoc Geogr 108(5):1422–1441 Google Scholar Download references ACKNOWLEDGEMENTS This work is supported by the
National Key Research and Development Plan of China (grant numbers 2019YFA0606901) and the National Natural Science Foundation of China (No. 42201498). AUTHOR INFORMATION AUTHORS AND
AFFILIATIONS * Key Laboratory of Environmental Change and Natural Disaster, Beijing Normal University, 100875, Beijing, China Shi Shen, Junwang Huang & Changxiu Cheng * Faculty of
Geographical Science, Beijing Normal University, 100875, Beijing, China Shi Shen, Ke Shi, Junwang Huang, Changxiu Cheng & Min Zhao * Institute of Geographic Sciences and Natural
Resources Research, Chinese Academy of Sciences, 100101, Beijing, China Ke Shi Authors * Shi Shen View author publications You can also search for this author inPubMed Google Scholar * Ke
Shi View author publications You can also search for this author inPubMed Google Scholar * Junwang Huang View author publications You can also search for this author inPubMed Google Scholar
* Changxiu Cheng View author publications You can also search for this author inPubMed Google Scholar * Min Zhao View author publications You can also search for this author inPubMed Google
Scholar CONTRIBUTIONS SS designed the study; SS and CC collected the data; SS, KS, JH, and MZ discussed the method and analysis sections; SS and KS implemented the study and drafted the
manuscript; SS, KS, CC, and MZ reviewed and revised the manuscript. CORRESPONDING AUTHORS Correspondence to Shi Shen or Ke Shi. ETHICS DECLARATIONS COMPETING INTERESTS The authors declare no
competing interests. ETHICAL APPROVAL All the data used in this article are public data collected from the Twitter platform. There are no human participants in this study. INFORMED CONSENT
Only tweet numbers and users’ public registering location information are used and analyzed, and no private information or data will be published or can be seen in this article. ADDITIONAL
INFORMATION PUBLISHER’S NOTE Springer Nature remains neutral with regard to jurisdictional claims in published maps and institutional affiliations. SUPPLEMENTARY INFORMATION FIGURE S1 RIGHTS
AND PERMISSIONS OPEN ACCESS This article is licensed under a Creative Commons Attribution 4.0 International License, which permits use, sharing, adaptation, distribution and reproduction in
any medium or format, as long as you give appropriate credit to the original author(s) and the source, provide a link to the Creative Commons license, and indicate if changes were made. The
images or other third party material in this article are included in the article’s Creative Commons license, unless indicated otherwise in a credit line to the material. If material is not
included in the article’s Creative Commons license and your intended use is not permitted by statutory regulation or exceeds the permitted use, you will need to obtain permission directly
from the copyright holder. To view a copy of this license, visit http://creativecommons.org/licenses/by/4.0/. Reprints and permissions ABOUT THIS ARTICLE CITE THIS ARTICLE Shen, S., Shi, K.,
Huang, J. _et al._ Global online social response to a natural disaster and its influencing factors: a case study of Typhoon Haiyan. _Humanit Soc Sci Commun_ 10, 426 (2023).
https://doi.org/10.1057/s41599-023-01922-5 Download citation * Received: 01 September 2022 * Accepted: 06 July 2023 * Published: 20 July 2023 * DOI:
https://doi.org/10.1057/s41599-023-01922-5 SHARE THIS ARTICLE Anyone you share the following link with will be able to read this content: Get shareable link Sorry, a shareable link is not
currently available for this article. Copy to clipboard Provided by the Springer Nature SharedIt content-sharing initiative