Unraveling the complexities of rain-on-snow events in high mountain asia
- Select a language for the TTS:
- UK English Female
- UK English Male
- US English Female
- US English Male
- Australian Female
- Australian Male
- Language selected: (auto detect) - EN
Play all audios:

ABSTRACT Rain-on-snow (ROS) events, defined as rainfall on a snow-covered landscape, pose a significant flood risk. While climate change is altering precipitation patterns and snow cover in
High Mountain Asia (HMA), our understanding of ROS patterns and their underlying mechanisms remains limited. This study comprehensively analyzed the spatiotemporal distribution, trends, and
potential flood risks associated with ROS (snow water equivalent (SWE) ≥ 1 mm and rainfall ≥ 1 mm) and ROS flood (SWE ≥ 10 mm and rainfall ≥ 10 mm) events in HMA using SWE and ERA5-Land
rainfall data. Approximately 37.1% of HMAs have had at least one ROS event during hydrological years from 1979 to 2018 and their frequency increased with elevation. The dominant seasons for
ROS production were winter at low altitudes, spring at mid-altitudes, and summer at high altitudes. Trend analysis revealed that lower elevations showed a decline in ROS events attributable
to reduced SWE; whereas, higher elevations experienced an increase owing to a shift from snowfall to rainfall. ROSflood events significantly accelerated snowmelt (1.27-times faster than
non-ROS events, respectively). ROSflood events, though low-frequent, accounted for 2.52% and 1.55% of the total regional rainfall and snowmelt, respectively, with the main flood risk
concentrated in mid-altitude regions around 3.0‒4.5 km. This research provides a scientific basis for water resource management, flood prediction, and adaptation in HMA. SIMILAR CONTENT
BEING VIEWED BY OTHERS DIVERGENT RESPONSES OF HISTORIC RAIN-ON-SNOW FLOOD EXTREMES TO A WARMER CLIMATE Article Open access 24 May 2025 WARMING TRIGGERS SNOWFALL FRACTION LOSS THRESHOLDS IN
HIGH-MOUNTAIN ASIA Article Open access 17 February 2025 GLOBAL PATTERNS OF RAIN-ON-SNOW AND ITS IMPACTS ON RUNOFF FROM PAST TO FUTURE PROJECTIONS Article Open access 21 May 2025 INTRODUCTION
Rain-on-snow (ROS) events, defined as rainfall occurring on a snow surface, represent complex hydrometeorological phenomena involving intricate heat and energy exchanges within the
snowpack, and are characterized by the concurrent presence of rain and snow1. Prevalent in high-altitude and high-latitude regions, the changing frequency and intensity of ROS events under
climate change conditions have far-reaching consequences, including triggering floods, avalanches, and debris flows2,3,4,5. The rapid rise in global temperatures has profoundly impacted
mountain crospheres and hydrological systems, leading to evolution of mountain hazards6,7,8. Research suggests that the influence of temperature increase on ROS event frequency is complex
and varies across spatial, altitudinal, and temporal scales9. Rising temperatures can alter precipitation patterns, increase the proportion of rainfall, enhance winter‒spring rainfall
frequency10, and shorten the snow season11,12, which in turn affects the timing of ROS events. In addition, combined effects of latitude and altitude on persistence of mountain snow cover
shape the magnitude and direction of ROS changes under climate warming2,13,14. Observations, reanalyses, and model data have revealed that the responses of ROS frequency and intensity to
rising temperatures vary across different regions and at different altitudes within the same mountain range. No significant trend in ROS frequency has been detected on the hemispheric
scale14, whereas, regional studies have shown clear spatial patterns. In high-altitude regions, such as the western United States and Swiss Alps, ROS event frequency has significantly
increased; whereas, it has shown a decreasing trend in low-altitude areas13,15,16. ROS events also exhibit seasonal variations. For example, in Central Europe, ROS frequency increases in
January and February and decreases in April and May17. ROS events are among the five primary flood processes in temperate mountain river systems and can trigger significant floods during
winter months18. Although the spatial variability of ROS responses to climate change is substantial and the uncertainty in ROS flood frequency changes remains high, the hydrological effect
of ROS is significant. Historically, 70% of extreme (upper 0.1%) runoff events in the contiguous United States have contribution from ROS19, 20% of flood events in Austria from 1971 to
199718, and 20‒80% of peak flows in Central Europe20. The contribution of ROS to flooding is also substantial in Canada, Europe, and Asia17,21. High Mountain Asia (HMA), often referred to as
the ‘Third Pole,’ is a vital water source for billions of people22. The glaciers and snowpacks in this region serve as natural reservoirs and feed major rivers. However, climate change has
disrupted this balance. Rising temperatures and altered precipitation patterns alter the frequency and intensity of ROS events, posing a significant threat to water resource management and
flood risk. The complex topography of HMA, characterized by towering mountain ranges and steep slopes, exacerbates these challenges. The unique atmospheric circulation system in the region,
influenced by multiple monsoon systems and westerlies, contributes to the variability in ROS events. Combined with weak infrastructure, HMA is highly vulnerable to snowmelt floods triggered
by ROS, posing risks to communities, infrastructure, and transportation networks23. This study will advance our understanding of ROS events in HMA by addressing several key limitations of
previous research24,25,26. First, we employ a substantially improved spatial resolution (5 km) for SWE data, enabling a more detailed characterization of snow distribution. Second, we
utilize two distinct ROS definitions—one capturing all potential events (SWE ≥ 1 mm and rainfall ≥ 1 mm) and another focusing on flood-triggering ROS (ROSflood, SWE ≥ 10 mm and rainfall ≥ 10
mm) based on internationally recognized thresholds—providing a more comprehensive and impactful analysis of ROS characteristics and flood risk. Third, unlike previous qualitative
assessments, we provide a quantitative analysis of ROS impact on snow ablation rates. Finally, and crucially, we address the critical gap in understanding ROS-driven runoff responses by
conducting a correlation analysis between ROS changes and resulting runoff, offering novel insights into the dynamics of these interconnected processes and how different climate variables
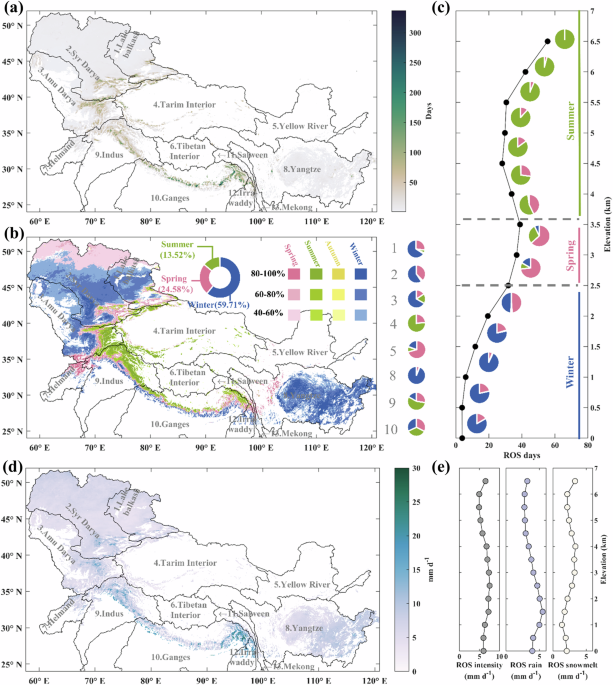
influence them. RESULTS ROS CHARACTERISTICS Figure 1 illustrates the spatial distribution of ROS events across HMA, considering frequency, timing, and intensity. ROS days were more frequent
at higher altitudes, particularly in mountainous regions such as the Tianshan, Kunlun, Pamir, Himalaya, and Hengduan ranges. Across the HMA, the mean ROS frequency was 22.4 days per year.
The Ganges basin experienced the highest ROS frequency (45.8 d), followed by the adjacent Irrawaddy basin (31.4 days). Several other basins, including the Tarim Interior, Salween, Indus, and
Tibetan Interior, also averaged more than 20 ROS days per year. Conversely, the Yellow and Yangtze River basins experienced fewer than 5 d ROS days annually, with these events mainly
occurring in their source regions (Table S1). ROS events in the HMA exhibited distinct seasonal variations (Fig. S1), with summer and spring showing the highest concentrations across the
region. For instance, ROS days surged from June to August in the Tarim Interior and Yangtze River basins, while they were concentrated in winter and spring in the Indus and Ganges basins.
The average duration of ROS events was approximately 1.89 days. Regions with longer ROS durations were primarily concentrated in the Himalayas and Hengduan Mountains, exhibiting a pattern of
increasing duration with elevation (Fig. S2). In light of the seasonal variability of ROS events, a subsequent analysis was performed to determine their dominant season (Fig. 1b). Winter
was the dominant season for nearly two-thirds of the region, primarily in the middle and lower reaches of major rivers such as the Yangtze, Amu Darya, and Syr Darya. Spring was the dominant
in approximately one-quarter of HMA, particularly in the headwater and lower regions of Lake Balkash and Syr Darya. ROS events were less frequent (13.52%) and concentrated in high-altitude
regions. Autumn was the dominant season for less than 1% of the region. Some basins, including Lake Balkash, Syr Darya, Amu Darya, and Yangtze, showed the highest proportion of winter
dominance, followed by spring (Table S2). Conversely, spring was the most dominant season in the Yellow River, Helmand, Salween, and Mekong Basins, followed by winter. The Indus, Tarim
Interior, and Tibet Interior basins were characterized by summer dominance, followed by spring. The Ganges Basin was unique, with a relatively even distribution of ROS events across spring,
summer, and winter, each accounting for approximately one-third of the annual total. The dominant season for ROS events exhibited a predictable altitudinal shift (Fig. 1c). Analysis at 500-m
intervals revealed a transition from winter dominance at altitudes below 2.5 km, to spring dominance between 2.5 and 3.5 km, and finally to summer dominance above 3.5 km. Within each
altitude range, the proportion of the corresponding dominant season increased with increasing altitude. Mean annual ROS intensity across HMA mirrored the spatial distribution of ROS days
(Fig. 1d; Table S2). The mean daily ROS intensity was 5.29 mm, with rainfall and snowmelt contributing 65.9% and 34.1% of the overall intensity, respectively (Table S3). Rainfall was the
dominant driver of ROS intensity in ~83% of HMA (Fig. S3). The Irrawaddy and Ganges basins exhibited the highest ROS intensity, reaching 13.05 mm and 9.23 mm, respectively, with rainfall
contributing 72.3% and 62.8% of this intensity. This rainfall dominance was also observed in basins with lower ROS intensities. Similar to the altitudinal changes in ROS rainfall, ROS
intensity also varied with elevation, generally increasing initially and then decreasing with increasing altitude. ROS intensity also displayed a clear seasonal pattern (Fig. S4), with high
intensities concentrated in April, June, and July, and a relative decrease in winter. Notably, in summer, 7.67% of total precipitation and 48.75% of total snowmelt in the HMA were directly
associated with ROS events. This highlights the substantial contribution of rainfall to ROS intensity throughout the year (Figs. S5 and S6). Except for the Indus and Ganges basins, most HMA
regions followed the overall trend of stronger ROS intensity in summer. The Amu Darya Basin exemplifies this pattern, with summer ROS rainfall and snowmelt accounting for 31.4% and 37.2% of
total precipitation and snowmelt, respectively. ROS CHANGES Contrasting trends in ROS frequency, timing, and intensity across the HMA (Fig. 2). Although an overall significant decrease in
ROS days was observed (−0.031 d/year), substantial spatial heterogeneity was evident (Table S4). Southern basins experienced the largest declines, particularly the Yangtze (−0.044 d/year),
Indus (−0.082 d/year), and Ganges (−0.154 d/year) basins, while slight, non-significant increases occurred in the Lake Balkash (0.029 d/year), Tarim Interior (0.033 d/year), and Tibet
Interior (0.117 d/year) regions. The study by Maina and Kumar26 also highlighted the declining trend of ROS in the Ganges basin. ROS days also exhibited contrasting elevational trends, with
increases at higher elevations and decreases at lower elevations, with a transition around 5.5 km. The 1.5–3.0 km elevation range experienced a substantial and statistically significant
decline. ROS duration exhibited an overall decreasing trend, primarily concentrated in the Amu Darya, Syr Darya, and Indus River basins, while increasing durations were observed in the
Gangdise Mountains and Kunlun Mountains. Altitudinally, duration tended to decrease at lower elevations (especially between 1 and 3 km) and increase at higher elevations (Fig. S7). ROS event
timing exhibited clear spatial variations. A slight delay was observed in the Lake Balkash, Syr Darya, and Tibetan Interior basins, while ROS events shifted earlier in other basins, most
notably the Tarim Interior (−0.246 d/year) and Indus River (−0.315 d/year) basins. Altitudinally, ROS timing tended to be delayed below 1.0 km, whereas above 10.0 km, ROS events occurred
earlier with increasing altitude, particularly between 3.0 and 6.0 km. The overall trend for ROS intensity suggested a slight weakening, primarily concentrated in the Indus (−0.025 mm/year),
Ganges (−0.021 mm/year), and Salween (−0.029 mm/year) basins. In contrast, ROS intensity showed an increasing trend in the lower reaches of Lake Balkash. Altitudinal changes in ROS
intensity generally reflected a weakening trend, with the most notable decrease occurring between 3.5 and 6.0 km. To understand the mechanisms driving the changing trends in ROS days, we
investigated the number of days with snowpack (SWE > 1 mm) and rainfall (>1 mm) at different elevations within each basin (Fig. 3). In most basins, the decline in ROS at lower
altitudes was primarily driven by a decrease in the number of days with sufficient snowpack. In the Ganges and Indus basin, this reduction in ROS frequency was further exacerbated by a
decrease in rainfall days at lower elevations. Conversely, at higher altitude, the increase in ROS days was mainly driven by an increase in rainfall days, despite a continued decrease in
days with sufficient snowpack Changes in ROS intensity reflected a complex interplay between ROS rainfall and ROS snowmelt, with the dominant factor varying with elevation (Fig. 4). ROS
intensity generally increased at elevations below 1.0 km and above 5.0 km, while it generally decreased between 1.0 and 5.0 km. Below 1.0 km and above 5.0 km, the increase in ROS intensity
was primarily driven by increasing ROS rainfall, even though ROS snowmelt generally decreased. In contrast, between 1.0 and 5.0 km, both ROS snowmelt and ROS rainfall tended to decrease
(except in the Tarim Interior), but the greater magnitude of the snowmelt decrease drove the overall decline in ROS intensity within this elevation range. RISK OF ROSFLOOD ROSflood events
can trigger rapid snowmelt due to the accompanying rainfall, potentially leading to mixed rain‒snow floods. Our analysis confirmed that ROSflood events significantly accelerated snowmelt
rates in HMA. Compared to non-ROS events (2.63 mm/day), a 1.27-times faster snowmelt rate occurred during ROSflood events (3.36 mm/day) (Fig. 5). The amount of snowpack also influenced the
melting rate during ROS events. The melt rate continued to increase with increasing SWE. For example, areas with SWE > 200 mm experienced a 2.83-times faster melt rate (5.06 mm/d) during
ROS flood events than areas with SWE < 50 mm (3.07 mm/d). This suggested that ROSflood events have a higher possibility of triggering rapid snowmelt than regular ROS events, posing a
greater threat of rain‒snow mixed floods. Given the potential social and economic consequences of ROS floods, we identified high-risk areas and analyzed their characteristics (Fig. 6). The
Ganges and Irrawaddy basins were particularly susceptible, with daily ROSflood intensities reaching 22.28 mm and 24.87 mm, respectively. Altitudinal high-intensity ROS flood zones in HMA
were concentrated at altitudes from 2 to 3.5 km. Rainfall played a significant role in ROSflood intensity, contributing 71‒86% across different elevation ranges. To understand the relative
contribution of ROS events, we present the percentage of ROS event days (i.e., proportion of ROS days to all rainy days), ROS rainfall, and ROS snowmelt relative to their annual total values
(Figs. S8 and S9, Table S5). ROS events accounted for approximately 22.34% of all rainy days, contributing approximately 8.27% of the total rainfall and 18.44% of the total snowmelt. In
contrast, ROSflood events were much less frequent, representing only 1.4% of rainy days and contributing 2.52% of the total rainfall and 1.55% of the total snowmelt. Analyzing by basin,
ROSflood occurrences ranged from 0.1‒4%, with contributions to rainfall and snowmelt from 1.0‒7.4% and 0.3‒5.5%, respectively. The proportions of ROS event days, rainfall, and snowmelt
generally increased with altitude. However, ROSflood events were primarily concentrated at altitudes from 3.0 to 4.5 km, with frequencies of 3.0‒4.0% and contributions to rainfall and
snowmelt reaching 4.9‒6.6% and 1.9‒3%, respectively. Interestingly, at altitudes >6 km, both ROS and ROS flood events exhibited a historical trend of continuously increasing the
proportions of associated rainfall and snowmelt (Table S6). In order to more directly show the impact of ROS flood events on runoff, we further investigated runoff delineation based on the
pixel scale. These events were subsequently classified into four runoff classes (described in the “ROS event analyses” section). The analysis showed the following distribution: 39.88% were
classified as negligible runoff (Class 1), 10.62% as low runoff (Class 2), 9.68% as medium runoff (Class 3), and 38.60% as high runoff (Class 4) (Fig. S10). High runoff events were
predominantly concentrated in July and August, creating conditions conducive to mixed rain-and-snow flooding. DISCUSSION This study used a SWE model and ERA5-Land precipitation data to
comprehensively assess the spatiotemporal patterns and potential flood risks associated with ROS events under climate change in HMA. Analysis of historical data revealed that ROS events
occurred in 37.1% of the HMA region, exhibiting substantial spatial and temporal variability. These variations were primarily driven by altitudinal distributions of rainfall and snowpack.
Low-altitude regions experienced fewer ROS events, with ROS frequency generally increasing with elevation. Higher rainfall at lower altitudes, coupled with winter-concentrated snowpack, led
to a predominance of winter ROS events. In contrast, high-altitude regions (above 3.5 km) maintained near-perennial snow cover and received primarily snowfall, resulting in widespread summer
ROS events. The mid-elevation belt (2.5–3.5 km) served as a transition zone, with both rainfall and snowpack concentrated in spring. Notably, high ROS intensity was primarily observed in
this mid-elevation belt, with rainfall contributing approximately twice the volume of meltwater compared to snowmelt. Rainfall-dominated ROS intensity occurred in 83% of the region,
exceeding proportions reported in previous studies in Canada (33‒50%)27, the Krkonoše Mountains (52.7%)28, and the Swiss Alps foothills (5‒35%)29. Previous studies suggest a potential future
increase in ROS frequency across cold regions, mirroring trends observed in Alaska, Norway, the western United States, Canada, and Japan30,31,32. The trend in ROS frequency across the HMA
was complex and varied with elevation. At lower elevations, ROS frequency declined due to shrinking snow cover associated with rapid snowline retreat25,33,34. Declining snow cover area,
depth, and duration all contributed to this decrease in ROS days. Conversely, at higher elevations (above 5.5 km), ROS frequency increased as precipitation shifted from snow to rain. This
globally observed shift is pronounced in the HMA and is characterized by decreasing snowfall. ROS intensity also varied with elevation. Higher elevations experienced intensifying ROS events
due to increased rainfall, while lower and mid-elevations experienced decreased intensity, primarily due to reduced snowmelt. Notably, the mid-elevation zones, characterized by peak snow
water storage, exhibited the most significant decline in SWE. Furthermore, ROS event timing was advancing, particularly between 2.5 and 4.5 km, coinciding with earlier snowmelt flood seasons
in the Northern Hemisphere24. As snow cover decreases and rainfall replaces snowfall, ROS events are expected to become more frequent at higher elevations. Conversely, lower elevations,
particularly in warmer climates, may experience fewer or no ROS events due to reduced snowpack and rising temperatures. The spatiotemporal distribution of ROS frequency in HMA is also
influenced by atmospheric circulation patterns30,32. Interactions between the cryosphere and hydrosphere result in diverse circulation systems that drive regional variations in the water
cycle. The Amur and Syr Darya basins receive abundant winter and spring snowfall due to the mid-latitude westerly jet stream35, leading to frequent transitions between solid and liquid
phases and thus high ROS frequency. In contrast, the Indian monsoon, which dominates southern and eastern HMA, brings copious summer water vapor. This monsoon-induced precipitation, a
mixture of snow and rainfall in high-altitude mountains, results in frequent summer ROS events. Correlations between ROS and large-scale atmospheric patterns have also been identified, such
as a negative relationship between the Arctic and North Atlantic Oscillation indices in northern Xinjiang36. The Atlantic Multidecadal Oscillation also influences annual snowfall variability
in HMA37. The impact of ROS, particularly the heat it carries, can accelerate snowmelt and exacerbate flood risks. Our research shows that ROS events and ROS-induced flooding exhibited
snowmelt rates 1.64 and 6.49 times higher, respectively, than non-ROS melt rates. Several mechanisms, beyond the direct influences of rainfall and snowmelt, contribute to the substantial
runoff observed during ROS events, including enhanced runoff due to increased liquid water movement within saturated snowpacks. ROS events also influence snowmelt rates by altering snowpack
properties and meltwater runoff, potentially leading to snowmelt floods. Specifically, ROS events increase snowpack water content and melt rates, reduce albedo, intensify snow metamorphism
(coarsening snow grains), promote snowpack settlement and compaction, and increase snowpack thermal conductivity38. All these factors contribute to accelerated snowmelt. Experimental studies
on rainfall-induced snowmelt have shown that while light rainfall has a limited impact on meltwater runoff from thick snowpacks38, high-intensity rainfall leads to rapid meltwater
discharge. Snowpack saturation and the presence of basal ice can further expedite meltwater runoff. Other factors, including snow temperature, snowpack layering, snow grain size, and
snowpack maturity, also influence snowmelt rates2. Understanding the complex interplay between ROS events and these factors is crucial for predicting snowmelt and associated hydrological
hazards in HMA. The interplay between an overall slowdown in snowmelt rates and momentary acceleration during ROS events alters runoff variability, exacerbating water resource management
challenges7. Warming-induced reductions in snowfall rates further amplify extreme rainfall events in high-elevation areas (averaging 15% per degree of warming)10, which transport heat and
kinetic energy, scour snowpacks, generate short-duration, large flood peaks, carry substantial sediment, and can cause ice jams and dams, further intensifying flood severity. For example, a
2013 ROS-induced flood in the Heihe River, Qilian Mountains, with a 2-h rainfall of 26.3 mm, caused total economic losses exceeding 550 million yuan38. Understanding the complex interplay
between ROS events and these factors is crucial for predicting snowmelt and associated hydrological hazards in HMA. METHODS STUDY AREA HMA, which annually discharges an estimated 3786.4
billion cubic meters of water39, serves as the headwater for many of Asian major rivers22. These towering peaks store significant snow and glacial reserves, which are vital water resources
for hundreds of millions of people living downstream40. To examine the spatial distribution of ROS events across HMA, we divided the region into 13 sub-basins based on the watershed: the
Tibetan Interior, Mekong, Yellow River, Salween, Irrawaddy, Helmand, Tarim Interior, Ganges, Indus, Lake Balkash, Amu Darya, Yangtze, and Syr Darya (Fig. 7). We then mapped the maximum
extent of ROS occurrence, defined as the areas with a multiyear mean of >=1 d of ROS events, and calculated the proportion of this area within each sub-basin. Because of the rarity of ROS
events in some watersheds (i.e., the Tibetan Interior, Yellow River, Salween, and Irrawaddy), which represent <1% of HMA, these areas were not included in some figures. SWE, SNOWMELT
DATA, AND RAINFALL DATA This study utilized daily SWE and snowmelt data specifically generated for HMA by Kraaijenbrink et al.41. Their approach leveraged ERA5 atmospheric reanalysis data
for model forcing and incorporated calibration using MODIS remote sensing observations, resulting in high-resolution (0.05°) daily outputs spanning all major HMA river basins from 1979 to
2019. To enhance the realism of snowmelt simulations, Kraaijenbrink et al.41 employed a time-varying melt rate that considered changes in snow albedo. Furthermore, to capture the complex
seasonality of snow in these areas, the model utilized a 3-h time step and sub-grid routine, providing a more nuanced representation of snow cover during transitional periods. The accuracy
of the modeled SWE was validated against two independent datasets: in-situ measurements and daily snow depth maps derived from Sentinel-1 radar data41. The simulated SWE was in strong
agreement with the in-situ measurements in terms of both magnitude and timing. In addition, remote-sensing snow depth observations corroborated the performance of the model, with the
simulated snow depth closely matching the observed values. Precipitation data, which including total precipitation and snowfall were obtained from ERA5-Land reanalysis products. Rainfall was
derived by subtracting snowfall from precipitation. This dataset integrated atmospheric model simulations with global observations, and employs physical principles to create a consistent
and comprehensive global record. ERA5-Land has a high resolution of 0.1° (~9 km) and has provided hourly updates since 1950 for the entire Northern Hemisphere. Its effectiveness for
estimating extreme precipitation events and snow separation has been demonstrated in previous research10,24,42. DAILY ROS EVENT DEFINITION ROS events represented days with snow cover and
rainfall; however, there is no universally accepted threshold for rain or SWE. This study employed two thresholds to identify ROS events: (1) all potential ROS events, daily rainfall, and
SWE > 1 mm36. This approach captured a broad range of potential ROS; (2) ROS events with flood potential (ROSflood), i.e., daily rainfall and SWE > 10 mm15,26. This threshold focused
on ROS events with a higher likelihood of triggering flooding. Days that did not meet either threshold were classified as non-ROS events. ROS EVENT ANALYSES To comprehensively understand the
characteristics of ROS events in HMA, we examined in detail their frequency, timing, and intensity across seasons, regions, and elevations. The analysis encompassed the hydrological year
from September 1st of one year to August 31th of the subsequent year, spanning 1979‒2018. To quantify the characteristics of ROS events, we employed three key metrics: (1) ROS (ROSflood)
frequency represents the total number of ROS (ROSflood) days within a hydrological year. ROS duration was also calculated as the average number of consecutive ROS days within a hydrological
year. (2) ROS timing was calculated as the rainfall-weighted mean Julian day of ROS days, giving greater weight to days with heavier rainfall. (3) ROS (ROSflood) intensity is defined as
annual average of the sum of rainfall and meltwater occurring on days classified as ROS (ROSflood) day. To understand the spatial and temporal variations in ROS events, we conducted a
detailed analysis across seasons, regions, and elevations. We assessed the seasonal distribution of ROS events by calculating the proportion occurring in each season (spring: March–May;
summer: June–August; autumn: September–November; winter: December–February), revealing periods of peak ROS occurrence. Regional variations were analyzed by calculating ROS metrics for each
sub-basin, identifying areas with distinct ROS characteristics potentially influenced by regional climatic patterns and topography. Finally, we investigated the relationship between ROS and
elevation by analyzing ROS frequency and intensity at 500-m intervals across the HMA revealing how ROS events varied with altitude and are potentially influenced by factors such as
temperature gradients and precipitation patterns. We employed robust statistical techniques to assess temporal trends in ROS events. Sen’s slope43 was used to determine whether the time
series of ROS frequency, timing, or intensity exhibited a monotonic upward or downward trend. This analysis revealed whether ROS events became more or less frequent, earlier or later, and
more or less intense over the study period. Time series that exhibited significant trends were identified by Mann‒Kendall tests44. Temporal trends in ROS events were assessed using robust
statistical methods. Sen’s slope43 was used to determine monotonic trends in ROS frequency, timing, and intensity (i.e., whether these metrics increased or decreased over time). Significant
trends were identified using the Mann–Kendall test44. Finally, we investigated the potential impact of ROS events on snowmelt and flood risks. We compared the snowmelt rates during ROS (and
ROSflood) events to those during non-ROS events, further stratifying this comparison by annual maximum SWE. This analysis shed light on the potential role of ROS (or ROSflood) events in
enhancing snowmelt and their implications for water resources. To understand the flood risk associated with ROSflood events, we quantified their intensity and calculated the proportion of
ROSflood frequency, rainfall, and snowmelt relative to total rainfall days, total rainfall, and total snowmelt. This analysis provided insights into the contribution of ROSflood events to
the overall seasonal water balance and the potential for increased flood risk. The intensity of hydrological responses to ROS flood events was assessed by classifying events into four runoff
classes based on the relative increase in simulated runoff. This increase was calculated as the change in runoff between the day preceding the ROS flood (day zero) and the day of maximum
runoff within a six-day period following the event. The classifications were: Class 1 (negligible runoff), ≤125% of day zero runoff; Class 2 (low runoff), >125% and ≤250%; Class 3 (medium
runoff), >250% and ≤500%; and Class 4 (high runoff), >500%45. DATA AVAILABILITY The data supporting the findings of this study are publicly available from the following sources. Daily
snow-water equivalent and snowmelt data are available at https://doi.org/10.5281/zenodo.4715786. ERA5-Land reanalysis product was obtained from the Copernicus Data Service
(https://cds.climate.copernicus.eu/datasets/reanalysis-era5-land?tab=overview). Watershed vector data used in this study were obtained from HydroBASINS
(https://www.hydrosheds.org/products/hydrobasins). CODE AVAILABILITY Code is available upon request to the corresponding author. REFERENCES * Serreze, M. C. et al. Arctic rain on snow
events: Bridging observations to understand environmental and livelihood impacts. _Environ. Res. Lett._ 16, 105009 (2021). Article Google Scholar * McCabe, G. J., Clark, M. P. & Hay,
L. E. Rain-on-snow events in the western United States. _Bull. Am. Meteorol. Soc._ 88, 319–328 (2007). Article Google Scholar * Pomeroy, J. W., Fang, X. & Marks, D. G. The cold
rain-on-snow event of June 2013 in the Canadian Rockies—characteristics and diagnosis. _Hydrol. Process._ 30, 2899–2914 (2016). Article Google Scholar * Rössler, O. et al. Retrospective
analysis of a nonforecasted rain-on-snow flood in the Alps—a matter of model limitations or unpredictable nature? _Hydrol. Earth Syst. Sci._ 18, 2265–2285 (2014). Article Google Scholar *
Crawford, A. D., Alley, K. E., Cooke, A. M. & Serreze, M. C. Synoptic climatology of rain-on-snow events in Alaska. _Mon. Weather Rev._ 148, 1275–1295 (2019). Article Google Scholar *
Musselman, K. N., Addor, N., Vano, J. A. & Molotch, N. P. Winter melt trends portend widespread declines in snow water resources. _Nat. Clim. Change_ 2021, 418–424 (2021). Article
Google Scholar * Musselman, K. N., Clark, M. P., Liu, C., Ikeda, K. & Rasmussen, R. Slower snowmelt in a warmer world. _Nat. Clim. Change_ 7, 214–219 (2017). Article Google Scholar *
Beniston, M. et al. The European mountain cryosphere: a review of its current state, trends, and future challenges. _Cryosphere_ 12, 759–794 (2018). Article Google Scholar * López-Moreno,
J. I., Pomeroy, J. W., Alonso-González, E., Morán-Tejeda, E. & Revuelto, J. Decoupling of warming mountain snowpacks from hydrological regimes. _Environ. Res. Lett._ 15, 114006 (2020).
Article Google Scholar * Ombadi, M., Risser, M. D., Rhoades, A. M. & Varadharajan, C. A warming-induced reduction in snow fraction amplifies rainfall extremes. _Nature_ 619, 305–310
(2023). Article CAS Google Scholar * Rhoades, A. M. et al. Asymmetric emergence of low-to-no snow in the midlatitudes of the American cordillera. _Nat. Clim. Change_ 12, 1151–1159 (2022).
Article Google Scholar * Siirila-Woodburn, E. R. et al. A low-to-no snow future and its impacts on water resources in the western United States. _Nat. Rev. Earth Environ._ 2, 800–819
(2021). Article Google Scholar * Morán-Tejeda, E., López-Moreno, J. I., Stoffel, M. & Beniston, M. Rain-on-snow events in Switzerland: recent observations and projections for the 21st
century. _Clim. Res._ 71, 111–125 (2016). Article Google Scholar * López-Moreno, J. I. et al. Changes in the frequency of global high mountain rain-on-snow events due to climate warming.
_Environ. Res. Lett._ 16, 094021 (2021). Article Google Scholar * Musselman, K. N. et al. Projected increases and shifts in rain-on-snow flood risk over western North America. _Nat. Clim.
Change_ 8, 808–812 (2018). Article Google Scholar * Surfleet, C. G. & Tullos, D. Variability in effect of climate change on rain-on-snow peak flow events in a temperate climate. _J.
Hydrol._ 479, 24–34 (2013). Article Google Scholar * Freudiger, D., Kohn, I., Stahl, K. & Weiler, M. Large-scale analysis of changing frequencies of rain-on-snow events with
flood-generation potential. _Hydrol. Earth Syst. Sci._ 18, 2695–2709 (2014). Article Google Scholar * Merz, R. & Blöschl, G. A process typology of regional floods. _Water Resour. Res_.
39, https://doi.org/10.1029/2002WR001952 (2003). * Li, D., Lettenmaier, D. P., Margulis, S. A. & Andreadis, K. The role of rain‐on‐snow in flooding over the conterminous United States.
_Water Resour. Res._ 55, 8492–8513 (2019). Article Google Scholar * Tarasova, L., Basso, S. & Merz, R. Transformation of generation processes from small runoff events to large floods.
_Geophys. Res. Lett._ 47, e2020 (2020). Article Google Scholar * Myers, D. T., Ficklin, D. L. & Robeson, S. M. Incorporating rain-on-snow into the SWAT model results in more accurate
simulations of hydrologic extremes. _J. Hydrol._ 603, 126972 (2021). Article Google Scholar * Yao, T. et al. The imbalance of the Asian water tower. _Nat. Rev. Earth Environ._ 3, 1–15
(2022). Article Google Scholar * Yang, Z. et al. Spatiotemporal variability of rain-on-snow events in the arid region of Northwest China. _J. Arid Land_ 16, 483–499 (2024). Article Google
Scholar * Han, J. et al. Streamflow seasonality in a snow-dwindling world. _Nature_ 629, 1075–1081 (2024). Article CAS Google Scholar * Li, Y. et al. The continuing shrinkage of snow
cover in High Mountain Asia over the last four decades. _Sci. Bull._ 67, 2064–2068 (2022). Article Google Scholar * Maina, F. Z. & Kumar, S. V. Diverging trends in rain-on-snow over
High Mountain Asia. _Earths Future_ 11, e2022 (2023). Article Google Scholar * Eiriksson, D. et al. An evaluation of the hydrologic relevance of lateral flow in snow at hillslope and
catchment scales. _Hydrol. Process._ 27, 640–654 (2013). Article Google Scholar * Juras, R. et al. Isotopic tracing of the outflow during artificial rain-on-snow event. _J. Hydrol._ 541,
1145–1154 (2016). Article CAS Google Scholar * Rücker, A., Boss, S., Kirchner, J. W. & von Freyberg, J. Monitoring snowpack outflow volumes and their isotopic composition to better
understand streamflow generation during rain-on-snow events. _Hydrol. Earth Syst. Sci._ 23, 2983–3005 (2019). Article Google Scholar * Guan, B., Waliser, D. E., Ralph, F. M., Fetzer, E. J.
& Neiman, P. J. Hydrometeorological characteristics of rain‐on‐snow events associated with atmospheric rivers. _Geophys. Res. Lett._ 43, 2964–2973 (2016). Article Google Scholar *
Rennert, K. J., Roe, G., Putkonen, J. & Bitz, C. M. Soil thermal and ecological impacts of rain on snow events in the circumpolar Arctic. _J. Clim._ 22, 2302–2315 (2009). Article Google
Scholar * Ohba, M. & Kawase, H. Rain-on-Snow events in Japan as projected by a large ensemble of regional climate simulations. _Clim. Dyn._ 55, 2785–2800 (2020). Article Google
Scholar * Tang, Z. et al. Spatiotemporal variation of snowline altitude at the end of melting season across High Mountain Asia, using MODIS snow cover product. _Adv. Space Res._ 66,
2629–2645 (2020). Article Google Scholar * Tang, Z. et al. Satellite observed spatiotemporal variability of snow cover and snow phenology over high mountain Asia from 2002 to 2021. _J.
Hydrol._ 613, 128438 (2022). Article Google Scholar * Kapnick, S. B., Delworth, T. L., Ashfaq, M., Malyshev, S. & Milly, P. C. D. Snowfall less sensitive to warming in Karakoram than
in Himalayas due to a unique seasonal cycle. _Nat. Geosci._ 7, 834–840 (2014). Article CAS Google Scholar * Zhou, G., Zhang, D., Wan, J., Cui, M. & Zhang, S. Mapping reveals
contrasting change patterns of rain-on-snow events in China during 2001–2018. _J. Hydrol._ 617, 129089 (2023). Article Google Scholar * Sun, F. et al. Decreasing trends of mean and extreme
snowfall in High Mountain Asia. _Sci. Total Environ._ 921, 171211 (2024). Article CAS Google Scholar * Chen, R. et al. Progress and issues on key technologies in forecasting of snowmelt
flood disaster in arid areas, northwest China. _Adv. Earth Sci._ 36, 233 (2021). Google Scholar * Xu, J. et al. Totaling river discharge of the third pole from satellite imagery. _Remote
Sens. Environ._ 308, 114181 (2024). Article Google Scholar * Immerzeel, W. W., Van Beek, L. P. H. & Bierkens, M. F. P. Climate change will affect the Asian water towers. _Science_ 328,
1382–1385 (2010). Article CAS Google Scholar * Kraaijenbrink, P. D. A., Stigter, E. E., Yao, T. & Immerzeel, W. W. Climate change decisive for Asia’s snow meltwater supply. _Nat.
Clim. Change_ 11, 591–597 (2021). Article Google Scholar * Mahto, S. S. & Mishra, V. Does ERA‐5 outperform other reanalysis products for hydrologic applications in India? _JGR Atmos._
124, 9423–9441 (2019). Article Google Scholar * Sen, P. K. Estimates of the regression coefficient based on Kendall’s Tau. _J. Am. Stat. Assoc._ 63, 1379–1389 (1968). Article Google
Scholar * Mann, H. B. Nonparametric tests against trend. _Econometrica_ 13, 245–259 (1945). Article Google Scholar * Hotovy, O., Nedelcev, O. & Jenicek, M. Changes in rain-on-snow
events in mountain catchments in the rain-snow transition zone. _Hydrological Sci. J._ 68, 572–584 (2023). Article Google Scholar Download references ACKNOWLEDGEMENTS This work was
supported by the Xinjiang Key Laboratory of Water Cycle and Utilization in Arid Zone, Xinjiang Institute of Ecology and Geography, Chinese Academy of Sciences (XJYS0907-2023-19), the Natural
Science Foundation of Xinjiang Uygur Autonomous Region (2024D01A143), National Natural Science Foundation of China (42130512), the Tianshan Talent Program of Xinjiang, China
(2022TSYCCX0042) and Youth Innovation Promotion Association of the Chinese Academy of Sciences. AUTHOR INFORMATION AUTHORS AND AFFILIATIONS * Xinjiang Key Laboratory of Water Cycle and
Utilization in Arid Zone, Xinjiang Institute of Ecology and Geography, Chinese Academy of Sciences, Urumqi, 830011, China Yupeng Li * State Key Laboratory of Desert and Oasis Ecology, Key
Laboratory of Ecological Safety and Sustainable Development in Arid Lands, Xinjiang Institute of Ecology and Geography, Chinese Academy of Sciences, Urumqi, 830011, China Yupeng Li, Fan Sun,
Yaning Chen, Gonghuan Fang, Zhi Li, Weili Duan, Jingxiu Qin & Xueqi Zhang * College of Geographic and Tourism, Xinjiang Normal University, Urumqi, 830054, China Yaning Chen * School of
Geography and Tourism, Qufu Normal University, Qufu, 273100, China Baofu Li Authors * Yupeng Li View author publications You can also search for this author inPubMed Google Scholar * Fan Sun
View author publications You can also search for this author inPubMed Google Scholar * Yaning Chen View author publications You can also search for this author inPubMed Google Scholar *
Gonghuan Fang View author publications You can also search for this author inPubMed Google Scholar * Zhi Li View author publications You can also search for this author inPubMed Google
Scholar * Weili Duan View author publications You can also search for this author inPubMed Google Scholar * Jingxiu Qin View author publications You can also search for this author inPubMed
Google Scholar * Xueqi Zhang View author publications You can also search for this author inPubMed Google Scholar * Baofu Li View author publications You can also search for this author
inPubMed Google Scholar CONTRIBUTIONS Y.L., Y.C., and B.L. designed the research, performed analysis, and drafted the paper. F.S., G.F., Z.L., W.D., J.Q., and X.Z. contributed to the
interpretation of the results and to the text. CORRESPONDING AUTHORS Correspondence to Yaning Chen or Baofu Li. ETHICS DECLARATIONS COMPETING INTERESTS The authors declare no competing
interests. ADDITIONAL INFORMATION PUBLISHER’S NOTE Springer Nature remains neutral with regard to jurisdictional claims in published maps and institutional affiliations. SUPPLEMENTARY
INFORMATION SUPPLEMENTARY INFORMATION RIGHTS AND PERMISSIONS OPEN ACCESS This article is licensed under a Creative Commons Attribution-NonCommercial-NoDerivatives 4.0 International License,
which permits any non-commercial use, sharing, distribution and reproduction in any medium or format, as long as you give appropriate credit to the original author(s) and the source, provide
a link to the Creative Commons licence, and indicate if you modified the licensed material. You do not have permission under this licence to share adapted material derived from this article
or parts of it. The images or other third party material in this article are included in the article’s Creative Commons licence, unless indicated otherwise in a credit line to the material.
If material is not included in the article’s Creative Commons licence and your intended use is not permitted by statutory regulation or exceeds the permitted use, you will need to obtain
permission directly from the copyright holder. To view a copy of this licence, visit http://creativecommons.org/licenses/by-nc-nd/4.0/. Reprints and permissions ABOUT THIS ARTICLE CITE THIS
ARTICLE Li, Y., Sun, F., Chen, Y. _et al._ Unraveling the complexities of rain-on-snow events in High Mountain Asia. _npj Clim Atmos Sci_ 8, 118 (2025).
https://doi.org/10.1038/s41612-025-00943-y Download citation * Received: 17 October 2024 * Accepted: 10 February 2025 * Published: 23 March 2025 * DOI:
https://doi.org/10.1038/s41612-025-00943-y SHARE THIS ARTICLE Anyone you share the following link with will be able to read this content: Get shareable link Sorry, a shareable link is not
currently available for this article. Copy to clipboard Provided by the Springer Nature SharedIt content-sharing initiative