A comparison of the meridional meandering of extratropical precipitation during boreal winter: eddy momentum flux versus eulerian storm tracks
- Select a language for the TTS:
- UK English Female
- UK English Male
- US English Female
- US English Male
- Australian Female
- Australian Male
- Language selected: (auto detect) - EN
Play all audios:

ABSTRACT The latitudinal distribution of winter extratropical precipitation is often regarded as being determined by the location and intensity of the storm track. Here, we compare the
precipitation variability associated with the meridional eddy momentum flux (EMF) with that associated with an Eulerian storm track measure. Observations show that when the midlatitude EMF
is anomalously poleward, the occurrence of moderate-to-heavy precipitation (1–33 mm day-1) increases between 45°N and 70°N, while decreasing between 25°N and 45°N. This shift occurs mostly
downstream of the climatological storm track maximum, with generally greater precipitation anomalies compared to those associated with storm track changes. The shift is tied to changes in
horizontal moisture transport primarily by planetary scale waves. These results suggest that, in addition to the storm track intensity, dynamics of the horizontal wave tilts which affect the
EMF intensity need to be considered when projecting future changes in precipitation variability. SIMILAR CONTENT BEING VIEWED BY OTHERS THE PRECIPITATION DISTRIBUTION SET BY EDDY FLUXES:
THE CASE OF BOREAL WINTER Article Open access 25 March 2023 INCREASING CONTRIBUTION OF THE ATMOSPHERIC VERTICAL MOTION TO PRECIPITATION IN A WARMING CLIMATE Article Open access 30 September
2024 RESPONSE OF WINTER CLIMATE AND EXTREME WEATHER TO PROJECTED ARCTIC SEA-ICE LOSS IN VERY LARGE-ENSEMBLE CLIMATE MODEL SIMULATIONS Article Open access 17 January 2024 INTRODUCTION During
the cold season, extratropical cyclones and fronts are known to explain up to about 90% of midlatitude precipitation1,2. As climate models project a poleward shift of storm tracks in a
warmer climate, the connection between the storm track shift and a corresponding precipitation change has recently received increased attention3,4,5,6. Because both storm activity and
precipitation inherently operate on intraseasonal timescales, examining their relationship on this timescale is crucial for uncovering the mechanisms driving future changes in precipitation.
In this regard, it is interesting that the study by Besson et al.7 finds that the location of the ascending motion, induced by the upper tropospheric forcing, to be a strong predictor of
the direction of (Lagrangian) storm propagation. In contrast, their Eady growth rate measure, which depends on the low-level temperature gradient, provides little information on the
propagation direction. The commonly used Eulerian storm track measures (e.g., eddy kinetic energy8; geopotential variance9; meridional wind variance10) also depend on the low-level
temperature gradient or baroclinicity, even though the measures can be calculated at either lower or upper levels of the troposphere. The upper-level forcing onto the ascending motion is
typically dominated by the convergence of the meridional flux of zonal momentum by eddies, commonly known as the eddy momentum flux (EMF). Thus, from the result of Besson et al.7, one may
infer that the poleward shift of individual storm systems, hence the accompanying precipitation, could be more closely linked to the EMF than to Eulerian measures of storm intensity. This is
also consistent with the findings that nonlinear horizontal advection of potential vorticity, which includes the EMF, contributes to the poleward shift of storms11,12,13. From a perspective
stemming from the transformed Eulerian mean (TEM) theory14, Yoo and Lee15 hypothesised that the strength of the EMF has a substantial impact on TEM vertical motion, and hence on
extratropical precipitation. Consistent with this hypothesis, they found that the precipitation peak shifts from about 40°N to 60°N due to a dipole precipitation anomaly when the EMF exceeds
two standard deviations above its climatological value. No such dipole anomaly was observed when the eddy heat flux strength was varied. Yoo and Lee examined only the zonal mean
precipitation field in accordance with TEM theory. However, because the EMF varies in the zonal direction, a natural question to ask is whether the meridional shift in precipitation occurs
predominantly in the region downstream of the maximum storm track intensity, where the EMF has a local maximum. The above studies raise the following questions: how do these EMF-induced
dipole precipitation anomalies compare in intensity with the dipole precipitation anomalies that could result from a meridional meander of the storm track intensity maximum? Does the
meridional shift in precipitation occur primarily downstream of the storm track, where the EMF exerts a strong influence? If the precipitation anomalies associated with the storm track
position variability is weaker than that associated with the EMF, this would suggest that the dynamics of the EMF variability is as important as, or perhaps more important than, the
variability of the storm track position in explaining the meridional meandering of precipitation. For a nuanced interpretation, we examine precipitation anomalies contributed by a range of
different precipitation rates. By doing so, we can address if those precipitation anomalies are caused by heavy, moderate, or weak precipitation events. The analysis is carried out for the
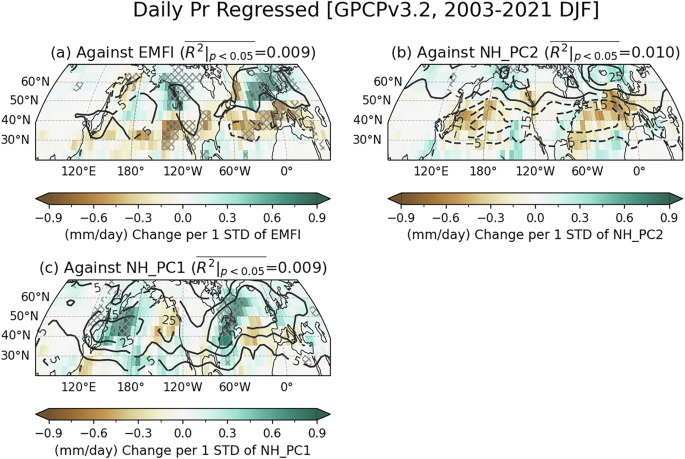
Northern Hemisphere (NH) winter, as the eddies and their impact on precipitation are the strongest in winter. RESULTS PRECIPITATION DISTRIBUTION ASSOCIATED WITH EMF Figure 1a shows the
regressed daily DJF precipitation rates against the EMF index (EMFI). Throughout this study, to exclude the impact of interannual variability, each year’s DJF mean is removed from the
dependent variables before conducting the regression analysis. However, the results remain essentially the same when interannual variability is not removed (not shown). Here, the EMFI is
defined to capture the strength of midlatitude EMF (35°N–55°N and 250–1000 hPa). The index is positive when the EMF is anomalously poleward with respect to its winter climatology, and
negative when the EMF is anomalously equatorward (Methods). The precipitation anomalies associated with the EMFI show meridional shifts, with their nodes located near 45°N (shaded). The
magnitude of change is large in the downstream region of the climatological storm track (Supplementary Fig. 1 for the pattern of the climatological storm track and precipitation), reaching
up to 1 mm day-1 per standard deviation (STD) of EMFI. The dipole pattern is evident for both the Pacific and Atlantic jet exit regions, with enhanced precipitation over 45°N–70°N and
reduced precipitation over 25°N–45°N in response to an increase in EMFI. The changes are statistically significant at the 95% confidence level (hatched). For precipitation, it can be useful
to consider anomalies of varying intensities, as the variability of heavy precipitation may differ from that of light precipitation. To explore this, we categorise precipitation days based
on precipitation rates and examine how the occurrence frequencies of these categories shift in response to EMFI (Fig. 2). Six precipitation categories are defined using logarithmically
spaced bins, and regression analysis is conducted on the normalised frequencies for each category (Methods). Except for the heaviest (greater than 33 mm day-1; Fig. 2a) and marginal (0–1.0
mm day-1; Fig. 2e) precipitation categories, a meridional dipole anomaly is observed in the precipitation frequency changes (Fig. 2b–d), as shown in the precipitation amount (Fig. 1a). The
magnitude of the frequency changes is up to 3% and is statistically significant at the 95% confidence level, particularly over the jet exit regions. In addition, an almost identical pattern
with the opposite sign is found for the category of no precipitation (0 mm day-1; Fig. 2f). The opposite sign in the no precipitation category indicates a consistent overall change in
precipitation with the other precipitation bins; the fraction with no precipitation decreases in regions where moderate precipitation occurs more frequently, and vice versa. For the heaviest
(Fig. 2a) and the marginal (Fig. 2e) precipitation categories, the changes in the frequency of occurrence are relatively modest. In the former, a meridional dipole, consistent with the
anomalies in the other non-zero precipitation categories, is present only over the North Atlantic. In the latter, a similar meridional dipole is discernible only over the North Pacific. One
might ask whether the meridional redistribution of precipitation shown in Figs. 1a and 2 can be attributed to the changes in storm track activity associated with the EMF. This is plausible
because the EMF, especially that generated by synoptic eddies, is inherently related to storm track activity. To investigate this relationship, we perform a regression analysis of an
Eulerian storm track activity measure (i.e., the root-mean-square (RMS) of the bandpass filtered z500 anomaly; defined in Methods) against the EMFI (contours in Figs. 1a and 2). In the North
Atlantic, regions of increased or decreased precipitation coincide somewhat with regions of increased or decreased storm track activity. In the North Pacific, however, the storm track
changes show a monopole structure. As a result, changes in precipitation occurrences generally do not overlap with changes in storm track intensity. Moreover, the intensity change in the
storm track associated with the EMFI is about 5 gpm, which is about one-fifth of one standard deviation change in storm track intensity (Supplementary Fig. 2). The weak relationship between
the EMFI and storm track activity indicates that the changes in precipitation distribution associated with the EMFI are not caused by changes in storm track intensity, particularly over the
North Pacific. This discord between the EMF and the storm track intensity is somewhat expected, because the strength of the EMF depends not only on the eddy amplitude, but also on the
horizontal tilt of the eddies16,17. In fact, without the tilt, the EMF is zero regardless of the magnitude of the eddy amplitude. PRECIPITATION DISTRIBUTION ASSOCIATED WITH STORM TRACKS The
above results lead us to our question of whether meridional shifts in the storm track itself are associated with comparable meridional shifts in precipitation. To test this hypothesis, using
geopotential variance, we first construct an index that measures the degree of north-south storm track shifts over the North Pacific and North Atlantic (Supplementary Fig. 2). Previously,
Lau9 performed a similar Empirical Orthogonal Function (EOF) analysis of the storm track separately for the North Pacific (25°N–70°N, 100°E–110°W) and the North Atlantic (25°N–70°N,
110°W–40°E) regions. (These results are provided in the Supplementary Information.) In the present study, for a direct comparison with the EMFI, which is based on the zonal mean eddy
momentum flux, the EOF analysis is carried out for the zonal mean of the entire NH (25°N–70°N, 180°W–180°E). It turns out that the first EOF expresses changes in storm track intensity
(Supplementary Fig. 2e), with monopole anomalies collocated with the climatological maxima over each ocean basin (Supplementary Fig. 1a). The second EOF exhibits a dipole pattern that
accounts for a meridional shift in the zonal-mean storm tracks (Supplementary Fig. 2f). The EOF results are consistent with those of Wettstein and Wallace18. Therefore, we use the second
principal component (PC2) of the NH as our index for the meridional shift of the local storm track activity metric and the first PC (PC1) of the NH as a reference for changes in storm track
intensity. The PCs show weak correlations with the EMFI, with simultaneous correlation coefficients of 0.171 for PC1 and 0.048 for PC2. They are 0.110 and 0.022, respectively, when the
interannual signals are removed from the EMFI. 1) MERIDIONAL SHIFTS OF STORM TRACKS To identify horizontal patterns corresponding to the hemisphere-wide storm track shift, we perform a
regression analysis of the storm track anomaly against NH PC2 (contours in Figs. 1b and 3). The pattern shows broad negative anomalies from 30°N to 55°N and positive anomalies poleward of
55°N, indicating a hemisphere-wide poleward shift of the storm track activity. In each basin, the pattern is comparable to that found in the regional EOFs (Supplementary Fig. 2b, d). As
expected, precipitation tends to decrease in the region of reduced storm track activity and increase in the region of enhanced storm track activity (Fig. 1b). However, the precipitation
anomaly tends to be amplified in the downstream region, although this is not as pronounced as in the EMFI case. The minimum and maximum values are –0.64 and 0.43 mm day-1 in the North
Pacific and are –0.74 and 0.42 mm day-1 in the North Atlantic for NH PC2 (Fig. 1b). The magnitudes of the slopes are smaller than those values for EMFI (i.e., –0.77 and 1.25 mm day-1 in the
North Pacific and –0.97 and 1.11 mm day-1 in the North Atlantic; Fig. 1a). Also, the percentages of statistically significant grids in the entire NH are 20.14% and 3.33% for EMFI and NH PC2,
respectively (hatched in Fig. 1a, b). The precipitation anomaly associated with the NH PC2 (Fig. 1b) is largely explained by the changes in precipitation frequencies for the
moderate-to-heaviest precipitation categories, as well as no precipitation category (Fig. 3). Reduced frequencies of occurrence are observed in the region of decreased storm track activity,
while the opposite is true for no precipitation category. However, the precipitation regression slope against NH PC2 tends to be slightly smaller than that against EMFI (about 2% versus 3%
in moderate-to-heavy (Fig. 3b–d) precipitation categories), further suggesting that the relationship between precipitation anomalies and the EMF is as strong as that with storm track
variability (see also the comparison between Fig. 1a, b). Figure 3b, c show an interesting characteristic that precipitation dipole anomalies tend to occur downstream of the peak storm track
anomalies. For example, there are prominent dipole anomalies (for the categories 10–33 mm day-1 and 3.3–10 mm day-1; Fig. 3b–c) over the eastern end of the North Atlantic Ocean and part of
western Europe, and this area is located downstream of the storm track peak. The pattern for the no-precipitation category also shows anomalies off-centred from the peak storm track anomaly
(Fig. 3f). For the categories of 1.0–3.3 mm day-1 and 0–1.0 mm day-1, the precipitation anomalies are relatively weak and their patterns show little agreement with the storm track anomaly
pattern (Fig. 3d–e). For the heaviest category (greater than 33 mm day-1), however, in both ocean basins, the centre of negative precipitation anomalies coincides with that of negative storm
track anomalies (Fig. 3a). These results overall indicate a lower sensitivity of precipitation to the shift in the storm track than to EMFI. 2) PULSATION OF STORM TRACKS Next, we examine
how the precipitation distribution changes in association with NH PC1, a measure of hemisphere-wide storm track intensity (shaded in Supplementary Fig. 3). We find that the precipitation
anomalies closely align with the storm track intensity, with precipitation increasing by approximately 1 mm day-1 in regions where storm track intensity is enhanced (Fig. 1c). Specifically,
the minimum and maximum values are –0.45 and 0.90 mm day-1 in the North Pacific and are –0.46 and 0.99 mm day-1 in the North Atlantic, and the percentage of statistically significant grids
in the entire NH is 8.33%. The magnitude of these values is overall larger than those associated with NH PC2, but smaller than those associated with EMFI. Notably, the precipitation anomaly
here is located upstream of the climatological storm track, in contrast to the precipitation anomalies associated with either the EMFI or the NH PC2. Furthermore, the precipitation anomaly
of NH PC1 is mainly due to changes in the frequency of the heaviest category (greater than 33 mm day-1; Supplementary Fig. 3a), rather than by changes in the moderate to heavy categories.
The match between the frequency change of the heaviest category (shaded) and the changes in the storm tracks (contours) can also be seen in Figs. 2a and 3a. This leads to the speculation
that the variability of the heaviest precipitation category is likely related to the pulsation of the storm tracks. For other categories, the agreement between the precipitation frequency
and storm track intensity anomalies is weaker. MOISTURE TRANSPORT Previous studies have shown that the poleward shift in precipitation is associated with an increase in the intensity and
frequency of poleward moisture transport15,19,20,21. Consistently, we find that the integrated moisture transport (IVT) convergence helps interpret the precipitation changes associated with
the EMFI and NH PCs (Fig. 4). The IVT convergence regressed onto the EMFI shows positive anomalies over the North Pacific near Alaska and the eastern North Atlantic, while negative anomalies
are present along the western side of the North Pacific and the North Atlantic and in various subtropical regions (Fig. 4a). These IVT convergence anomalies closely resemble the
precipitation anomalies associated with the EMFI (Fig. 1a). Figure 6 in Yoo and Lee15 shows that when EMFI is large (i.e., during an anomalously poleward EMF), eddies exhibit anomalously
strong southwest-northeast tilts, as expected, and precipitation occurs to the northeast downstream of these tilted eddies. This indicates that anomalously strong poleward moisture transport
is facilitated by the strong northeastward flow, which simultaneously results in a large EMFI. To examine whether the IVT pattern shown in Fig. 4a aligns with this physical picture, the
covariance between the eddy components of the daily 700 hPa zonal wind (\({u}^{* }\)) and the meridional wind (\({v}^{* }\)) at each grid point is regressed against EMFI (Fig. 5). Here, the
superscript \(*\) indicates the deviation from the zonal mean. We find that the region of high covariance indeed takes on a southwest-northeast tilt in upstream areas where the precipitation
shifts are pronounced. For example, the enhanced \({u}^{* }{v}^{* }\) of planetary-scale waves with zonal wave numbers \(k\le 3\) is evident in the North Pacific (centred at 45°N, 180°) and
the North Atlantic (centred at 50°N, 40°W) (Fig. 5a). These anomalies are generally located upstream of the positive precipitation anomaly in both the North Pacific and the North Atlantic
(Fig. 1a), indicating that the enhanced \({u}^{* }{v}^{* }\) coincides with areas of enhanced IVT. Also observed is a negative planetary \({u}^{* }{v}^{* }\) anomaly in the subtropical North
Atlantic towards the Mediterranean Sea (centred at 40°N, 0°) (Fig. 5a). Consistently, this negative anomaly is located downstream of the negative precipitation anomaly in the subtropical
North Atlantic (Fig. 1a). This southwest-northeast tilt of the covariance is caused by planetary-scale waves with zonal wave numbers \(k\le 3\) (Fig. 5a). This result is consistent with the
findings of Baggett et al.22, who showed that poleward moisture transport is pronounced when planetary-scale waves are anomalously strong. They demonstrated that the planetary waves
transport moisture northeastward while simultaneously diverting shorter (\(k\ge 4\)) waves northward. Figure 5b shows that the covariance structure for the shorter waves is mostly zonal;
however, Baggett et al.22 also showed that these shorter waves, embedded within the planetary-scale waves, also transport moisture poleward. Therefore, our interpretation of these results is
that the EMFI-precipitation relationship arises from southwest-northeast oriented tilts of planetary-scale waves, which directly transport moisture northeastward, but also steer short
synoptic-scale waves in the same direction. The IVT convergence associated with the NH PC2 also aligns with the precipitation pattern (Figs. 5b and 1b), though it generally exhibits smaller
regression slopes and lower statistical significance, compared to those of the EMFI (Figs. 5a and 1a). Figure 5c shows that in the North Atlantic, where the poleward precipiation shift is
evident, the \({u}^{* }{v}^{* }\) covariance by the planetary scale waves once again exhibits a southwest-northeast tilt. Similar \({u}^{* }{v}^{* }\) covariance structure is seen neither in
the shorter waves (Fig. 5d) nor in those associated with the NH PC1 (Fig. 4c and Fig. 5e, f). DISCUSSION This study investigated the meridional shift in the extratropical precipitation
distribution to help answer two research questions related to eddy momentum flux (EMF): 1) whether the meridional precipitation shifts associated with the EMF15 occur mostly downstream of
the peak storm track intensity; 2) how these precipitation changes compare in their magnitude and location with those associated with storm track variability. The analysis was performed for
the Northern Hemisphere and boreal winter using precipitation observations and reanalysis data. Changes in precipitation were analysed by regressing precipitation against EMF and storm track
indices. Changes in precipitation distribution were also measured using the frequency of occurrence of the precipitation rate for six categories ranging from no precipitation to heavy
precipitation. For the first question, we found that when poleward EMF is anomalously strong, precipitation increases between 45°N–70°N and decreases between 25°N–45°N. This pattern is
attributed to the enhanced frequency of moderate to heavy precipitation (1–33 mm day-1) and to the reduced frequency of no precipitation in the regions. As was hypothesised, in both the
North Pacific and the North Atlantic, these shifts occur downstream of their respective climatological storm track peaks. Changes in moisture transport associated with the EMF are
responsible for the meridional precipitation shift, which appears to be driven primarily by planetary-scale waves tilted in a southwest-northeast direction. To address our second question,
we examined precipitation variability associated with the meridional displacement in storm track anomaly (NH PC2). The result showed that the precipitation changes associated with the NH PC2
were notable only downstream of the storm track shift, with minimal changes observed upstream. Additionally, these downstream anomalies are smaller in spatial extent and weaker in amplitude
than the precipitation anomalies associated with the EMF. Therefore, we conclude that the meridional meander of the moderate-to-heavy precipitation events is more closely tied to the EMF
than to the meridional meander of the storm track itself, at least for the measure used in this study. The above results remain robust when regionally defined storm track indices
(Supplementary Fig. 2a–d) are used to examine their influence on precipitation distribution changes (Supplementary Figs. 4–7). Larger precipitation anomalies are found when regional storm
track indices are used over the corresponding ocean basins. This is expected, since regionally sampled storm track changes are more than twice as strong as those sampled globally (see
contour intervals). Nevertheless, qualitatively the pattern of precipitation changes remains almost unchanged for all categories. These findings support the conclusion of Yoo and Lee15 that
variability of EMF strength plays a critical role in driving sizable meridional shifts in precipitation. Vertically integrated moisture transport was responsible for the precipitation
changes, indicating that variations in moist and dry air transport play a crucial role in driving these precipitation meanders. This again supports the idea expressed in Yoo and Lee15 that
EMF-driven precipitation variability is intimately linked to dry intrusions and warm moisture conveyor belts, which frequently occur in extratropical storm systems. The main results of this
study indicate that for moderate to heavy precipitation, the EMF-precipitation relationship does not arise due to its association with variability in storm track intensity. Instead, the
relationship arises because the EMFI reflects southwest-northeast wave tilts of planetary-scale waves. The planetary scale eddy flux is not independent of the storm track eddies, however,
because the tilts are most pronounced in the jet exit regions where northward migration of storm track eddies is most frequent23. Consistent with this picture, Baggett et al.22 showed that
synoptic-scale eddies are steered northward by the planetary-scale waves. Since this steering would be captured by Lagrangian storm-track measures, it may be that Lagrangian storm-track
measure are likely to better align with precipitation and EMF. It would be interesting to explore this possibility in a future study. The sign and magnitude of the EMF are primarily governed
by large-scale dynamical factors, including horizontal shear, the potential vorticity gradient, and the Rossby wave refractive index. While these large-scale fields are influenced by the
latent heating associated with precipitation, precipitation itself is a higher-order component of the general circulation in the extratropics compared to these large-scale dynamical factors.
For example, dry model simulations successfully capture the mean structure of the extratropical precipitation as a result of passive tracer transports by large-scale flow24. From this
perspective, our findings indicate that not only the storm location and amplitude, but also the dynamics of the horizontal eddy tilt need to be considered to improve weather prediction and
climate projection of the location and intensity of extratropical precipitation in a warmer climate. METHODS A) PRECIPITATION AND REANALYSIS DATA We use daily precipitation rate from the
Global Precipitation Climatology Project version 3.2 (GPCPv3.2)25, which can be downloaded from NASA’s Goddard Earth Sciences Data and Information Services Center
(https://www.earthdata.nasa.gov/eosdis/daacs/gesdisc). The dataset is constructed by integrating data from multiple sources, including satellite and in-situ observations. It spans from 2000
to 2021 and has a spatial resolution of 0.5° latitude by 0.5° longitude. Here, we focus on 19 boreal winter seasons (December–February, DJF) from December 2002 to February 2021 in the
Northern Hemisphere (20°N to 70°N). To define the eddy momentum flux and storm track indices, we utilize daily data of the fifth generation of the atmospheric reanalysis product from the
European Centre for Medium-Range Weather Forecasts (ERA5)26 for the same 19 boreal winter seasons from December 2002 to February 2021. The data, obtained at six-hour intervals from 00 UTC to
18 UTC from the Copernicus Climate Change Service website (https://cds.climate.copernicus.eu/), is averaged to daily means. B) PRECIPITATION HISTOGRAM The GPCPv3.2 data is degraded to 5°×5°
by converting the precipitation rates into a histogram form. Specifically, each 5° grid cell is constructed with 100 original precipitation rates at 0.5° resolution. Precipitation
categories are defined by the following six logarithmically spaced bins, normalised to the frequency distribution, similar to the approach of Jin et al.27: 0 mm day-1 (i.e., no
precipitation), 0–1.0 mm day-1, 1.0–3.3 mm day-1, 3.3–10 mm day-1, 10–33 mm day-1, and greater than 33 mm day-1. The occurrence frequency of the precipitation categories are used as
independent variables in regression analyses with other time series, such as EMF and storm track indices. We note that GPCPv3.2 has an intrinsic discontinuity in the data due to the launch
of the Global Precipitation Measurement mission (May 2014), particularly over the ocean (Supplementary Fig. 8). To address this issue, the anomalous frequency distributions are obtained
separately, i.e., 12 DJFs (2003 to 2014) and 7 DJFs (2015 to 2021) when performing the regression analysis. C) EDDY MOMENTUM FLUX INDEX, STORM TRACK, AND MOISTURE TRANSPORT To quantify the
strength of the daily eddy momentum flux (EMF;\(\left[{u}^{* }{v}^{* }\right]\)) in the midlatitude, we follow Yoo and Lee15 and construct an EMF index (EMFI) by comparing the daily EMF with
the climatological wintertime EMF in the midlatitude. Here, \(u\) is the zonal wind, \(v\) is the meridional wind, the superscript \(*\) denotes the deviation from the zonal mean, and the
bracket represents the zonal mean. The alignment between the two is assessed by projecting the daily EMF onto the climatological EMF, adjusted by a cosine latitude factor, and averaged over
all DJF seasons (Eq. 12 in Yoo and Lee15). The projection focuses on the region spanning 35°N–55°N and 250–1000 hPa, chosen to capture the peak of DJF EMF convergence between 40°N and 50°N.
The resulting index is then standardized using its mean and standard deviation. We note that, by definition, the EMFI includes contributions from both stationary and transient eddies. The
storm track is defined using the daily 500 hPa geopotential height (z500)9. Originally, Lau9 calculated the storm track activity using the monthly root mean square (RMS) z500 anomalies from
the respective monthly means after applying a 2.5–6-day bandpass filter to bidiurnal data. In this study, we modify the approach as follows: First, the daily 0.25° ERA5 data is coarsened to
5° resolution in the region from 25°N to 70°N (i.e., 9 by 72 grid cells), and 2–6-day bandpass filtered data is obtained by combining a 1-2-1 filter and a Lanczos high-pass filter of 6 days.
Second, the monthly RMS is replaced by the daily RMS based on a rolling mean. Specifically, the daily RMS is computed from a 5-day rolling time window deviated from a 31-day rolling mean,
with the centres of the 5-day and 31-day time windows are aligned on the day the RMS is recorded. These daily RMS values for 90 days, starting on December 1 of each year from 2002 to 2020,
provide 1710 days of data over 19 years. Lastly, a data array of 1710×9×72 is used for the EOF analysis to obtain the leading mode of variability that corresponds to the storm track activity
(Supplementary Fig. 2). The first and second EOF modes explain 16.8% and 10.9% of the storm track variability in the North Pacific, 17.5% and 10.6% in the North Atlantic, and 53.2% and
22.5% in the zonal mean NH, while the contribution of higher order EOFs is negligible (not shown). We use the vertically integrated moisture transport (IVT)28,29,30,31 to quantify the
changes in moisture transport resulting from either the EMFI or the storm track activity. The IVT is usually calculated by summing the product of specific humidity and wind vector from the
surface to the top of the atmosphere (e.g., see Eq. 2 in de Vries32). In this study, the divergence of IVT is computed in similar way: $$\nabla \cdot {\bf{IVT}}=\frac{1}{g}\frac{\partial
}{\partial x}{\int }_{{p}_{{sfc}}}^{{p}_{{top}}}u\,q\,{dp}+\frac{1}{g}\,\frac{\partial }{\partial y}\,{\int }_{{p}_{{sfc}}}^{{p}_{{top}}}v\,q\,{dp},$$ where \(g\) is the gravitational
acceleration, \(q\) is the specific humidity, and \(p\) is the pressure. The pressure at the top of the atmosphere (\({p}_{{top}}\)) is set to the 300 hPa pressure level. D) CALCULATION OF
REGRESSION SLOPES AND THEIR SIGNIFICANCE TEST In this study, regression slopes are calcualated using daily data for 19 DJF seasons (19 years × 90 days per each DJF = 1710 days). The
anomalies of each dependent variable are calculated separately for each DJF season by subtracting the DJF mean, and these anomalies are combined to build an anomaly time series of 1710 days.
This approach helps exclude the effect of interannual variability. Under the assumptions of simple linear regression, the test static for the regression slope is known to follow a
_t_-distribution, which is sensitive to the degrees of freedom. In this study, we employed an estimated effective degrees of freedom derived from the autocorrelation and cross-correlation of
the two timeseries33. In addition, repeated regression analysis for hundreds grid cells can increase the chance of “false positive” error. To minimize this error, we employed modified false
discovery rate (mFDR) approach34. For all figures, the mean explained variance (_R_2) is calculated only for the grid cells identified as significant at 95% confidence level (_p_-value <
0.05; after screened by mFDR method). We note that the absolute _R_2 values are inherently low due to the characteristics of daily precipitation frequency data which often contain many
zeros and ones while intermediate values are few. If the number of significant grid cells are less than or equal to 5, the mean _R_2 is marked as “not available (n/a).” DATA AVAILABILITY The
GPCPv3.2 data is available from NASA's Goddard Earth Sciences Data and Information Services Center
(https://catalog.data.gov/dataset/gpcp-precipitation-level-3-daily-0-5-degree-v3-2-gpcpday-at-ges-disc). ERA5 data are available from the Copernicus Climate Data Store
(https://cds.climate.copernicus.eu/). CODE AVAILABILITY The codes to reproduce the analyses presented in this study are available upon request from the corresponding author. The code to
calculate modified-FDR is downloaded from webpage of Dr. Paciorek (https://www.stat.berkeley.edu/users/paciorek/research/code/code.html). REFERENCES * Catto, J. L., Jakob, C., Berry, G.
& Nicholls, N. Relating global precipitation to atmospheric fronts. _Geophys. Res. Lett._ 39, L10805, https://doi.org/10.1029/2012GL051736 (2012). Article Google Scholar * Hawcroft, M.
K., Shaffrey, L. C., Hodges, K. I. & Dacre, H. F. How much Northern Hemisphere precipitation is associated with extratropical cyclones? _Geophys. Res. Lett_. 39.
https://doi.org/10.1029/2012GL053866 (2012). * Yin, J. H. A consistent poleward shift of the storm tracks in simulations of 21st century climate. _Geophys. Res. Lett_. 32.
https://doi.org/10.1029/2005GL023684 (2005). * Bengtsson, L., Hodges, K. I. & Roeckner, E. Storm Tracks and Climate Change. _J. Climate_ 19, 3518–3543, https://doi.org/10.1175/JCLI3815.1
(2006). Article Google Scholar * Chang, E. K. M., Guo, Y. & Xia, X. CMIP5 multimodel ensemble projection of storm track change under global warming. _J. Geophys. Res. Atmos_. 117.
https://doi.org/10.1029/2012JD018578 (2012). * Ulbrich, U. et al. Changing Northern Hemisphere Storm Tracks in an Ensemble of IPCC Climate Change Simulations. _J. Climate_ 21, 1669–1679,
https://doi.org/10.1175/2007JCLI1992.1 (2008). Article Google Scholar * Besson, P., Fischer, L. J., Schemm, S. & Sprenger, M. A global analysis of the dry-dynamic forcing during
cyclone growth and propagation. _Weather Clim. Dynam._ 2, 991–1009, https://doi.org/10.5194/wcd-2-991-2021 (2021). Article Google Scholar * Blackmon, M. L., Wallace, J. M., Lau, N.-C.
& Mullen, S. L. An Observational Study of the Northern Hemisphere Wintertime Circulation. _J Atmos. Sci._ 34, 1040–1053 (1977). Article Google Scholar * Lau, N.-C. Variability of the
Observed Midlatitude Storm Tracks in Relation to Low-Frequency Changes in the Circulation Pattern. _J. Atmos. Sci._ 45, 2718–2743 (1988). Article Google Scholar * Chang, E. K. M. & Fu,
Y. Interdecadal Variations in Northern Hemisphere Winter Storm Track Intensity. _J. Climate_ 15, 642–658 (2002). Article Google Scholar * Gilet, J.-B., Plu, M. & Rivière, G. Nonlinear
Baroclinic Dynamics of Surface Cyclones Crossing a Zonal Jet. _J. Atmos. Sci._ 66, 3021–3041, https://doi.org/10.1175/2009JAS3086.1 (2009). Article Google Scholar * Tamarin, T. &
Kaspi, Y. The poleward shift of storm tracks under global warming: A Lagrangian perspective. _Geophys. Res. Lett._ 44, 10,666–610,674, https://doi.org/10.1002/2017GL073633 (2017). Article
Google Scholar * Oruba, L., Lapeyre, G. & Rivière, G. On the Poleward Motion of Midlatitude Cyclones in a Baroclinic Meandering Jet. _J. Atmos. Sci._ 70, 2629–2649,
https://doi.org/10.1175/JAS-D-12-0341.1 (2013). Article Google Scholar * Andrews, D. G. & McIntyre, M. E. Planetary Waves in Horizontal and Vertical Shear: The Generalized
Eliassen-Palm Relation and the Mean Zonal Acceleration. _J. Atmos. Sci._ 33, 2031–2048 (1976). Article Google Scholar * Yoo, C. & Lee, S. The precipitation distribution set by eddy
fluxes: the case of boreal winter. _npj Clim. Atmos. Sci_ 6, 24, https://doi.org/10.1038/s41612-023-00356-9 (2023). Article Google Scholar * Thorncroft, C. D., Hoskins, B. J. &
McIntyre, M. E. Two paradigms of baroclinic‐wave life‐cycle behaviour. _Quart. J. Roy. Met. Soc._ 119, 17–55, https://doi.org/10.1002/qj.49711950903 (1993). Article Google Scholar *
Simmons, A. J. & Hoskins, B. J. The Life Cycles of Some Nonlinear Baroclinic Waves. _J. Atmos. Sci._ 35, 414–432 (1978). Article Google Scholar * Wettstein, J. J. & Wallace, J. M.
Observed Patterns of Month-to-Month Storm-Track Variability and Their Relationship to the Background Flow. _J. Atmos. Sci._ 67, 1420–1437, https://doi.org/10.1175/2009jas3194.1 (2010).
Article Google Scholar * Salathé Jr, E. P. Influences of a shift in North Pacific storm tracks on western North American precipitation under global warming. _Geophys. Res. Lett_. 33.
https://doi.org/10.1029/2006GL026882 (2006) * Gao, Y., Lu, J. & Leung, L. R. Uncertainties in Projecting Future Changes in Atmospheric Rivers and Their Impacts on Heavy Precipitation
over Europe. _J. Climate_ 29, 6711–6726, https://doi.org/10.1175/JCLI-D-16-0088.1 (2016). Article Google Scholar * Ma, W., Chen, G. & Guan, B. Poleward Shift of Atmospheric Rivers in
the Southern Hemisphere in Recent Decades. _Geophys. Res. Lett._ 47, e2020GL089934, https://doi.org/10.1029/2020GL089934 (2020). Article Google Scholar * Baggett, C., Lee, S. &
Feldstein, S. An Investigation of the Presence of Atmospheric Rivers over the North Pacific during Planetary-Scale Wave Life Cycles and Their Role in Arctic Warming. _J. Atmos. Sci._ 73,
4329–4347, https://doi.org/10.1175/JAS-D-16-0033.1 (2016). Article Google Scholar * Hoskins, B. J. & Hodges, K. I. New Perspectives on the Northern Hemisphere Winter Storm Tracks. _J.
Atmos. Sci._ 59, 1041–1061 (2002). Article Google Scholar * Ming, Y. & Held, I. M. Modeling Water Vapor and Clouds as Passive Tracers in an Idealized GCM. _J. Climate_ 31, 775–786,
https://doi.org/10.1175/JCLI-D-16-0812.1 (2018). Article Google Scholar * Huffman, G. J. et al. The New Version 3.2 Global Precipitation Climatology Project (GPCP) Monthly and Daily
Precipitation Products. _J. Climate_ 36, 7635–7655, https://doi.org/10.1175/JCLI-D-23-0123.1 (2023). Article Google Scholar * Hersbach, H. et al. The ERA5 global reanalysis. _Quart. J.
Roy. Met. Soc._ 146, 1999–2049, https://doi.org/10.1002/qj.3803 (2020). Article Google Scholar * Jin, D., Oreopoulos, L., Lee, D., Cho, N. & Tan, J. Contrasting the co-variability of
daytime cloud and precipitation over tropical land and ocean. _Atmos. Chem. Phys._ 18, 3065–3082, https://doi.org/10.5194/acp-18-3065-2018 (2018). Article CAS Google Scholar * Ralph, F.
M. et al. Flooding on California’s Russian River: Role of atmospheric rivers. _Geophys. Res. Lett_. 33. https://doi.org/10.1029/2006GL026689 (2006) * Rutz, J. J., Steenburgh, W. J. &
Ralph, F. M. Climatological Characteristics of Atmospheric Rivers and Their Inland Penetration over the Western United States. _Mon. Wea. Rev._ 142, 905–921,
https://doi.org/10.1175/MWR-D-13-00168.1 (2014). Article Google Scholar * Ralph, F. M. et al. Dropsonde Observations of Total Integrated Water Vapor Transport within North Pacific
Atmospheric Rivers. _J. Hydrometeor._ 18, 2577–2596, https://doi.org/10.1175/JHM-D-17-0036.1 (2017). Article Google Scholar * Dorff, H., Konow, H., Schemann, V. & Ament, F.
Observability of moisture transport divergence in Arctic atmospheric rivers by dropsondes. _Atmos. Chem. Phys._ 24, 8771–8795, https://doi.org/10.5194/acp-24-8771-2024 (2024). Article CAS
Google Scholar * De Vries, A. J. A global climatological perspective on the importance of Rossby wave breaking and intense moisture transport for extreme precipitation events. _Weather
Clim. Dynam._ 2, 129–161, https://doi.org/10.5194/wcd-2-129-2021 (2021). Article Google Scholar * Afyouni, S., Smith, S. M. & Nichols, T. E. Effective degrees of freedom of the
Pearson’s correlation coefficient under autocorrelation. _NeuroImage_ 199, 609–625, https://doi.org/10.1016/j.neuroimage.2019.05.011 (2019). Article Google Scholar * Ventura, V., Paciorek,
C. J. & Risbey, J. S. Controlling the Proportion of Falsely Rejected Hypotheses when Conducting Multiple Tests with Climatological Data. _J. Climate_ 17, 4343–4356,
https://doi.org/10.1175/3199.1 (2004). Article Google Scholar Download references ACKNOWLEDGEMENTS C.Y. and S.L. were supported by the National Research Foundation of Korea through grant
RS-2023-00219006. C.Y. was also supported by the National Research Foundation of Korea through grant RS-2024-00333469 and by the Specialized University Program for Confluence Analysis of
Weather and Climate Data of the Korea Meteorological Institute. S.L. also acknowledges support by U.S. National Science Foundation AGS-2343772. AUTHOR INFORMATION AUTHORS AND AFFILIATIONS *
Department of Climate and Energy Systems Engineering, Ewha Womans University, Seoul, Republic of Korea Changhyun Yoo * GESTAR-II, University of Maryland, Baltimore County, Baltimore, MD, USA
Daeho Jin * Earth Sciences Division, NASA’s Goddard Space Flight Center, Greenbelt, MD, USA Daeho Jin * Department of Meteorology and Atmospheric Science, The Pennsylvania State University,
University Park, PA, USA Sukyoung Lee * School of Earth and Environmental Sciences, Seoul National University, Seoul, Republic of Korea Daehyun Kim Authors * Changhyun Yoo View author
publications You can also search for this author inPubMed Google Scholar * Daeho Jin View author publications You can also search for this author inPubMed Google Scholar * Sukyoung Lee View
author publications You can also search for this author inPubMed Google Scholar * Daehyun Kim View author publications You can also search for this author inPubMed Google Scholar
CONTRIBUTIONS S.L. and C.Y. conceived the idea. D.J. conducted data analysis and produced the figures. C.Y. drafted the manuscript and contributed to data analysis. All authors contributed
to the writing and editing. CORRESPONDING AUTHOR Correspondence to Changhyun Yoo. ETHICS DECLARATIONS COMPETING INTERESTS The authors declare no competing interests. ADDITIONAL INFORMATION
PUBLISHER’S NOTE Springer Nature remains neutral with regard to jurisdictional claims in published maps and institutional affiliations. SUPPLEMENTARY INFORMATION SUPPLEMENTARY INFORMATION
RIGHTS AND PERMISSIONS OPEN ACCESS This article is licensed under a Creative Commons Attribution-NonCommercial-NoDerivatives 4.0 International License, which permits any non-commercial use,
sharing, distribution and reproduction in any medium or format, as long as you give appropriate credit to the original author(s) and the source, provide a link to the Creative Commons
licence, and indicate if you modified the licensed material. You do not have permission under this licence to share adapted material derived from this article or parts of it. The images or
other third party material in this article are included in the article’s Creative Commons licence, unless indicated otherwise in a credit line to the material. If material is not included in
the article’s Creative Commons licence and your intended use is not permitted by statutory regulation or exceeds the permitted use, you will need to obtain permission directly from the
copyright holder. To view a copy of this licence, visit http://creativecommons.org/licenses/by-nc-nd/4.0/. Reprints and permissions ABOUT THIS ARTICLE CITE THIS ARTICLE Yoo, C., Jin, D.,
Lee, S. _et al._ A comparison of the meridional meandering of extratropical precipitation during boreal winter: eddy momentum flux versus Eulerian storm tracks. _npj Clim Atmos Sci_ 8, 104
(2025). https://doi.org/10.1038/s41612-025-00992-3 Download citation * Received: 10 October 2024 * Accepted: 04 March 2025 * Published: 13 March 2025 * DOI:
https://doi.org/10.1038/s41612-025-00992-3 SHARE THIS ARTICLE Anyone you share the following link with will be able to read this content: Get shareable link Sorry, a shareable link is not
currently available for this article. Copy to clipboard Provided by the Springer Nature SharedIt content-sharing initiative