Divergent effects of temperature and precipitation on water flow into the largest lake on the tibetan plateau
- Select a language for the TTS:
- UK English Female
- UK English Male
- US English Female
- US English Male
- Australian Female
- Australian Male
- Language selected: (auto detect) - EN
Play all audios:

ABSTRACT The majority of lakes on the TP have expanded in an accelerated manner, changing the regulation of local water cycles and ecosystems. Here, spatiotemporal changes in inflow to Selin
Co (the largest lake on the TP) from 1979 to 2022 were modeled, and the impacts of warming and wetting on water volume were explored. The modeled annual mean lake inflow was 2.27 km3,
accompanied by a significant growth trend of 0.035 km3/yr (_p_ < 0.01, the contributions of warming and wetting are −0.016 and 0.048 km3/yr respectively). Warming (+0.0386 K/yr) caused a
decrease of 0.33 km3 in lake inflow per year, accounting for 14.5% of the annual mean water volume, while wetting (+4.46 mm/yr) caused an increase of 0.91 km3 in lake inflow per year,
accounting for 40% of the annual mean value. These divergent effects of increasing temperature and precipitation on lake inflow makes it more difficult to predict the future water resources
of basins such as Selin Co. SIMILAR CONTENT BEING VIEWED BY OTHERS STRENGTHENING OF THE HYDROLOGICAL CYCLE IN THE LAKE CHAD BASIN UNDER CURRENT CLIMATE CHANGE Article Open access 20 October
2024 EMERGENCE OF LAKE CONDITIONS THAT EXCEED NATURAL TEMPERATURE VARIABILITY Article Open access 12 July 2024 IMPORTANCE OF FLUVIAL INFLOWS IN THE INTRA-LAKE HETEROGENEITY OF SURFACE WATER
TEMPERATURES ON THE TIBETAN PLATEAU Article Open access 24 May 2025 INTRODUCTION Lakes are crucial water resources for aquatic and terrestrial ecosystems, agriculture, and industry; they
also mediate the exchange of heat and water with the atmosphere1,2. With ongoing climate change and increasing human activity in recent decades, many large lakes have experienced substantial
change3. For example, in China, both the number and area of lakes on the Tibetan Plateau (TP) have shown increasing trends, in contrast to the shrinkage of lakes on the Inner-Mongolia
Plateau and eastern plains of China4,5,6. The expansion of lakes plays an important role in regulating regional water cycles and ecosystems, and greatly affects the productivity and
livelihood of local people7,8. Thus, timely monitoring of lake dynamics is crucial for assessing regional water resources availability, projecting future water stress, and formulating
sustainable development strategies9. The TP is the highest plateau in the world, with an average elevation exceeding 4000 m and an area of approximately 2.5 × 10⁶ km210. The TP has undergone
considerable warming during recent decades, with the magnitude of TP climate warming being larger than that of average Northern Hemisphere or global warming11. Precipitation on the TP has
slightly increased over this period, with a complex spatial pattern, but the increase has not been as pronounced as that of temperature. The whole TP shows a uniform warming trend, ranging
from 0.16 to 0.67 °C decade-1 since the 1950s12,13. Overall, the annual precipitation is increasing in most areas of the TP except eastern and southeastern parts14. Selin Co (Fig. 1) is an
endorheic lake located on the central TP; it has markedly expanded over recent decades owing to increased precipitation and cryospheric meltwater, accompanied by decreased water surface
evaporation, and has been the largest endorheic lake on the TP since 200315,16,17. Climate change profoundly alters the water cycle (Liu et al. 2018), while traditional station observations
are insufficient to fully reveal this impact. Hydrological models, either physically-based or data-driven, are fundamental tools for quantitatively simulating and analyzing hydrological
processes18. High-resolution hydrological models can facilitate in-depth research on the evolution of water volume19,20. Based on these advantages, numerous studies have explored changes in
different components of the water cycle in mountainous regions21, semi-arid river basins22, and precipitation-dominated river basins23. For example, changes in river streamflow in the upper
Brahmaputra have been shown to be more sensitive to changes in precipitation than to changes in temperature24. As the largest river on the TP, its response to climate change can provide
reference for the study of other major rivers. As a comparison, the hydrological response of the largest lake basin should also be clarified. However, present research on the Selin Co basin
is mostly limited to remote-sensing monitoring and estimation via empirical formulae25,26,27, making it difficult to determine the water resources status of the entire basin. The impact of
climate change on lake inflow patterns remains poorly understood, especially from the perspective of long-term quantitative analysis. Although changes in temperature and precipitation across
the TP have been discussed previously (e.g., see ref. 28), we are not aware of any published studies that have attempted to separate the interactions of temperature and precipitation and
quantify their respective impacts on the spatiotemporal distribution of lake inflow in the Selin Co basin. To address this knowledge gap, we here investigate the spatiotemporal variation in
lake inflow patterns of Selin Co. A state-of-the-art physical process-based model (water- and energy-budget distributed hydrological model (WEB-DHM)) is applied to study the responses of
lake inflow to changes in climate variables. Our specific objectives are to: (1) conduct a comprehensive investigation of the spatiotemporal variations in annual and seasonal lake inflow
patterns during the period 1979‒2022 in response to warming and humidification on the TP; (2) quantify the impacts of climate change on lake inflow patterns and explore the underlying
mechanisms. We find that increases in temperature and precipitation have contrasting hydrological effects in this region, meaning that warming reduces water volume, while wetting increases
water volume. This divergent effect poses a challenge to future water resources management. RESULTS EVALUATION OF THE WEB-DHM FOR WATER FLOW INTO THE LAKE AND ENERGY BUDGET We calibrated the
WEB-DHM using the observed discharge at gauge A from May to October, 2013 (Fig. 2). At the daily scale, the model accurately reproduced changes in discharge. The Nash‒Sutcliffe efficiency
(_NSE_), mean bias error (_MBE_), and root-mean-square error (_RMSE_) were 0.865, −0.314 m3/s, and 25.7 m3/s, respectively. Ideal model performance is achieved when the _NSE_ is close to 1
and the _MBE_ and _RMSE_ are close to 0. Therefore, the model showed good simulation performance for historical water volume, laying the foundation for the subsequent analysis of water
volume in the entire basin. Owing to the short time series of observed discharge, we further assessed the simulation performance of land surface temperature (LST) to determine whether the
model produced good results for both the water and energy budget. The LST is a key parameter in land‒atmosphere interactions because it is the main factor controlling the sensible and latent
heat fluxes between the land surface and the atmosphere29. Assessment of the LST can be used to evaluate model performance in representing basin-wide energy processes. We compared the
simulated LST with moderate-resolution imaging spectroradiometer (MODIS) LST over the period 2001‒2018 (Figs. 3, 4). The MODIS LST data were derived from the Terra sensor, and included both
the daytime (10:30) and nighttime (22:30) temperature. The comparison showed that the correlation coefficient (_R_), _MBE_, and _RMSE_ values were 0.845, 3.79 K, and 5.96 K, respectively,
for daytime, and 0.919, 3.34 K, and 4.70 K, respectively, for nighttime. Daytime LST is largely controlled by the amount of solar radiation absorbed by the land surface, which results in
large uncertainties when modeling daytime LST (Xue et al. 2013), especially in summer. In contrast, nighttime LST is mainly influenced by downward longwave radiation, since solar radiation
can be neglected. Hence, the simulation of nighttime LST is more accurate. Figure 3 indicates good model performance in reproducing basin-average LST, capturing both intra-annual and
inter-annual fluctuations sufficiently well, with only slight overestimations. In addition to accurately simulating basin-average LST, it is also necessary to ensure that the spatial
distribution of temperature is accurate. Figure 4 shows the multi-year-mean and seasonal spatial distributions of LST during the period 2001‒2018. The overall average MODIS LST in this basin
during this period was very low (274.5 K), with a spatial pattern of higher in the middle of the basin and lower on both sides, mainly owing to differences in altitude. The simulated LST
values showed the best agreement with MODIS LST data in autumn, with a slight overestimation of +2.77 K, followed by winter (+3.56 K), summer (+3.84 K), and spring (+4.29 K). We infer that
these minor errors mainly come from uncertainties in the long- and short-wave radiation and air temperature inputs of the model, because the meteorological forcing data were generated based
on an insufficient number (only three) of meteorological stations in this basin. The temporal matching of LST could also be a reason for these differences, because the model cannot directly
generate temperatures at exactly 10:30 and 22:30. Overall, the model simulated the spatial pattern of LST well and showed a good simulation performance in terms of the regional energy budget
(for most of the time and most areas). SPATIOTEMPORAL VARIATIONS IN WATER FLOW INTO SELIN CO Using simulated discharge data from four gauges (A‒D shown in Fig. 1), we found that water flow
into Selin Co has increased at a rate of 0.035 km3/yr (_p_ < 0.01) over the past 40 years (Fig. 5a). Lake inflow has increased with different rates at the different gauge locations
(+0.011, +0.0056, +0.017, and +0.0019 km3/yr for gauges A, B, C, and D, respectively). The total annual mean lake inflow over the study period was 2.27 km3, comprising 1.29 km3 at gauge A,
0.23 km3 at gauge B, 0.66 km3 at gauge C, and 0.09 km3 at gauge D. In other words, the water volume recorded at gauge A was the highest (Fig. 5b1), while the rate of increase recorded at
gauge C was the fastest (Fig. 5b2). The rapid increase in lake inflow in recent years (including a notable total inflow of almost 7 km3 in 2022) has undoubtedly contributed to the expansion
of the lake. Although this region is located in the hinterland of the TP and receives relatively little water vapor from the Indian and East Asian monsoons, lake inflow is still concentrated
in July‒September, accounting for 57% of the annual total (Fig. 5c1). This phenomenon of uneven water distribution is more pronounced (almost 70% of the annual total concentrated in
July‒September) in the western part of the basin, where gauges B and C are located. Considering the uneven distribution of annual lake inflow, we explored the annual water volume and its
respective proportions at the four gauges on a seasonal scale (Fig. 6). On average, the total lake inflow reached its maximum value (1.14 km3) in summer, followed by autumn (0.61 km3),
spring (0.27 km3), and winter (0.24 km3). The proportions of the total lake inflow recorded at gauges B and D remained relatively stable, at < 15% and < 5%, respectively. Regardless of
the season, gauge A contributed the greatest proportion of the total lake inflow; however, this contribution has continuously decreased over the past 40 years (except in summer), and in
contrast, the role of gauge C has become increasingly important. In the summer of some years (e.g., 2001, 2008, and 2017), the water volume recorded by gauge C exceeded that of A. This
regional transformation of lake inflow, related to faster evapotranspiration decline in the southern part of the basin30, will likely have a substantial impact on the hydrological cycle of
the basin. The degradation of seasonally frozen ground widely distributed at the catchment controlled by gauge C also contributes to runoff. The catchment associated with gauge C is
connected to a number of small lakes through various river tributaries (Fig. 1a), and this may become the largest source of inflow into Selin Co in the future. IMPACT OF CONTINUOUSLY
INCREASING TEMPERATURE AND PRECIPITATION ON LAKE INFLOW Lakes on the TP are relatively little affected by human activity, thus any changes are mainly the result of climate change31. Hence,
it is of great importance to reveal the characteristics and causes of changing lake inflow patterns over recent decades; this can provide a reference for studying environmental evolution on
the TP, and a guide for regional water resources management. The sensitivity experiment designed herein separated the effects of temperature and precipitation, as well as their interactions
(Fig. 7). Over the past 40 years, increases in temperature have consistently weakened lake inflow in the study basin, and this effect continues to amplify (Fig. 7a1). Between 1979 and 1997,
the increase in temperature (+0.3 K) caused an annual decrease of 0.11 km3 in lake inflow, accounting for 6.5% of the total annual water volume. However, as warming intensified during the
period 1998‒2022 ( + 1.4 K), the weakening effect on lake inflow increased to 0.5 km3 per year, accounting for 18.5% of the annual average water volume (Fig. 7b1). Continuous warming leads
to cryospheric melting, including accelerated glacier retreat and ice loss32, a lower snowline33, permafrost thawing and degradation34,35, and snowmelt36, which feeds additional water to
alpine rivers and lakes. However, these promoting effects on lake inflow are offset by increased evapotranspiration; spatially, annual evapotranspiration has shown an increasing trend over
most parts of the TP in recent decades37. In contrast to the effect of temperature, rises in precipitation have increased the overall water volume in the study basin, especially since 1998
(Fig. 7a2). Between 1979 and 1997, the increase in precipitation (+72 mm) caused slight fluctuations in lake inflow, with an average annual increase of only 0.17 km3. Since 1998, there has
been a remarkable accelerating effect, during which time, the increase in precipitation has increased the average annual lake inflow by 1.47 km3, this being more than eight times the
increase observed between 1979 and 1997 (Fig. 7b2). Many studies have found that precipitation on the TP has increased dramatically since 19984,10,28; herein, we have shown that most of this
increased precipitation has been converted into increases in runoff and water storage in rivers and lakes, rather than being evaporated. We further explored the combined and interactive
effects of temperature and precipitation on lake inflow. The combined contrasting effects of temperature and precipitation resulted in the water volume remaining relatively stable from 1979
to 1997; thereafter, the effect of precipitation outweighed that of temperature (Fig. 7a3). For example, the combined effect at gauge A was reversed from reducing to enhancing inflow (Fig.
7b3). In some typical drought years (e.g., 2015 and 2020), high temperatures still played a dominant role, leading to a decrease in lake-water volume (Fig. 7a3). It is also necessary to
investigate and separate-out the impact of the interaction between temperature and precipitation on water volume, as they may have a mutual influence. During recent decades, the atmospheric
water vapor supply to the TP has shown an increasing trend under global warming conditions, increasing both water vapor content and precipitation on the TP38. Precipitable water in the
atmosphere above the TP has increased markedly since the 1990s, especially in summer11. In turn, an increase in precipitation has a cooling effect on the air. Compared with the individual
and combined effects of temperature and precipitation, the impact of this interaction on lake inflow was relatively weak, although there has been a transition from a small reducing effect
(−0.06 km3; 1979‒1997) to a small enhancing effect (+0.04 km3; 1998‒2022) (Fig. 7a4, b4). Figure 8 presents the impacts of climate variables on monthly water volume at different gauges over
the periods 1979‒1997 and 1998‒2022. The weakening effect of warming on water volume in different months and at different locations across the basin was consistent and began to amplify after
1998. From 1979 to 1997, in some areas, around May, warming brought a small increase in water volume, possibly owing to an increase in meltwater. Compared with temperature, the impact of
precipitation exhibited markedly greater spatiotemporal heterogeneity. The promoting effect of precipitation on lake inflow was concentrated in July in the northern part of the basin (gauge
A), while in other areas it was concentrated in September. Different water resources management strategies can be developed for different regions based on this temporal difference. The
combined effect (Exp. 0 – Exp. 3) was similar to the effect of precipitation alone (Exp. 0 – Exp. 2), but some dry months with high temperature differ from this trend. As mentioned earlier,
the interaction between temperature and precipitation had little impact at the scale of the entire basin, but differences were evident at different locations (e.g., gauge A vs. gauge C). The
interaction reduced the water volume at gauge A, but increased it at gauge C, especially in August and September. Previous studies have shown that climate change on the TP has a substantial
impact on hydrological processes and the water cycle39,40,41. The divergent effects of temperature and precipitation on water resources reported herein makes it more difficult to predict
future water volumes in TP lake basins. DISCUSSION In this study, we found that the growth trend of total lake inflow is 0.035 km3/yr, while the same trend is 0.036 km3/yr for Zhou et al.16
and 0.066 km3/yr for Tong et al.8. The contributions of warming and wetting to the growth trend are −0.016 and 0.048 km3/yr respectively. Different watershed divisions and research periods
have led to different results. Lei et al.4 found that the growth rate of lake water storage was 0.57 km3/yr over 1970–2010, indicating that the increase in lake inflow contributed 6%.
Therefore, our research indirectly proves that the increase in precipitation and the decrease in evaporation over lake surface dominate the expansion of Selin Co. It is the most impressive
that we discovered divergent effects of temperature and precipitation on lake inflow patterns. Warming reduced the volume of water in the basin, while humidification increased lake inflow
(Fig. 7). By comparison, in the upper Brahmaputra basin, the role of warming has changed from increasing to reducing the water volume42, reflecting the spatial heterogeneity of the impact of
climate variables on the TP. The water volume of small rivers in lake basins is more easily weakened by warming accompanied by an increase in total evapotranspiration (Fig. 9a). As air
temperature was the dominant factor affecting frozen ground, the weakening effect of warming on water volume can be explained to some extent by the hydrological effects of permafrost
degradation42. Permafrost degradation increases hydraulic connectivity and enhances infiltration, leading to less runoff. The thickening of the active layer increases the soil storage
capacity, which is also found in Heihe river and Three-river headwaters region43,44,45. Meanwhile, in Selin Co, rapid lake expansion in the 2000s mostly resulted from an increase in
precipitation-induced runoff8. We did not separate the specific contributions of precipitation, snowmelt, and glacier meltwater to runoff, but we also found that the increase in
precipitation comprehensively promoted lake inflow after 1998 (Fig. 7b2). Although an increase in precipitation will lead to more evapotranspiration (Fig. 9b), precipitation itself is much
greater than evapotranspiration, so the runoff into the lake will increase. Lake expansion leads to changes in lake morphology, geomorphology, and the hydrological connection between rivers
and lakes, as well as exerting a profound influence on residential habitats and infrastructure46. Because river‒lake interaction is not currently reflected in the WEB-DHM, we used the
discharges at four gauges to estimate the lake inflow during the period 1979‒2022. This may result in uncertainties in total lake inflow values because river‒lake interaction varies each
year according to the interaction of precipitation, glaciers, snow, and frozen soil within the basin. Thus, total lake inflow values may be overestimated or underestimated in a given year.
Meanwhile, the limited streamflow data used to calibrate the WEB-DHM may also result in uncertainties in the calculated lake inflow values. In this study, we used daily streamflow data with
a temporal span of < 1 year (May‒October, 2013) to calibrate the model. The quantity and quality of streamflow data can markedly influence parameter calibration, and thus, model
robustness47. Hence, we further validated the performance of the model in simulating LST. In the future, additional observed streamflow data from the outlet of each sub-basin should be
collected to help improve the representativeness of model parameters. In terms of model parameters, climate and vegetation change might alter the properties of vegetation, soil, and routine
ability, which means the parameters should have changed over time within the model48,49. A number of future research perspectives are here proposed to improve our understanding of the ways
in which lake inflow responds to climate change, as well as the ecological and climatic implications. More effort is required in developing high-quality climate-variable products, through
systematically expanding multi-scale observational networks via the integration of in-situ observations and multi-source remote-sensing and reanalysis products50,51, especially in the
hinterland of the TP. For example, there are currently only three national meteorological stations in or near the Selin Co basin, which is insufficient to ensure the accuracy of forcing
data. The automatic weather station (AWS) installed by our team is far from sufficient. Moreover, our simulation experiments suggest that precipitation currently plays the dominant role in
enhancing water volume, while warming continues to reduce lake inflow. Warming is projected to continue throughout the 21st century28. Therefore, more work is required to determine whether
the effect of warming will ultimately outweigh that of precipitation, leading to a decrease in water volume. In addition, the majority of existing hydrological and land-surface models
require improvement in terms of their physical processes16, especially in the cryospheric environment. The accumulation and ablation of snow, the advance and retreat of glaciers, and the
formation and degradation of frozen ground are common processes on the TP52, although glaciers account for < 1% of the total area of Selin Co basin. In summary, this study focused on
spatiotemporal variations in lake inflow in the largest lacustrine basin on the TP and explored the effects of different climate variables on water volume. Our specific findings were as
follows: (1) The WEB-DHM accurately reproduced water and energy processes within Selin Co basin. (2) The mean annual water flow into Selin Co over the study period was 2.27 km3, with a
significant increase at a rate of 0.035 km3/yr (_p_ < 0.01) over the past 40 years. The sub-basin associated with gauge A has historically been, and continues to be, the most important
source of lake inflow, while the role of the sub-basin associated with gauge C is predicted to become increasingly important in the future. (3) The divergent effects of increasing
temperature and precipitation on lake inflow (reducing vs. increasing) mean that it will be more difficult to predict future lacustrine-basin water volumes. Meanwhile, the interaction
between temperature and precipitation had only a weak impact in this basin, but there is a completely opposite spatial pattern (Figs. 7, 8). The interaction reduced the water volume at gauge
A, but increased it at gauge C. These findings help to improve our knowledge of the impact of climate variables on water cycles, and inform the planning of reasonable measures that will
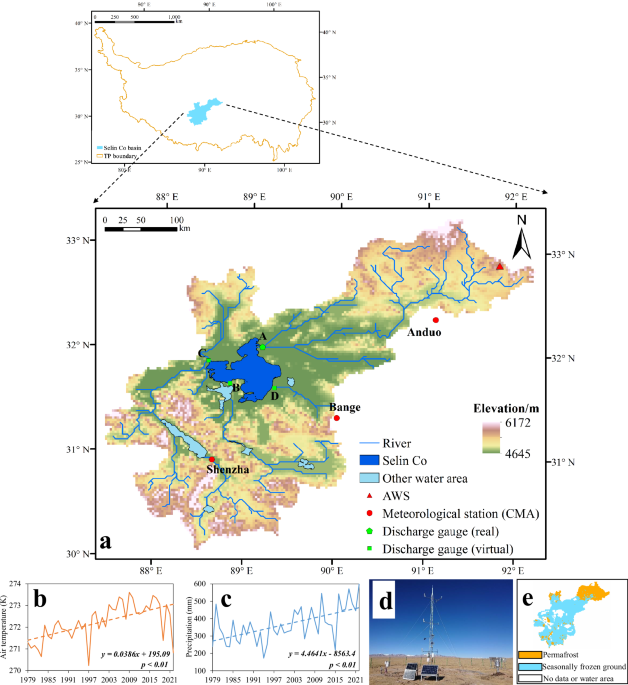
promote sustainable water resources and ecosystem management in watersheds of cold regions. METHODS STUDY AREA The Selin Co basin covers an area of approximately 6.4 × 10⁴ km2, with an
average elevation exceeding 5000 m (Fig. 1a). The high altitude causes the annual average temperature in the basin to be consistently below freezing point, accompanied by a marked increasing
trend over recent decades (0.0386 K/yr) (Fig. 1b). Owing to its location in the hinterland of the TP, the climatic environment of this basin is mainly controlled by local atmospheric
circulation patterns, with the influence of external atmospheric circulations, such as the westerlies, East Asian monsoon, and Indian monsoon, being relatively weak. The annual mean
precipitation is characterized by an increasing trend of 4.46 mm/yr over recent decades, with a basin-averaged precipitation of ~367 mm (Fig. 1c). During the past four decades, rapid
increases in water level and volume have made Selin Co the largest lake on the TP53,54. Several major rivers flow into the lake from different locations, and the discharge gauges A, B, C,
and D can be used to reflect their water volumes (Fig. 1a). Permafrost (27.4%) occurs in the northern part of the basin where surface elevation is high, whereas seasonally frozen ground
(72.6%) is found in the lower altitude, central and southern parts of the domain (Fig. 1e55). The two sub-basins where A and C are located contribute the vast majority of the surface runoff
in the entire basin. Although they have similar areas, the former has the largest amount of permafrost, while the latter has the largest amount of seasonally frozen ground. As a result, the
water volume in these two sub-basins responds differently to warming and wetting. Glacierized area accounts for around 0.5% of the whole basin8,16. DATA The datasets utilized in this study
included basic geographic, remote sensing, meteorological forcing, and land surface observation data for the basin. These datasets were employed to construct and drive our hydrological
model, and to calibrate and evaluate the performance of the model. All data mentioned above were processed to a resolution of 2.5 km to match our model. The detailed information is as
follows. A Shuttle Radar Topography Mission digital elevation model was used for basin delineation and the generation of slope angle, slope length, and bed slope. The basin was divided into
nine primary-level sub-basins. One of these sub-basins was further divided into nine secondary-level sub-basins, resulting in seventeen sub-basins in total. Land-use data were derived from
the United States Geological Survey using the Simple Biosphere 2 (SiB2) model legend56. This basin only contains four types of land use, with agriculture/C3 grassland accounting for the
largest proportion (42.7%). According to the digital soil map of the world compiled by the Food and Agriculture Organization of the United Nations, there are five types of soil units in this
basin, each having variable hydraulic properties; these hydraulic properties include hydraulic conductivity, saturated moisture content, residual moisture content, and soil anisotropy
ratio. Lithosols (I-Y-2c) are the dominant soil type (36.5%). The leaf area index and fraction of photosynthetically active radiation from Global Land Surface Satellite datasets57 were used
to describe dynamic changes in vegetation at a temporal resolution of 8 days. In addition, we evaluated the simulation performance of our model for the basin-wide energy budget using LST
data from MODIS. Meteorological forcing data were sourced from the China meteorological forcing dataset (1979‒2018) developed by He et al.58 and meteorological forcing dataset for the Third
Pole (2019‒2022) developed by Jiang et al.59, which have both shown good applicability on the TP. These datasets include seven variables: wind speed, air temperature, specific humidity, air
pressure, precipitation, downward shortwave radiation, and downward longwave radiation; they were corrected using observational data from three stations of the China Meteorological
Administration and one AWS (Fig. 1). MODEL DESCRIPTION We used the WEB-DHM, fully coupled to a biosphere scheme (SiB256;) and accompanied by a geomorphology-based hydrological model60, to
simulate water flow into Selin Co, analyze spatiotemporal changes in water volume, and explore the impact of temperature and precipitation. In the model setup, a total of 10,209 grids (2.5 ×
2.5 km) were generated for the entire basin. We considered the empirical frozen-ground parameterization61 and three-layer snow scheme62 to accurately characterize cryospheric processes on
the TP. The model employs enthalpy instead of the soil/snow temperature as a forecasting variable to decrease the uncertainty in the release of latent heat caused by water phase changes63.
By using enthalpy as a prognostic variable, the model can overcome inaccuracies and discontinuities caused by the ice‒water phase transition in the traditional soil temperature approach64,
thus making our simulation of a high-altitude basin more reliable. During the model warm-up phase, we ran the model with default soil parameters until the soil state reached stability. At
this point, the model would derive the temperature difference between the air temperature and the soil potential temperature over land. Subsequently, using this stable soil state as the
initial condition, we carried out a formal simulation. In this stage, the LST at each moment was calculated by adding the air temperature to the temperature difference obtained previously.
For more detailed information on the specific algorithms, parameter calibration, and application of the model in simulating river or lake hydrology in cold regions, please refer to our
previous work23,52,65,66,67,68. EXPERIMENTAL DESIGN We calibrated the model using the observed runoff at gauge A, and then set up additional virtual gauges (B‒D). We integrated the runoff
from these gauges to illustrate spatiotemporal changes in the amount of water entering the lake over the period 1979‒2022. To unravel the influences of climate change on lake water volume,
we designed four experiments (Exp. 0 to Exp. 3) using the control variate method (Table 1). DATA AVAILABILITY The DEM and MODIS LST data was provided by NASA (http://srtm.csi.cgiar.org/ and
https://ladsweb.modaps.eosdis.nasa.gov/search/). The land use data can be downloaded from https://www.usgs.gov/media/images/eurasia-landcover-characteristics-data-base-version-20. The soil
data can be downloaded from http://www.fao.org/geonetwork/srv/en/metadata.show?id=14116. The vegetation data (LAI/FPAR) can be downloaded from http://www.geodata.cn/thematicView/GLASS.html.
The meteorological forcing data can be downloaded from https://doi.org/10.11888/AtmosphericPhysics.tpe.249369.file. and https://doi.org/10.11888/Atmos.tpdc.300398. Any other observation data
used in this study are available from the corresponding author on reasonable request. REFERENCES * Krinner, G. Impact of lakes and wetlands on boreal climate. _J. Geophys. Res._ 108, 4520
(2003). Google Scholar * Zhang, G. et al. Response of Tibetan Plateau lakes to climate change: Trends, patterns, and mechanisms. _Earth-Sci. Rev._ 208, 103269 (2020). Article Google
Scholar * Cheng, J. et al. Regional assessment of the potential risks of rapid lake expansion impacting on the Tibetan human living environment. _Environ. Earth Sci._ 80, 166 (2021).
Article Google Scholar * Lei, Y. et al. Coherent lake growth on the central Tibetan Plateau since the 1970s: Characterization and attribution. _J. Hydrol._ 483, 61–67 (2013). Article
Google Scholar * Ma, R. et al. A half-century of changes in China’s lakes: Global warming or human influence?. _Geophys. Res. Lett._ 37, L24106 (2010). Article Google Scholar * Song, C.,
Huang, B. & Ke, L. Inter-annual changes of alpine inland lake water storage on the Tibetan Plateau: Detection and analysis by integrating satellite altimetry and optical imagery.
_Hydrol. Process._ 28, 2411–2418 (2014). Article Google Scholar * Liao, J., Shen, G. & Li, Y. Lake variations in response to climate change in the Tibetan Plateau in the past 40 years.
_Int. J. Digit. Earth._ 6, 534–549 (2013). Article Google Scholar * Tong, K., Su, F. & Xu, B. Quantifying the contribution of glacier meltwater in the expansion of the largest lake in
Tibet. _J. Geophys. Res. -Atmos._ 121, 11158–11173 (2016). Article Google Scholar * van Beek, L. P. H., Wada, Y. & Bierkens, M. F. P. Global monthly water stress: 1. Water balance and
water availability. _Water Resour. Res._ 47, W07517 (2011). Google Scholar * Yang, K. et al. Recent climate changes over the Tibetan Plateau and their impacts on energy and water cycle: A
review. _Glob. Planet. Change_ 112, 79–91 (2014). Article Google Scholar * Zhang, D., Huang, J., Guan, X., Chen, B. & Zhang, L. Long-term trends of precipitable water and precipitation
over the Tibetan Plateau derived from satellite and surface measurements. _J. Quant. Spectrosc. Ra._ 122, 64–71 (2013). Article CAS Google Scholar * Gao, Y., Li, X., Leung, L. R., Chen,
D. & Xu, J. Aridity changes in the Tibetan Plateau in a warming climate. _Environ. Res. Lett._ 10, 034013 (2015). Article Google Scholar * You, Q., Min, J. & Kang, S. Rapid warming
in the Tibetan Plateau from observations and CMIP5 models in recent decades. _Int. J. Climatol._ 36, 2660–2670 (2015). Article Google Scholar * Tong, K., Su, F., Yang, D., Zhang, L. &
Hao, Z. Tibetan Plateau precipitation as depicted by gauge observations, reanalyses and satellite retrievals. _Int. J. Climatol._ 34, 265–285 (2014). Article Google Scholar * Zhang, Y.,
Yao, T. & Ma, Y. Climatic changes have led to significant expansion of endorheic lakes in Xizang (Tibet) since 1995. _Sci. Cold Arid Reg._ 3, 463–467 (2011). Google Scholar * Zhou, J.
et al. Exploring the water storage changes in the largest lake (Selin Co) over the Tibetan Plateau during 2003-2012 from a basin-wide hydrological modeling. _Water Resour. Res._ 51,
8060–8086 (2015). Article Google Scholar * Guo, Y., Zhang, Y., Ma, N., Xu, J. & Zhang, T. Long-term changes in evaporation over Siling Co Lake on the Tibetan Plateau and its impact on
recent rapid lake expansion. _Atmos. Res._ 216, 141–150 (2019). Article Google Scholar * Li, B. et al. Improving LSTM hydrological modeling with spatiotemporal deep learning and multi-task
learning: a case study of three mountainous areas on the Tibetan Plateau. _J. Hydrol._ 620, 129401 (2023). Article Google Scholar * Xu, R., Hu, H., Tian, F., Li, C. & Khan, M. Y. A.
Projected climate change impacts on future streamflow of the Yarlung Tsangpo-Brahmaputra River. _Glob. Planet. Change_ 175, 144–159 (2019). Article Google Scholar * Huang, Q., Long, D.,
Du, M., Han, Z. & Han, P. Daily continuous river discharge estimation for ungauged basins using a hydrologic model calibrated by satellite altimetry: implications for the SWOT mission.
_Water Resour. Res._ 56, e2020WR027309 (2020). Article Google Scholar * Goulden, M. L. & Bales, R. C. Mountain runoff vulnerability to increased evapotranspiration with vegetation
expansion. _P. Natl Acad. Sci. USA_ 111, 14071–14075 (2014). Article CAS Google Scholar * Huang, Q., Zhang, Y., Ma, N. & Post, D. Estimating Vegetation Greening Influences on Runoff
Signatures Using a Log-Based Weighted Ensemble Method. _Water Resour. Res._ 58, e2022WR032492 (2022). Article Google Scholar * Wang, Y. et al. Vanishing Glaciers at Southeast Tibetan
Plateau Have Not Offset the Declining Runoff at Yarlung Zangbo. _Geophys. Res. Lett._ 48, e2021GL094651 (2021). Article Google Scholar * Huo, J., Qu, X., Zhu, D., Yuan, Z. & Tang, Y.
Impacts of Climate Change on Blue and Green Water Resources in the Middle and Upper Yarlung Zangbo River, China. _Atmosphere_ 12, 1280 (2021). Article Google Scholar * Lei, Y. et al.
Response of inland lake dynamics over the Tibetan Plateau to climate change. _Climatic Change_ 125, 281–290 (2014). Article Google Scholar * Li, Z. et al. Lake dynamics in Tibetan Plateau
during 1990-2020 and exploratory factor analyses using Google Earth Engine. _Environ. Sci. Pollut. R._ 30, 41609–41622 (2023). Article Google Scholar * Zhang, G., Xie, H., Kang, S., Yi, D.
& Ackley, S. F. Monitoring lake level changes on the Tibetan Plateau using ICESat altimetry data (2003-2009). _Remote Sens. Environ._ 115, 1733–1742 (2011). Article Google Scholar *
Kuang, X. & Jiao, J. J. Review on climate change on the Tibetan Plateau during the last half century. _J. Geophys. Res. -Atmos._ 121, 3979–4007 (2016). Article Google Scholar * Wang,
L., Koike, T., Yang, K. & Yeh, P. J. F. Assessment of a distributed biosphere hydrological model against streamflow and MODIS land surface temperature in the upper Tone River Basin. _J.
Hydrol._ 377, 21–34 (2009). Article Google Scholar * Wang, C. et al. Water Changes and Sources of Siling Co Using Landsat and GRACE Data since 1972. _J. Earth Sci._ 35, 687–699 (2024).
Article Google Scholar * Li, M., Weng, B., Yan, D., Bi, W. & Wang, H. Variation trends and attribution analysis of lakes in the Qiangtang Plateau, the Endorheic Basin of the Tibetan
Plateau. _Sci. Total Environ._ 837, 155595 (2022). Article CAS Google Scholar * Hugonnet, R. et al. Accelerated global glacier mass loss in the early twenty-first century. _Nature_ 592,
726–731 (2021). Article CAS Google Scholar * Shu, S. et al. Estimation of snow accumulation over frozen Arctic lakes using repeat ICESat laser altimetry observations-A case study in
northern Alaska. _Remote Sens. Environ._ 216, 529–543 (2021). Article Google Scholar * Ran, Y., Li, X. & Cheng, G. Climate warming over the past half century has led to thermal
degradation of permafrost on the Qinghai-Tibet Plateau. _Cryosphere_ 12, 595–608 (2018). Article Google Scholar * Wang, T. et al. Unsustainable water supply from thawing permafrost on the
Tibetan Plateau in a changing climate. _Sci. Bull._ 68, 1105–1108 (2023). Article Google Scholar * Pulliainen, J. et al. Patterns and trends of Northern Hemisphere snow mass from 1980 to
2018. _Nature_ 581, 294–298 (2020). Article CAS Google Scholar * Yin, Y., Wu, S., Zhao, D., Zheng, D. & Pan, T. Modeled effects of climate change on actual evapotranspiration in
different eco-geographical regions in the Tibetan Plateau. _J. Geogr. Sci._ 23, 195–207 (2013). Article Google Scholar * Xu, X., Lu, C., Shi, X. & Gao, S. World water tower: An
atmospheric perspective. _Geophys. Res. Lett._ 35, L20815 (2008). Article Google Scholar * Immerzeel, W. W., van Beek, L. P. H. & Bierkens, M. F. P. Climate change will affect the
Asian water towers. _Science_ 328, 1382–1385 (2010). Article CAS Google Scholar * Cuo, L., Zhang, Y., Zhu, F. & Liang, L. Characteristics and changes of streamflow on the Tibetan
Plateau: A review. _J. Hydrol. -Reg. Stud._ 2, 49–68 (2014). Google Scholar * Tang, Y., Huo, J., Zhu, D. & Yuan, Z. Simulation of the Water Storage Capacity of Siling Co Lake on the
Tibetan Plateau and Its Hydrological Response to Climate Change. _Water_ 14, 3175 (2022). Article Google Scholar * Wang, Y. et al. Impacts of frozen ground degradation and vegetation
greening on upper Brahmaputra runoff during 1981-2019. _Int. J. Climatol._ 43, 3768–3781 (2023). Article Google Scholar * Gao, B. et al. Change in frozen soils and its effect on regional
hydrology, Upper Heihe Basin, northeastern Qinghai-Tibetan Plateau. _Cryosphere_ 12, 657–673 (2018). Article Google Scholar * Wang, T. et al. Pervasive permafrost thaw exacerbates future
risk of water shortage across the Tibetan Plateau. _Earths Future_ 11, e2022EF003463 (2023). Article Google Scholar * Wang, Y. et al. Frozen ground degradation may reduce future runoff in
the headwaters of an inland river on the northeastern Tibetan Plateau. _J. Hydrol._ 564, 1153–1164 (2018). Article Google Scholar * Lei, Y. et al. Unprecedented lake expansion in 2017-2018
on the Tibetan Plateau: Processes and environmental impacts. _J. Hydrol._ 619, 129333 (2023). Article Google Scholar * Perrin, C. et al. Impact of limited streamflow data on the
efficiency and the parameters of rainfall-runoff models. _Hydrol. Sci. J._ 52, 131–151 (2007). Article Google Scholar * Li, N., Wang, L. & Chen, D. Vegetation greening amplifies
shallow soil temperature warming on the Tibetan Plateau. _npj Clim. Atmos. Sci._ 7, 118 (2024). Article Google Scholar * Wallner, M. & Haberlandt, U. Non-stationary hydrological model
parameters: a framework based on SOM-B. _Hydrol. Process._ 29, 3145–3161 (2015). Article Google Scholar * Song, C., Huang, B. & Ke, L. Modeling and analysis of lake water storage
changes on the Tibetan Plateau using multi-mission satellite data. _Remote Sens. Environ._ 135, 25–35 (2013). Article Google Scholar * Wang, S. et al. Spatial and temporal characteristics
of actual evapotranspiration and its influencing factors in Selin Co Basin. _Theor. Appl. Climatol._ 155, 6195–6211 (2024). Article Google Scholar * Song, L., Wang, L., Luo, D., Chen, D.
& Zhou, J. Assessing hydrothermal changes in the upper Yellow River Basin amidst permafrost degradation. _npj Clim. Atmos. Sci._ 7, 57 (2024). Article Google Scholar * Zhang, G. et al.
100 years of lake evolution over the Qinghai-Tibet Plateau. _Earth Syst. Sci. Data._ 13, 3951–3966 (2021). Article Google Scholar * Zhang, G. et al. Extensive and drastically different
alpine lake changes on Asia’s high plateaus during the past four decades. _Geophys. Res. Lett._ 44, 252–260 (2017). Article Google Scholar * Zou, D. et al. A new map of permafrost
distribution on the Tibetan Plateau. _Cryosphere_ 11, 2527–2542 (2017). Article Google Scholar * Sellers, P. J. et al. A Revised Land Surface Parameterization (SiB2) for Atmospheric GCMS.
Part I: Model Formulation. _J. Clim._ 9, 676–705 (1996). Article Google Scholar * Liang, S. et al. A long-term Global LAnd Surface Satellite (GLASS) data-set for environmental studies.
_Int. J. Digit. Earth._ 6, 5–33 (2013). Article Google Scholar * He, J. et al. The first high-resolution meteorological forcing dataset for land process studies over China. _Sci. Data._
7,(2020). * Jiang, Y. et al. TPHiPr: a long-term (1979-2020) high-accuracy precipitation dataset (1/30°, daily) for the Third Pole region based on high-resolution atmospheric modeling and
dense observations. _Earth Syst. Sci. Data._ 15, 621–638 (2023). Article Google Scholar * Yang, D., Herath, S. & Musiake, K. Comparison of different distributed hydrological models for
characterization of catchment spatial variability. _Hydrol. Process._ 14, 403–416 (2000). Article Google Scholar * Li, Q., Sun, S. & Dai, Q. The numerical scheme development of a
simplified frozen soil model. _Adv. Atmos. Sci._ 26, 940–950 (2009). Article Google Scholar * Shrestha, M., Wang, L., Koike, T., Xue, Y. & Hirabayashi, Y. Improving the snow physics of
WEB-DHM and its point evaluation at the SnowMIP sites. _Hydrol. Earth Syst. Sci._ 14, 2577–2594 (2010). Article Google Scholar * Wang, L. et al. Development of a land surface model with
coupled snow and frozen soil physics. _Water Resour. Res._ 53, 5085–5103 (2017). Article Google Scholar * Wang, Y. et al. Temporal and spatial changes in hydrological wet extremes of the
largest river basin on the Tibetan Plateau. _Environ. Res. Lett._ 18, 104006 (2023). Article Google Scholar * Chai, C. et al. Future snow changes and their impact on the upstream runoff in
Salween. _Hydrol. Earth Syst. Sc._ 26, 4657–4683 (2022). Article Google Scholar * Liu, H. et al. Energy-balance modeling of heterogeneous glacio-hydrological regimes at upper Indus. _J.
Hydrol. -Reg. Stud._ 49, 101515 (2023). Google Scholar * Qi, J. et al. Coupled snow and frozen ground physics improves cold region hydrological simulations: an evaluation at the upper
Yangtze River basin (Tibetan Plateau). _J. Geophys. Res. -Atmos._ 124, 12985–13004 (2019). Article Google Scholar * Zhong, X. et al. Precipitation dominates long-term water storage changes
in Nam Co Lake (Tibetan Plateau) accompanied by intensified cryosphere melts revealed by a basin-wide hydrological modelling. _Remote Sens._ 12, 1926 (2020). Article Google Scholar
Download references ACKNOWLEDGEMENTS This study was jointly supported by the National Natural Science Foundation of China (Grant Nos. 42201141, U23A2010, 42376254, 42071090). We are grateful
for the valuable discharge data provided by Yinsheng Zhang and Yanhong Guo. We thank the editor and the anonymous reviewers for their helpful comments and constructive suggestions. AUTHOR
INFORMATION AUTHORS AND AFFILIATIONS * School of Geographical Sciences, Nanjing University of Information Science and Technology, Nanjing, China Yuanwei Wang, Lingxiao Wang, Ting Li, Zhaoyan
Xie, Sichen Lin & Lin Zhao * State Key Laboratory of Tibetan Plateau Earth System, Environment and Resources (TPESER), Institute of Tibetan Plateau Research, Chinese Academy of
Sciences, Beijing, China Lei Wang, Jing Zhou & Xiaoyu Guo * University of Chinese Academy of Sciences, Beijing, China Lei Wang * Changwang School of Honors, Nanjing University of
Information Science and Technology, Nanjing, China Ying Hong Authors * Yuanwei Wang View author publications You can also search for this author inPubMed Google Scholar * Lingxiao Wang View
author publications You can also search for this author inPubMed Google Scholar * Lei Wang View author publications You can also search for this author inPubMed Google Scholar * Ting Li View
author publications You can also search for this author inPubMed Google Scholar * Jing Zhou View author publications You can also search for this author inPubMed Google Scholar * Xiaoyu Guo
View author publications You can also search for this author inPubMed Google Scholar * Zhaoyan Xie View author publications You can also search for this author inPubMed Google Scholar *
Sichen Lin View author publications You can also search for this author inPubMed Google Scholar * Ying Hong View author publications You can also search for this author inPubMed Google
Scholar * Lin Zhao View author publications You can also search for this author inPubMed Google Scholar CONTRIBUTIONS Y.W.: conceptualization, methodology, visualization,
investigation,writing–original draft & revised, funding. Lingxiao W.: investigation, funding. Lei W.: resources. X.G.: funding. L.Z.: investigation. All authors reviewed and edited the
manuscript. CORRESPONDING AUTHOR Correspondence to Yuanwei Wang. ETHICS DECLARATIONS COMPETING INTERESTS The authors declare no competing interests. ADDITIONAL INFORMATION PUBLISHER’S NOTE
Springer Nature remains neutral with regard to jurisdictional claims in published maps and institutional affiliations. RIGHTS AND PERMISSIONS OPEN ACCESS This article is licensed under a
Creative Commons Attribution-NonCommercial-NoDerivatives 4.0 International License, which permits any non-commercial use, sharing, distribution and reproduction in any medium or format, as
long as you give appropriate credit to the original author(s) and the source, provide a link to the Creative Commons licence, and indicate if you modified the licensed material. You do not
have permission under this licence to share adapted material derived from this article or parts of it. The images or other third party material in this article are included in the article’s
Creative Commons licence, unless indicated otherwise in a credit line to the material. If material is not included in the article’s Creative Commons licence and your intended use is not
permitted by statutory regulation or exceeds the permitted use, you will need to obtain permission directly from the copyright holder. To view a copy of this licence, visit
http://creativecommons.org/licenses/by-nc-nd/4.0/. Reprints and permissions ABOUT THIS ARTICLE CITE THIS ARTICLE Wang, Y., Wang, L., Wang, L. _et al._ Divergent effects of temperature and
precipitation on water flow into the largest lake on the Tibetan Plateau. _npj Clim Atmos Sci_ 8, 131 (2025). https://doi.org/10.1038/s41612-025-01017-9 Download citation * Received: 10
October 2024 * Accepted: 20 March 2025 * Published: 30 March 2025 * DOI: https://doi.org/10.1038/s41612-025-01017-9 SHARE THIS ARTICLE Anyone you share the following link with will be able
to read this content: Get shareable link Sorry, a shareable link is not currently available for this article. Copy to clipboard Provided by the Springer Nature SharedIt content-sharing
initiative