
Gwas meta-analysis reveals key risk loci in essential tremor pathogenesis
- Select a language for the TTS:
- UK English Female
- UK English Male
- US English Female
- US English Male
- Australian Female
- Australian Male
- Language selected: (auto detect) - EN
Play all audios:

ABSTRACT Essential tremor (ET) is a prevalent neurological disorder with a largely unknown underlying biology. In this genome-wide association study meta-analysis, comprising 16,480 ET cases
and 1,936,173 controls from seven datasets, we identify 12 sequence variants at 11 loci. Evaluating mRNA expression, splicing, plasma protein levels, and coding effects, we highlight seven
putative causal genes at these loci, including _CA3_ and _CPLX1_. _CA3_ encodes Carbonic Anhydrase III and carbonic anhydrase inhibitors have been shown to decrease tremors. _CPLX1_,
encoding Complexin-1, regulates neurotransmitter release. Through gene-set enrichment analysis, we identify a significant association with specific cell types, including dopaminergic and
GABAergic neurons, as well as biological processes like Rho GTPase signaling. Genetic correlation analyses reveals a positive association between ET and Parkinson’s disease, depression, and
anxiety-related phenotypes. This research uncovers risk loci, enhancing our knowledge of the complex genetics of this common but poorly understood disorder, and highlights _CA3_ and _CPLX1_
as potential therapeutic targets. SIMILAR CONTENT BEING VIEWED BY OTHERS UPDATED MDSGENE REVIEW ON THE CLINICAL AND GENETIC SPECTRUM OF _LRRK2_ VARIANTS IN PARKINSON´S DISEASE Article Open
access 17 February 2025 MULTI-ANCESTRY GENOME-WIDE ASSOCIATION META-ANALYSIS OF PARKINSON’S DISEASE Article Open access 28 December 2023 EXPANDING CAUSAL GENES FOR PARKINSON’S DISEASE VIA
MULTI-OMICS ANALYSIS Article Open access 21 October 2023 INTRODUCTION Essential tremor (ET) is one of the most common neurological disorders, affecting up to 5% of the population1. However,
epidemiological studies show that the prevalence of the disorder is considerably underestimated as mildly affected individuals may not seek medical care2. ET is an isolated syndrome of
bilateral upper limb postural or kinetic tremor, that may be with or without tremor of head, voice, or lower limbs and without other neurological signs such as dystonia, ataxia, or
parkinsonism3. Although not life-threatening, the disorder can severely impact daily activities, reducing quality of life. Increasing age, European descent4,5,6 and family history7,8 are
considered risk factors for ET. Diagnosing ET can be challenging and often requires subspecialty consultation with a movement disorders neurologist. The diagnosis involves reviewing medical
and family history and conducting a thorough neurological examination, as a biomarker or diagnostic test is not available9. Although there is no cure for ET, several treatment options are
available to ease the symptoms. These include drug therapy (beta blockers, anti-epileptics, and tranquilizers), deep brain stimulation, and lifestyle modifications, such as avoiding triggers
that can increase the severity of the tremors. The cause of ET is not fully understood, but there is a growing support for the etiology of ET being partly related to abnormalities of the
cerebello-thalamo-cortical network, including loss of Purkinje cells and reduced γ-aminobutyric acid (GABA) receptor expression in the dentate nucleus10,11. Previously, the largest
genome-wide association study (GWAS) meta-analysis of ET reported five risk loci using data from 7177 cases and 475,877 controls from European populations12. Here, we more than double the ET
case number, combining 16,480 cases and 1,936,173 controls in a GWAS meta-analysis and find 12 independent sequence variants at 11 loci, of which 8 are novel. Our research presents new
genetic revelation regarding GABAergic dysfunction in ET, highlights the role of dopaminergic neurons, and provides further insight into the genetics of ET, offering clues that may lead to
novel future treatment options. RESULTS GWAS META-ANALYSIS 
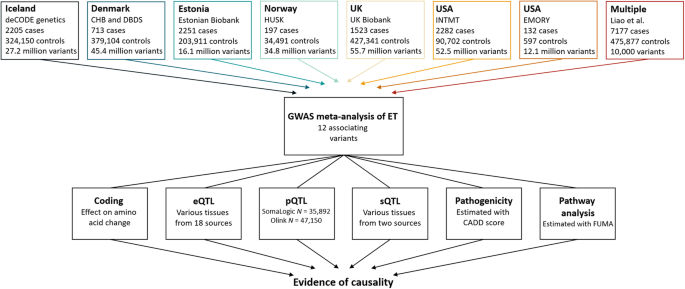
In a meta-analysis of ET, we combined GWAS results from Iceland, Denmark, Estonia, Norway, UK, and USA (seven datasets) with
summary statistics from a reported GWAS12, resulting in 16,480 cases and 1,936,173 controls (Fig. 1 and Supplementary Data 1). Using a fixed-effect inverse variance model, we tested for
association, under an additive model, between ET and sequence variants with imputation information over 0.8 and minor allele frequency (MAF) over 0.01% in each dataset (except the Estonian
dataset and the reported GWAS, where variants with MAF over 1% were included). To account for multiple testing, we used weighted genome-wide significance thresholds based on the predicted
functional impacts of the associated variants (Supplementary Data 2). We uncovered association with ET at 11 loci (Supplementary Fig. 1 and Supplementary Data 3). Conditional analysis
revealed a secondary signal at one of the loci (Supplementary Data 4). In total, we uncovered 12 independent common variants, 8 of which are novel (Fig. 2). There was no evidence of
heterogeneity (all _P_-het > 0.05), indicating consistency of effects across the datasets (Supplementary Data 3). Five variants have been reported to associate with ET12 and we show
supportive evidence for all except one, at chromosome 1p13.1 (Supplementary Data 5). We report these signals directly or through a correlated variant (_r_2 ≥ 0.8) at the same locus
(Supplementary Data 5). At chromosome 4p15.2, we observed a previously reported variant as the primary signal, along with a novel variant at the same locus acting as the secondary signal
(_r_2 = 0.022, Supplementary Fig. 1c, f). POTENTIAL CAUSAL GENES We searched for causal genes at the ET loci by evaluating the affected amino acid sequence of the lead variants and highly
correlated variants (_r_2 ≥ 0.8), mRNA expression (expression quantitative trait loci [eQTLs]), splicing quantitative loci (sQTLs), and plasma protein levels (pQTLs) (Fig. 1). We found
coding variants at three of the ET associated loci, in _CA3_ (p.V31I, _r_2 = 1.00 with lead variant), _EHBP1_ (p.K720Q/K755Q, _r_2 = 0.96 with lead variant), and _GCKR_ (p.L446P, lead
variant) (Fig. 3 and Supplementary Data 6). We found eQTLs for _BACE2_, _CPLX1_, _OTX1_, _C2orf16_, and _CA3_ (Supplementary Data 7) and pQTLs for _CA3_ (Supplementary Data 8) and _GCKR_
(Supplementary Data 9). The lead ET variant at the _CA3_ locus confers protection against ET (rs955007-C, _P_ = 1.4 × 10⁻¹², OR = 0.92, Fig. 3. and Supplementary Data 3) and is also highly
correlated (_r_2 = 0.97) with the primary _cis_-eQTL which decreases _CA3_ expression in skeletal muscles (rs10088136-A, _P_ = 8.7 × 10⁻¹³, β = -0.13, Supplementary Data 7). Using COLOC13,
we estimated that the posterior probability that the ET association and the eQTL are caused by the same variant is 89%. In addition, the lead variant is highly correlated (_r_2 = 1.00) with
the primary pQTL for carbonic anhydrase III and decreases its plasma levels (chr8:85445533, _P_ = 3.2 × 10−131, β = −0.22, Supplementary Data 8). Furthermore, rs955007-C also associates with
lower plasma levels of carbonic anhydrase XIII (located roughly 200KB upstream, _P_ = 6.3 × 10−195, β = −0.23). However, rs955007 is not in high LD (_r_2 = 0.14) with the primary pQTL at
the region (Supplementary Data 8). The lead intronic ET variant within _EHBP1_ is highly correlated (_r_2 = 0.91) with the top _cis-_eQTLs for _OTX1_ in whole blood (rs76298426-C, _P_ =
10−1673, β = 1.15) and neutrophiles (rs146236066-CT, _P_ = 1.6 × 10−51, β = 0.98, Supplementary Data 7). We identified an intronic variant in _CPLX1_ that confers risk of ET (rs13128363-T,
_P_ = 9.0 × 10⁻¹⁵, OR = 1.14, Fig. 3 and Supplementary Data 3) and is the top _cis_-eQTL for the gene in whole blood (Supplementary Data 7). There were no sQTLs at the loci in whole blood.
Gene-set enrichment analysis in FUMA14 highlighted cell types in the human embryonic midbrain such as dopaminergic neurons, GABAergic neuroblasts and neurons, and mediolateral neuroblast
(Supplementary Data 10). In addition, the analysis revealed enrichment for pathways such as regulation of response to stress, cell adhesion, and Rho GTPase cycles (Supplementary Data 10).
The sex ratio in our study is close to 50% (52.9% females, Supplementary Data 1). When applying sex-specific models to the Icelandic, Danish, Norwegian, UK, and US-INTMT datasets for the 12
ET variants, none of the variants had an effect that significantly differed between the sexes, after accounting for multiple testing (_P_-het > 0.05/12 = 0.0042, Supplementary Data 11).
FAMILIAL CLUSTERING AND GENETIC VARIANCE EXPLAINED A close to complete genealogy exists for the Icelandic dataset. We did not find high-impact variants, including start-lost, stop-gain,
stop-lost, splice donor, splice acceptor, or frameshift, segregating among 53 large families with high incidence of ET (_N_ ≥ 5). In addition, we did not see a significant difference in
effects of 11 of the 12 lead variants between familial (_N_ = 1153) and sporadic cases (_P_-het > 0.05/12 = 0.0042, Supplementary Fig. 3). Using the 12 independent variants, we estimated
the genetic variance explained to be 4.4% (Supplementary Data 12). GENETIC CORRELATION Considering the epidemiology and positive genetic correlation that has been reported between ET and
Parkinson’s disease (PD) and depression12, we estimated the genetic correlation between ET and these two phenotypes using the most recent GWASs and cross-trait LD score regression. In line
with previous reports, we observed a positive genetic correlation between ET and these phenotypes (PD15, _r_g = 0.28, _P_ = 1.1 × 10⁻⁶; depression16, _r_g = 0.15, _P_ = 3.4 × 10⁻⁵,
Supplementary Data 13). In addition, we estimated the genetic correlation between ET and summary data from 1142 published GWASs (_P_-threshold ≤ 0.05/1142 = 4.4 × 10⁻⁵) and found that ET
correlates most strongly with anxiety-related phenotypes (e.g., feeling nervous, _r_g = 0.20, _P_ = 2.0 × 10⁻⁶, Supplementary Data 13). DISCUSSION We report a GWAS meta-analysis of ET that
combines 16,480 cases and expands results from previous GWASs by identifying 12 variants at 11 loci, of which 8 are novel. We leveraged mRNA expression, including splicing, plasma protein
measurements and predicted coding effects to highlight seven putative causal genes and the biological roles of some of the variants. Through gene-set enrichment analysis, we underscored the
involvement of dopaminergic and GABAergic neurons in ET, as well as the biological significance of the Rho GTPase cycle. We did not find high-impact variants segregating in families with
high prevalence of ET. We showed a positive genetic correlation between ET and PD, depression, and anxiety-related phenotypes. Based on functional annotation, we highlighted seven genes that
may participate in the pathogenesis of ET. One of the candidate causal genes is _CA3_ which encodes carbonic anhydrase III and is in close proximity ( >1 Mb) to other carbonic anhydrase
genes including _CA1_, _CA2_, and _CA13_. Carbonic anhydrase inhibitors represent a class of drugs that have demonstrated the ability to improve tremors, potentially through modulating brain
pH levels. Additionally, acidification facilitates GABA receptor potentiation which may facilitate the effect of the inhibitors, on tremor and seizures17,18. Primidone, an anti-epileptic
drug widely used to treat ET patients, has been shown to inhibit carbonic anhydrase II18. The lead variant at the _CA3_ locus confers protection against ET and is highly correlated with a
variant that associates (top _cis_-eQTLs) with decreased expression of _CA3_ in skeletal muscles. The variant also associates with decreased plasma levels of carbonic anhydrase III and XIII.
The high LD at the locus suggest a potentially shared biological mechanism or pathway through which the variants exert their effects. Further research is needed to identify the most likely
causal variants. Carbonic anhydrases are relevant proteins that may have an important role in the biology of ET. This notable finding lends support to the hypothesis that inhibiting carbonic
anhydrases could lead to improved tremor control. Thus, targeting the interplay of _CA3_ and its closely related enzymes might lead to the development of more targeted and effective
treatments for individuals suffering from ET. While ET may not be directly caused by imbalances in neurotransmitters, certain neurotransmitters have been implicated in its development and
severity, such as GABA10,19,20. _CPLX1_ encodes Complexin-1, a soluble presynaptic protein that specifically enhances transmitter release by increasing fusogenicity of synaptic vesicles21.
_CPLX1_ is overexpressed in substantia nigra from PD patients22 and dysregulation of the gene have been associated with neurogenetic disorders23, including myoclonic epilepsy24. In addition,
homozygous _Cplx1_ knockout mice have the earliest known onset of ataxia seen in a mouse model21,25,26. We identified an intronic variant in _CPLX1_ that increases the risk of ET and is the
top _cis_-eQTL for _CPLX1_ in blood. This finding aligns with previous research and strongly suggests the involvement of _CPLX1_ in the pathogenicity of ET. _OTX1_ is a homeodomain
transcription factor and is encoded by Orthodenticle homeobox 1. In the mammalian brain, _OTX1_ is expressed in the forebrain and midbrain during early stages of neural development27 and at
later stages and adulthood at high levels in layers 5 and 6, the deepest layers of the cortical plate28,29. Layer 5 neurons convey signals controlling motor behavior via their projections to
the colliculi, pons, and spinal cord30,31,32,33. _Otx1_ mutant mice have been reported to show spontaneous epileptic behavior and multiple abnormalities affecting certain brain regions34.
_Otx1_ mutant animal studies suggest that Otx1 is required for the development of normal axonal connectivity and the generation of coordinated motor behavior29. The ET associated variant in
_EHBP1_ is in high LD with a missense variant in the same gene and is, additionally, highly correlated with two intronic variants in _EHBP1_ and one variant in _OTX1_, all of which are top
_cis_-eQTLs for _OTX1_ expression in blood and neutrophiles. Based on these findings, our observations suggest that the intronic variant in _EHBP1_ may contribute to the risk of ET by
potentially upregulating the expression of _OTX1_. Consequently, _OTX1_ emerges as a promising candidate gene that could play a significant role in the underlying pathogenic mechanism of ET.
However, it is important to note that we did not investigate protein levels of OTX1, as it is neither measured on the Somalogic nor Olink platforms. _GCKR_ has been associated with high
serum uric acid and purine metabolism disorders35. Extrapyramidal signs such as tremor are often observed in these disorders36. Individuals with high serum uric acid might experience tremors
attributed to these metabolic issues, yet, due to the lack of routine serum uric acid testing, they could be incorrectly diagnosed with ET. Whether the tremor associated with the _GCKR_
variant is a phenocopy or typical ET needs to be investigated further. GABAergic dysfunction, consistently observed in ET patients10,19,37, is a focal point of research, but its genetic
underpinnings remain unidentified. Our gene-set enrichment analysis reinforces the proposed role of GABA in ET, yet the exact role of GABA in the causative framework requires further
elucidation. In addition, our analysis found enrichment for dopaminergic neurons, a crucial regulator of extrapyramidal movement. Given the shared phenotypic and genetic traits between ET
and PD, the association with dopaminergic neurons is anticipated, particularly as their selective degeneration in the substantia nigra pars compacta characterizes PD38. Notably, neurologist
have long suspected a potential link between ET and PD, but definitive evidence for this relationship has remained elusive39. Furthermore, our analysis underscores the significance of
various biological processes, most notably the Rho GTPase cycle. Rho GTPases regulate the actin cytoskeleton of dopaminergic neurons, thus influencing their degeneration40,41, and have been
implicated in PD41,42. Interestingly, our findings underscore the significance of stress response regulation, especially given the genetic overlap between ET and anxiety phenotypes. ET
patients exhibit intensified tremors under stress, and anti-anxiety medications, such as Clonazepam, prove highly effective in alleviating these tremors. Familial clustering of ET is well
recognized. However, estimates of the proportion with a family history is highly debated and ranges from as low as 17% to as high as 100%43. Linkage studies have identified susceptibility
loci on 3q1344 and 2p24.145 but others have shown absence of linkage at these loci46. The absence of a significant difference between the effects of sporadic and familial cases and the lack
of high-impact variants segregating in several large Icelandic families, underscores the potential that ET may be predominantly influenced by common variants or a combination of such
variants, rather than rare variants. To gain deeper insights into the contribution of common variants on ET risk, the creation of a polygenic risk score would be valuable. A PRS analysis, if
conducted with larger and more diverse datasets, could offer further clarity on the polygenic nature of ET and thus, the assembly of larger cohorts in future research holds promise to
increasing our understanding of the complex genetics of ET. Another limitation lies in the lack of ethnic diversity within the datasets studied. As an increasing amount of genotypic and
phenotypic data becomes available for diverse ethnic backgrounds, the inclusion of greater diversity in future studies could be helpful in uncovering ethnicity-specific genetic contributions
and advancing our understanding of the genetic underpinnings of ET. In the previous GWAS conducted on ET, a subset consisting of 216 cases from the UK Biobank ET data was used. Regrettably,
we could not ascertain whether these particular cases overlap with the UK Biobank cases utilized in our current study. It is worth mentioning that even if all of these cases overlap with
our data, they represent only 2% of the total 9303 cases (excluding cases from the previous GWAS). Given their small proportion, the exclusion of these cases would not significantly impact
the results or conclusions of our study. To conclude, through a comprehensive GWAS meta-analysis and a multiomics approach using a substantial cohort, we have advanced our understanding of
the genetics and pathogenesis of ET. This progress not only enhances our knowledge of this complex and prevalent neurological disorder but can also form the basis for future investigations
into treatment strategies and personalized interventions. METHODS STUDY SAMPLE AND ETHICS STATEMENT In this study, ET cases were defined using International Classification of Diseases 10
(ICD-10) code G25.0 or ICD-9 code 333.1 in all datasets, as described in detail below, in addition to the sample defined by Liao et al.12. All ethical regulations relevant to human research
participants were followed. The data used in the GWAS meta-analysis were collected through studies approved by ethics committees governing each dataset and written informed consent was
obtained from all participants. Personal identifiers of participants’ data were encrypted for privacy protection purposes in accordance with the regulation in each country. Genetic ancestry
quality control was performed for all datasets47,48,49,50 and participants were genotypically verified as being of European descent. In total, we studied data from 16,480 ET cases and
1,936,173 controls (Fig. 1 and Supplementary Data 1). ICELAND – DECODE GENETICS A large fraction of the Icelandic population has participated in a research program at deCODE genetics.
Participants donated blood or buccal samples after signing a broad informed consent allowing the use of their samples and data in various projects approved by the National Bioethics
Committee (NBC). The data in this study was approved by the NBC (VSN-17-142-V5; VSNb2017060004/03.01) following review by the Icelandic Data Protection Authority. All personal identifiers of
the participants’ data were encrypted in accordance with the regulations of the Icelandic Data Protection Authority. The Icelandic ET cases were identified from medical records, filed from
1985 to 2022, through collaboration with physicians at Landspitali—National University Hospital in Reykjavik, the Registry of Primary Health Care Contacts, and the Registry of Contacts with
Medical Specialists in Private Practice. DENMARK – THE COPENHAGEN HOSPITAL BIOBANK AND THE DANISH BLOOD DONOR STUDY The Copenhagen Hospital Biobank (CHB) is a research biobank, which
contains samples obtained during diagnostic procedures on hospitalized and outpatients in the Danish Capital Region hospitals. Data analysis was performed under the Developing the basis for
personalized medicine in degenerative and episodic brain disorders protocol, approved by the National Committee on Health Research Ethics (H-21058057). The Danish Blood Donor Study (DBDS)
Genomic Cohort is a nationwide study of ~160,000 blood donors51. The Danish Data Protection Agency (P-2019-99) and the National Committee on Health Research Ethics (NVK-1700407) approved the
studies under which data on DBDS participants were obtained. The DBDS data requested for this study was approved by the DBDS steering committee. ESTONIA – ESTONIAN BIOBANK The Estonian
Biobank is a population-based cohort of approximately 210,000 participants, each accompanied by a variety of phenotypic and health-related data52. Upon recruitment, participants granted
permission through signed consents for subsequent linkage to their electronic health records, enabling the longitudinal accumulation of phenotypic details. The Estonian Biobank facilitates
access to the records from the National Health Insurance Fund Treatment Bills (since 2004), Tartu University Hospital (since 2008), and North Estonia Medical Center (since 2005). For each
participant, data is available on diagnoses coded in ICD-10 and drug dispensing records, including ATC codes, prescription statuses, and purchase dates (when available). The activities of
the EstBB are regulated by the Human Genes Research Act, which was adopted in 2000 specifically for the operations of the EstBB. Analysis of individual level data from the EstBB was carried
out under ethical approval 1.1-12/624 from the Estonian Committee on Bioethics and Human Research (Estonian Ministry of Social Affairs), using data according to release application
[6-7/GI/29 977] from the Estonian Biobank. NORWAY – THE HORDALAND HEALTH STUDY The Hordaland Health Study (HUSK) is a community-based study in Western Norway conducted as a collaboration
between the University of Bergen, the Norwegian Health Screening Service and the Municipal Health Service in Hordaland (https://husk-en.w.uib.no/)53. In 1992–93 and 1997–99 participants were
invited based on year of birth and site of residence. Residents from Hordaland County born 1950–52 and residents from Bergen and three neighboring municipalities born 1925–27, in addition
to a random sample born 1926–49 were invited in 1992–93. In 1997–99, previous participants born 1950–51 and 1925–27 were reinvited, in addition to all residents in Hordaland County born
1953–57. In total, approximately 36,000 individuals participated in the study, 18,000 in 1992–93 and 26,000 in 1997–99, with some participating at both times. ET cases were identified
through diagnostic codes reported in the patient registry during 2008 to 2021. The HUSKment study is approved by the Regional Committee for Medical Research Ethics Western Norway, reference
2018/915. THE UK – THE UK BIOBANK The UK Biobank resource has collected extensive phenotype and genotype data from ~500,000 participants in the age range 40–69, from across the UK after
signing an informed consent for the use of their data in genetic studies54. The North West Research Ethics Committee reviewed and approved UK Biobank’s scientific protocol and operational
procedures (REC Reference Number: 06/MRE08/65). This study was conducted using the UK Biobank resource under application number 42256. ET cases were identified in General Practice clinical
event records (Field ID 42040) and UK hospital diagnoses (Field ID 41270 and 41271). THE US – INTERMOUNTAIN HEALTHCARE Participants, voluntary US residents over the age of 18 years, were
recruited by The Intermountain Inspire Registry and The HerediGene: Population study55, a large-scale collaboration between Intermountain Healthcare, deCODE genetics, and Amgen, Inc
(https://intermountainhealthcare.org). The Intermountain Healthcare Institutional Review Board approved this study, and all participants provided written informed consent prior to
enrollment. THE US – EMORY GENERAL CLINICAL RESEARCH CENTER The Clinical Research in Neurology (CRIN) provides an umbrella structure for subject enrollment in observational and genetic
studies in neurology, consent-approved data sharing across studies and disorders, and consistent sample processing. Participants were recruited under the CRIN protocol through support from
Emory Clinical Research Center NIH/NCRR M01 RR00039 (CRIN Infrastructure support). The study was approved by the Emory Institutional Review Board (IRB) and informed consent was obtained from
all subjects. ET genotyping work was done under specific IRB protocols. Samples were drawn from either review of previously enrolled subjects in the CRIN database, or prospective enrollment
of ET subjects into CRIN/ET observational and genetics work. All subjects underwent a basic structured interview for demographics and family history. A Folstein Mini Mental Status Exam was
administered to all CRIN subjects by trained CRIN personnel supervised by a neuropsychologist per published guidelines. All CRIN database subjects enrolled prior to January 2007 with a
reported diagnosis of 333.1 were reviewed. ET subjects were called in for full in-person assessments whenever possible. ET subjects mid-2006 onward were recruited through IRB-approved ads in
the Emory Movement Disorders and Neurosurgery deep brain stimulation group clinics, and ET community education events. ET subjects and family members were examined directly by at least one
movement disorders specialist; two independent exams were obtained whenever possible (a tremor rating scale derived from the Fahn-Tolosa-Marin scale and Tremor Research Group scale items,
the motor United Parkinson Disease Rating Scale, Tinetti gait and balance scales56, tandem gait57, and assessment for dystonia). Semi-structured interviews included ET specific questions
derived from the Fahn-Tolosa-Marin scale and WHIGET studies58. CRIN review and new enrollment subjects were given a research diagnosis of ET using Movement Disorders Society and Tremor
Research Group criteria. ET cases with either Parkinson’s disease or dystonia were excluded. Subjects were excluded based on a number of criteria; if an in-person exam and re-interview
determined a different diagnosis, if movement disorders clinical notes listed an uncertain or different final diagnosis (i.e., medication induced tremor), if there was an incomplete
examination, lack of medication response, or other data to clearly establish an ET research diagnosis. GENOTYPING AND IMPUTATION ICELAND – DECODE GENETICS The genomes of 63,460 Icelanders
were whole genome sequenced (WGS)47,59 using GAIIx, HiSeq, HiSeqX, and NovaSeq Illumina technology to a mean depth of 38×. Genotypes of single nucleotide polymorphisms (SNPs) and
insertions/deletions (indels) were identified and called jointly with Graphtyper60,61. Over 173,000 Icelanders (including all WGS Icelanders) were genotyped using various Illumina SNP
arrays47,59. The genotypes were long-range phased62, which allows for improving genotype calls using haplotype sharing information. Subsequently, extensive encrypted genealogic information
was used to impute variants into the chip-typed Icelanders, as well as ungenotyped close relatives63 to increase the sample size and power for association analysis. DENMARK – THE COPENHAGEN
HOSPITAL BIOBANK AND THE DANISH BLOOD DONOR STUDY The Danish samples from the CHB and DBDS were genotyped using Illumina Global Screening Array, and long-range phased together with 270,627
genotyped samples from North-western Europe using Eagle264. Samples and variants with less than 98% yield were excluded. A haplotype reference panel was prepared in the same manner as for
the Icelandic data47,62 by phasing genotypes of 25,215 WGS individuals (sequenced with NovaSeq Illumina technology to a mean depth of 20×) from North-western Europe, including 8,360 Danes,
using the phased chip data. Graphtyper60,61 was used to call the genotypes which were subsequently imputed into the phased chip data. WGS, chip-typing, quality control, long-range phasing,
and imputation from which the data for this analysis were generated was performed at deCODE genetics. ESTONIA – ESTONIAN BIOBANK The samples from the Estonian Biobank were genotyped at the
Genotyping Core Facility of the Institute of Genomics at the University of Tartu, using the Illumina Global Screening Array. In total, 212,955 samples passed quality control. Samples were
excluded from the analysis if their call-rate was below 95% or if the gender, identified by the heterozygosity of the X chromosome, did not align with the gender documented in phenotype
data. Variants were excluded if the call-rate was below 95% or if the HWE p-value was less than 1e-4 (only autosomal variants). In addition, SNPs that showed potential traces of batch bias
were removed. Two batch bias control steps were performed: 1) SNPs that showed poor cluster separation results among any of Estonian Biobank genotyping experiments were removed. The
threshold for SNP removal was Illumina GenTrain score <0.6 and/or cluster separation score <0.4. 2) SNPs that showed inconsistent allele frequency among genotyping experiments were
excluded. First, allele frequency was calculated for each SNP for each genotyping experiment with more than 10,000 samples. Next, mean allele frequency was calculated. Finally, if SNP allele
frequency was more than 5% away from the mean in any of genotyping experiments, the SNP was excluded from the merged dataset. Prior to imputation, variants with MAF less than 1% and indels
were removed. The Eagle v2.4.164 was used for prephasing and imputation was executed using Beagle v5.4 (beagle.22Jul22.46e)65. An imputation reference, specific to the Estonian population,
consisting of 2056 WGS samples was used66. Participants with non-European assigned group ancestry were removed, leaving a total of 206,162 samples. NORWAY – THE HORDALAND HEALTH STUDY The
Norwegian dataset was genotyped using Illumina SNP arrays (either OmniExpress or Global Screening Array). The chip-genotyping quality control and imputation were performed at deCODE
genetics, where the same methods used for the Danish sample were applied. The imputation process relied on the same haplotype reference panel as the Danish sample, a panel composed of phased
genotypes of 25,215 WGS samples of European ancestry, including 3,336 samples of Norwegian origin. THE UK – THE UK BIOBANK The samples from the UK Biobank were genotyped using two different
Affymetrix chips – the UK BiLEVE Axiom in the first 50,000 individuals67, and the Affymetrix UK Biobank Axiom array68 in the remaining participants. In total, 428,864 participants have been
genotyped and 131,272 WGS. Samples with variant yield below 98% were filtered out and any duplicate samples were removed. High-quality sequence variants and indels to a mean depth of at
least 20× were identified using Graphtyper60,61. Quality-controlled chip-genotype data were phased using Shapeit469 and variants where at least 50% of the samples had a genotype quality
score above 0 were used to prepare a haplotype reference panel using in-house tools and the long-range phased chip data. The variants in the haplotype reference panel were imputed into the
chip-genotyped samples using the same in-house tools and methods described for the Icelandic data47,62. THE US – INTERMOUNTAIN HEALTHCARE The Intermountain dataset was genotyped using
Illumina Global Screening Array chips (_N_ = 76,660) and WGS with NovaSeq Illumina technology (_N_ = 20,632). The samples were filtered on 98% variant yield and duplicates removed.
High-quality sequence variants and indels with at least a mean depth of 20× were identified with Graphtyper60,61. Quality-controlled genotype data were phased with Shapeit469. A phased
haplotype reference panel was prepared with the same in-house tools and methods described for the Icelandic data47,62. THE US – EMORY GENERAL CLINICAL RESEARCH CENTER The genotyping of the
Emory dataset has been described previously50. In short, the Emory dataset was genotyped using three types of chips from Illumina (HumanHap300, HumanHap300-Duo and HumanCNV370-Duo). These
chips have 314,125 SNPs in common. Prior to analysis, certain SNPs were excluded based on the following criteria; being monomorphic, having less than 95% yield in either cases or controls,
deviating from Hardy-Weinberg equilibrium, or displaying divergent allele frequencies between the chips. Additionally, samples with a call-rate less than 98% were excluded. STATISTICS AND
REPRODUCIBILITY We applied logistic regression assuming an additive model using the expected allele counts as covariates, and combined the results with the available GWAS summary statistics
of 10,000 variants12 to test for association between sequence variants and ET. The covariates we used in the association analysis are described in Supplementary Data 14 for the datasets. We
used LD score regression to account for distribution inflation due to cryptic relatedness and population stratification70 and used the intercepts as correction factors. We combined the
results from the association analysis of all of the datasets together with the summary statistics (only the top 10,000 variants)12 using a fixed-effects inverse variance method71 based on
effect estimates and standard errors in which each dataset was assumed to have a common OR but allowed to have different population frequencies for alleles and genotypes. Sequence variants
were mapped to NCBI Build38 and matched on position and alleles to harmonize the datasets. The genome-wide significance threshold was corrected for multiple testing using a weighted
Bonferroni adjustment that controls for the family-wise error rate. Variants were weighted based on predicted functional impact72 (Supplementary Data 2). In a random-effects method, a
likelihood ratio test was performed in all genome-wide associations to test the heterogeneity of the effect estimate in the datasets; the null hypothesis is that the effects are the same in
all datasets and the alternative hypothesis is that the effects differ between datasets. The primary signal at each locus was defined as the sequence variant with the lowest
Bonferroni-adjusted _P_-value using the adjusted significance thresholds (Supplementary Data 2). To identify secondary signals at each locus (defined as 1 Mb from the index variants), we
performed conditional association analyses using the true imputed genotype data of each dataset except the Estonian and US-EMORY datasets and the summary statistics where an approximate
conditional analysis implemented in the GCTA software73 was used. LD between variants was estimated using a set of 5,000 WGS Icelanders. After adjusting for all variants in high LD (_r_2
> 0.8) and vice versa, the _P_-values were combined for all datasets to identify the most likely causal variant at each locus and any secondary signals. Based on the number of variants
tested, we chose a conservative _P_-value threshold of <5 × 10⁻⁸ for secondary signals. Manhattan plots were generated using the qqman package in R74. FUNCTIONAL DATA To highlight
potential causal genes associating with ET, we annotated the variants associating with ET or variants in high LD (_r_2 ≥ 0.8 and within ± 1 Mb) that are predicted to affect coding or
splicing of a protein (variant effect predictor using Refseq gene set), mRNA expression (top local expression quantitative trait loci [_cis_-eQTL]) in multiple tissues from deCODE, GTEx
(https://gtexportal.org), and other public datasets (Supplementary Data 15), and/or plasma protein levels (top protein quantitative trait loci [pQTL]) in large proteomic datasets from
Iceland and the UK. RNA sequencing was performed on whole blood (_N_ = 17,848) and subcutaneous adipose tissue (_N_ = 769). RNA isolation was performed using RNAzol RT according to
manufacturer’s protocol (Molecular Research Center RN 190). We isolated RNA using Chemagic Total RNA Kit special (PerkinElmer) in whole blood and RNAzol RT in adipose tissue, according to
the manufacturer’s instructions (Molecular Research Center, RN190). The concentration and quality of the RNA were determined with an Agilent 2100 Bioanalyzer (Agilent Technologies). RNA was
prepared and sequenced on the Illumina HiSeq 2500 and Illumina Novaseq systems according to the manufacturer’s recommendation. RNA-seq reads were aligned to personalized genomes using the
STAR software package v.2.5.3 with Ensembl v.87 gene annotations75,76. Gene expression was computed based on personalized transcript abundances using kallisto77. Association between sequence
variants and gene expression (_cis_-eQTL) was estimated using a generalized linear regression, assuming additive genetic model and quantile-normalized gene expression estimates, adjusting
for measurements of sequencing artefacts, demographic variables, blood composition, and PCs78. The gene expression PCs were computed per chromosome using a leave-one-chromosome-out method.
Quantification of alternative RNA splicing in whole blood was done using LeafCutter79. The _cis_ association between sequence variants and quantified splicing (_cis_-sQTL) was estimated
using linear regression assuming an additive genetic model and quantile-normalized percentage-spliced-in (PSI) values of each splice junction, adjusting for measurements of sequencing
artefacts, demography variables, and 15 leave-one-chromosome-out PCs of the quantile-normalized PSI matrix. All variants with MAF > 0.2% within 30 Kb of each LeafCutter cluster were
tested. Icelandic plasma samples were collected through two main projects: the Icelandic Cancer Project (52% of participants; samples collected from 2001 to 2005) and various genetic
programs at deCODE genetics, mainly the population-based deCODE Health study. The average participant age was 55 years (SD = 17 years) and 57% were women. In the case of repeated samples for
an individual, one was randomly selected. This left measurements for 39,155 individuals. Of these, 35,892 Icelanders were used in the protein GWASs, because they also had genotype
information80. The plasma samples were measured with SomaScan v4 assay (SomaLogic®). The assay scanned 4,907 aptamers that measure 4719 proteins. Plasma protein levels were standardized and
adjusted for year of birth, sex, and year of sample collection. The plasma levels of a subset of 47,150 individuals in the UK Biobank were measured with the Olink Explore 1536 platform as a
part of the UKB–Pharma Proteomics Project (UK Biobank application no. 65851)81 at Olink’s facilities in Uppsala, Sweden. The majority of the samples were randomly selected across the UK
Biobank. Plasma protein levels were standardized to a normal distribution. We performed gene-based enrichment analysis using the GENE2FUNC tool in FUMA14. The genes on the loci (closest
protein coding gene per locus was prioritized) that met traditional genome-wide significance (_P_ ≤ 5 × 10⁻⁸) in the ET meta-analysis were tested for over-representation in different gene
sets, including Gene Ontology biological processes (MsigDB c5), Reactome (MsigDB c2) and Cell type signatures (MsigDB c8). A Bonferroni test was used for multiple comparison correction.
FAMILIAL CLUSTERING We used family-based method to test rare coding variants for segregation within a pedigree. We focused our search on rare (carried by <30 whole-genome-sequenced
individuals), high-penetrance coding variants that could account for the familial clustering. To test for association, we created a scoring function based on the coding effect of the variant
and its cosegregation with ET, inside and outside of the pedigrees, and used genome-wide simulations to estimate the significance. This method has been described in detail elsewhere82.
ESTIMATION OF GENETIC VARIANCE EXPLAINED We calculated the variance explained (_h_2) using the β and EAF from the ET meta-analysis of each of the independent and significant variant with the
formula _h_2 = β2 × (1-EAF) × 2EAF83. GENETIC CORRELATION Cross-trait LD score regression70 was used to estimate the genetic correlation between the ET meta-analysis and GWAS meta-analyses
of other neurological phenotypes, namely Parkinson’s disease and major depressive disorder. We also estimated the genetic correlation between the ET meta-analysis and 1152 previously
published GWAS traits (_P_ ≤ 3.8 × 10⁻⁵) each with an effective sample size over 5,000 for an unbiased estimate of genetic correlation and heritability. To avoid bias due to sample overlap,
we excluded the UK dataset from the ET meta-analysis. We used results for about 1.2 million well imputed variants, and for LD information we used precomputed LD scores for European
populations (downloaded from: https://data.broadinstitute.org/alkesgroup/LDSCORE/eur_w_ld_chr.tar.bz2). REPORTING SUMMARY Further information on research design is available in the Nature
Portfolio Reporting Summary linked to this article. DATA AVAILABILITY The GWAS summary statistics for the ET meta-analysis are available at https://www.decode.com/summarydata/. Other data
generated or analyzed in this study are included in the article and Supplementary data and information. CODE AVAILABILITY GraphTyper (v2.0-beta, GNU GPLv3 license) at
https://github.com/DecodeGenetics/graphtyper Svimmer (v0.1, GNU GPLv3 license), the structural variant merging software at https://github.com/DecodeGenetics/svimmer SHAPEIT4 (v4.2.2) at
https://odelaneau.github.io/shapeit4/ Eagle2 (v2.4.1) at http://www.hsph.harvard.edu/alkes-price/software/ Beagle (v5.4) at https://faculty.washington.edu/browning/beagle/beagle.html GCTA
(v1.93.3beta2) at https://yanglab.westlake.edu.cn/software/gcta/#Overview STAR (v2.5.3) at http://star.mit.edu/ Kallisto at https://pachterlab.github.io/kallisto/ LeafCutter at
https://davidaknowles.github.io/leafcutter/ LD score regression (first release) at https://github.com/bulik/ldsc qqman package (v0.1.6) at https://github.com/stephenturner/qqman Axiom
genotyping algorithm (v1) at https://www.thermofisher.com/is/en/home.html FUMA at https://fuma.ctglab.nl/ REFERENCES * Louis, E. D. & Ferreira, J. J. How common is the most common adult
movement disorder? Update on the worldwide prevalence of essential tremor. _Mov. Disord._ 25, 534–541 (2010). Article PubMed Google Scholar * Lorenz, D., Poremba, C., Papengut, F.,
Schreiber, S. & Deuschl, G. The psychosocial burden of essential tremor in an outpatient- and a community-based cohort. _Eur. J. Neurol._ 18, 972–979 (2011). Article CAS PubMed Google
Scholar * Bhatia, K. P. et al. Consensus Statement on the Classification of Tremors. From the Task Force on Tremor of the International Parkinson and Movement Disorder Society. _Mov.
Disord._ 33, 75 (2018). Article PubMed Google Scholar * Haerer, A. F., Anderson, D. W. & Schoenberg, B. S. Prevalence of Essential Tremor: Results From the Copiah County Study. _Arch.
Neurol._ 39, 750–751 (1982). Article CAS PubMed Google Scholar * Louis, E. D. et al. Differences in the prevalence of essential tremor among elderly African Americans, whites, and
Hispanics in northern Manhattan, NY. _Arch. Neurol._ 52, 1201–1205 (1995). Article CAS PubMed Google Scholar * Louis, E. D., Fried, L. P., Fitzpatrick, A. L., Longstreth, W. T. &
Newman, A. B. Regional and racial differences in the prevalence of physician-diagnosed essential tremor in the United States. _Mov. Disord._ 18, 1035–1040 (2003). Article PubMed Google
Scholar * Tanner, C. M. et al. Essential tremor in twins: an assessment of genetic vs environmental determinants of etiology. _Neurology_ 57, 1389–1391 (2001). Article CAS PubMed Google
Scholar * Louis, E. D. Etiology of essential tremor: should we be searching for environmental causes? _Mov. Disord._ 16, 822–829 (2001). Article CAS PubMed Google Scholar * Deuschl, G.,
Raethjen, J., Hellriegel, H. & Elble, R. Treatment of patients with essential tremor. _Lancet Neurol._ 10, 148–161 (2011). Article PubMed Google Scholar * Paris-Robidas, S. et al.
Defective dentate nucleus GABA receptors in essential tremor. _Brain_ 135, 105–116 (2012). Article PubMed Google Scholar * Louis, E. D. et al. Neuropathological changes in essential
tremor: 33 cases compared with 21 controls. _Brain_ 130, 3297–3307 (2007). Article PubMed Google Scholar * Liao, C. et al. Association of Essential Tremor With Novel Risk Loci: A
Genome-Wide Association Study and Meta-analysis. _JAMA Neurol._ 79, 185–193 (2022). Article PubMed Google Scholar * Giambartolomei, C. et al. Bayesian Test for Colocalisation between
Pairs of Genetic Association Studies Using Summary Statistics. _PLoS Genet._ 10, e1004383 (2014). Article PubMed PubMed Central Google Scholar * Watanabe, K., Taskesen, E., van Bochoven,
A. & Posthuma, D. Functional mapping and annotation of genetic associations with FUMA. _Nat. Commun._ 8, 1–11 (2017). Article CAS Google Scholar * Nalls, M. A. et al. Identification
of novel risk loci, causal insights, and heritable risk for Parkinson’s disease: a meta-analysis of genome-wide association studies. _Lancet Neurol._ 18, 1091–1102 (2019). Article CAS
PubMed PubMed Central Google Scholar * Howard, D. M. et al. Genome-wide meta-analysis of depression identifies 102 independent variants and highlights the importance of the prefrontal
brain regions. _Nat. Neurosci._ 22, 343–352 (2019). Article CAS PubMed PubMed Central Google Scholar * Ondo, W. Essential Tremor: What We Can Learn from Current Pharmacotherapy. _Tremor
Other Hyperkinetic Mov._ 6, 356 (2016). Article Google Scholar * Magheru, C. et al. Antiepileptic Drugs and Their Dual Mechanism of Action on Carbonic Anhydrase. _J. Clin. Med._ 11, 2614
(2022). Article CAS PubMed PubMed Central Google Scholar * Mouginot, D. & Gähwiler, B. H. Presynaptic GABAB receptors modulate IPSPs evoked in neurons of deep cerebellar nuclei in
vitro. _J. Neurophysiol._ 75, 894–901 (1996). Article CAS PubMed Google Scholar * Shill, H. A. et al. Brain biochemistry in autopsied patients with essential tremor. _Mov. Disord._ 27,
113 (2012). Article CAS PubMed Google Scholar * Chang, S. et al. Complexin stabilizes newly primed synaptic vesicles and prevents their premature fusion at the mouse calyx of held
synapse. _J. Neurosci._ 35, 8272–8290 (2015). Article CAS PubMed PubMed Central Google Scholar * Basso, M. et al. Proteome analysis of human substantia nigra in Parkinson’s disease.
_Proteomics_ 4, 3943–3952 (2004). Article CAS PubMed Google Scholar * Karaca, E. et al. Genes that affect brain structure and function identified by rare variant analyses of Mendelian
neurologic disease. _Neuron_ 88, 499 (2015). Article CAS PubMed PubMed Central Google Scholar * Redler, S. et al. Variants in CPLX1 in two families with autosomal-recessive severe
infantile myoclonic epilepsy and ID. _Eur. J. Hum. Genet._ 25, 889 (2017). Article CAS PubMed PubMed Central Google Scholar * Glynn, D., Drew, C. J., Reim, K., Brose, N. & Morton,
A. J. Profound ataxia in complexin I knockout mice masks a complex phenotype that includes exploratory and habituation deficits. _Hum. Mol. Genet._ 14, 2369–2385 (2005). Article CAS PubMed
Google Scholar * Glynn, D., Sizemore, R. J. & Morton, A. J. Early motor development is abnormal in complexin 1 knockout mice. _Neurobiol. Dis._ 25, 483–495 (2007). Article CAS
PubMed Google Scholar * Simeone, A., Acampora, D., Gulisano, M., Stornaiuolo, A. & Boncinelli, E. Nested expression domains of four homeobox genes in developing rostral brain. _Nature_
358, 687–690 (1992). Article CAS PubMed Google Scholar * Frantz, G. D., Weimann, J. M., Levin, M. E. & McConnell, S. K. Otx1 and Otx2 define layers and regions in developing
cerebral cortex and cerebellum. _J. Neurosci._ 14, 5725–5740 (1994). Article CAS PubMed PubMed Central Google Scholar * Weimann, J. M. et al. Cortical Neurons Require Otx1 for the
Refinement of Exuberant Axonal Projections to Subcortical Targets. _Neuron_ 24, 819–831 (1999). Article CAS PubMed Google Scholar * O’Leary, D. D. M. & Koester, S. E. Development of
projection neuron types, axon pathways, and patterned connections of the mammalian cortex. _Neuron_ 10, 991–1006 (1993). Article PubMed Google Scholar * Bates, C. A. & Killackey, H.
P. The emergence of a discretely distributed pattern of corticospinal projection neurons. _Dev. Brain Res._ 13, 265–273 (1984). Article Google Scholar * Wise, S. P. & Jones, E. G.
Cells of origin and terminal distribution of descending projections of the rat somatic sensory cortex. _J. Comp. Neurol._ 175, 129–157 (1977). Article CAS PubMed Google Scholar *
Gilbert, C. D. & Kelly, J. P. The projections of cells in different layers of the cat’s visual cortex. _J. Comp. Neurol._ 163, 81–105 (1975). Article CAS PubMed Google Scholar *
Acampora, D. et al. Epilepsy and brain abnormalities in mice lacking the Otx1 gene. _Nat. Genet._ 14, 218–222 (1996). Article CAS PubMed Google Scholar * Sandoval-Plata, G., Morgan, K.
& Abhishek, A. Variants in urate transporters, ADH1B, GCKR and MEPE genes associate with transition from asymptomatic hyperuricaemia to gout: results of the first gout versus
asymptomatic hyperuricemia GWAS in Caucasians using data from the UK Biobank. _Ann. Rheum. Dis._ 80, 1220–1226 (2021). Article CAS PubMed Google Scholar * Kamatani, N., Jinnah, H. A.,
Hennekam, R. C. M. & Van Kuilenburg, A. B. P. Purine and Pyrimidine Metabolism. _Emery Rimoin’s Princ. Pract. Med. Genet. Genomics Metab. Disord_. 183–234.
https://doi.org/10.1016/B978-0-12-812535-9.00006-6 (2021). * Málly, J., Baranyi, M. & Vizi, E. S. Change in the concentrations of amino acids in CSF and serum of patients with essential
tremor. _J. Neural Transm._ 103, 555–560 (1996). Article PubMed Google Scholar * Kalia, L. V. & Lang, A. E. Parkinson’s disease. _Lancet_ 386, 896–912 (2015). Article CAS PubMed
Google Scholar * Tarakad, A. & Jankovic, J. Essential Tremor and Parkinson’s Disease: Exploring the Relationship. _Tremor Other Hyperkinetic Mov._ 8, 589 (2018). Article Google Scholar
* Hall, A. & Lalli, G. Rho and Ras GTPases in Axon Growth, Guidance, and Branching. _Cold Spring Harb. Perspect. Biol_. 2, a001818 (2010). * Zhou, Z. et al. Rho GTPase regulation of
α-synuclein and VMAT2: Implications for pathogenesis of Parkinson’s disease. _Mol. Cell. Neurosci._ 48, 29–37 (2011). Article CAS PubMed PubMed Central Google Scholar * Musilli, M. et
al. Therapeutic effects of the Rho GTPase modulator CNF1 in a model of Parkinson’s disease. _Neuropharmacology_ 109, 357–365 (2016). Article CAS PubMed Google Scholar * Louis, E. D.
& Ottman, R. How familial is familial tremor? _Neurology_ 46, 1200 (1996). Article CAS PubMed Google Scholar * Gulcher, J. R. et al. Mapping of a familial essential tremor gene,
FET1, to chromosome 3q13. _Nat. Genet._ 17, 84–87 (1997). Article CAS PubMed Google Scholar * Higgins, J. J., Loveless, J. M., Jankovic, J. & Patel, P. I. Evidence that a gene for
essential tremor maps to chromosome 2p in four families. _Mov. Disord._ 13, 972–977 (1998). Article CAS PubMed Google Scholar * Kovach, M. J. et al. Genetic heterogeneity in autosomal
dominant essential tremor. _Genet. Med._ 3, 197–199 (2001). Article CAS PubMed Google Scholar * Gudbjartsson, D. F. et al. Large-scale whole-genome sequencing of the Icelandic
population. _Nat. Genet._ 47, 435–444 (2015). Article CAS PubMed Google Scholar * Skuladottir, A. T. et al. A genome-wide meta-analysis uncovers six sequence variants conferring risk of
vertigo. _Commun. Biol._ 4, 1–9 (2021). Article Google Scholar * Skuladottir, A. T. et al. A meta-analysis uncovers the first sequence variant conferring risk of Bell’s palsy. _Sci. Rep._
11, 4188 (2021). Article CAS PubMed PubMed Central Google Scholar * Stefansson, H. et al. Variant in the sequence of the LINGO1 gene confers risk of essential tremor. _Nat. Genet._ 41,
277 (2009). Article CAS PubMed PubMed Central Google Scholar * Erikstrup, C. et al. Cohort Profile: The Danish Blood Donor Study. _Int. J. Epidemiol._ 52, e162 (2023). Article PubMed
Google Scholar * Leitsalu, L., Alavere, H., Tammesoo, M. L., Leego, E. & Metspalu, A. Linking a Population Biobank with National Health Registries—The Estonian Experience. _J. Pers.
Med._ 5, 96–106 (2015). Article PubMed PubMed Central Google Scholar * Refsum, H. et al. The Hordaland Homocysteine Study: a community-based study of homocysteine, its determinants, and
associations with disease. _J. Nutr._ 136, 1731S–1740S (2006). Article CAS PubMed Google Scholar * Bycroft, C. et al. The UK Biobank resource with deep phenotyping and genomic data.
_Nature_ 562, 203–209 (2018). Article CAS PubMed PubMed Central Google Scholar * Azriel, E. et al. Utilizing Public Health Frameworks and Partnerships to Ensure Equity in DNA-Based
Population Screening. _Front. Genet._ 13, 886755 (2022). Article CAS PubMed PubMed Central Google Scholar * Tinetti, M. E. Performance-Oriented Assessment of Mobility Problems in
Elderly Patients. _J. Am. Geriatr. Soc._ 34, 119–126 (1986). Article CAS PubMed Google Scholar * Kieburtz, K. Unified Huntington’s disease rating scale: Reliability and consistency.
_Mov. Disord._ 11, 136–142 (1996). Article Google Scholar * Louis, E. D., Ford, B., Lee, H., Andrews, H. & Cameron, G. Diagnostic Criteria for Essential Tremor: A Population
Perspective. _Arch. Neurol._ 55, 823–828 (1998). Article CAS PubMed Google Scholar * Jónsson, H. et al. Data Descriptor: Whole genome characterization of sequence diversity of 15,220
Icelanders. _Sci. Data_ 4, 1–9 (2017). Article Google Scholar * Eggertsson, H. P. et al. Graphtyper enables population-scale genotyping using pangenome graphs. _Nat. Genet._ 49, 1654–1660
(2017). Article CAS PubMed Google Scholar * Eggertsson, H. P. et al. GraphTyper2 enables population-scale genotyping of structural variation using pangenome graphs. _Nat. Commun._ 10,
5402 (2019). Article PubMed PubMed Central Google Scholar * Kong, A. et al. Detection of sharing by descent, long-range phasing and haplotype imputation. _Nat. Genet._ 40, 1068–1075
(2008). Article CAS PubMed PubMed Central Google Scholar * Gudbjartsson, D. F. et al. Sequence variants from whole genome sequencing a large group of Icelanders. _Sci. Data_ 2, 1–11
(2015). Article Google Scholar * Loh, P. R. et al. Reference-based phasing using the Haplotype Reference Consortium panel. _Nat. Genet._ 48, 1443–1448 (2016). Article CAS PubMed PubMed
Central Google Scholar * Browning, S. R. & Browning, B. L. Rapid and Accurate Haplotype Phasing and Missing-Data Inference for Whole-Genome Association Studies By Use of Localized
Haplotype Clustering. _Am. J. Hum. Genet._ 81, 1084–1097 (2007). Article CAS PubMed PubMed Central Google Scholar * Mitt, M. et al. Improved imputation accuracy of rare and
low-frequency variants using population-specific high-coverage WGS-based imputation reference panel. _Eur. J. Hum. Genet._ 25, 869–876 (2017). Article PubMed PubMed Central Google Scholar
* Wain, L. V. et al. Novel insights into the genetics of smoking behaviour, lung function, and chronic obstructive pulmonary disease (UK BiLEVE): A genetic association study in UK Biobank.
_Lancet Respir. Med._ 3, 769–781 (2015). Article PubMed PubMed Central Google Scholar * Welsh, S., Peakman, T., Sheard, S. & Almond, R. Comparison of DNA quantification methodology
used in the DNA extraction protocol for the UK Biobank cohort. _BMC Genomics_ 18, 26 (2017). Article PubMed PubMed Central Google Scholar * Delaneau, O., Zagury, J. F., Robinson, M. R.,
Marchini, J. L. & Dermitzakis, E. T. Accurate, scalable and integrative haplotype estimation. _Nat. Commun._ 10, 1–10 (2019). Article CAS Google Scholar * Bulik-Sullivan, B. et al. LD
score regression distinguishes confounding from polygenicity in genome-wide association studies. _Nat. Genet._ 47, 291–295 (2015). Article CAS PubMed PubMed Central Google Scholar *
Mantel, N. & Haenszel, W. Statistical aspects of the analysis of data from retrospective studies of disease. _J. Natl Cancer Inst._ 22, 719–748 (1959). CAS PubMed Google Scholar *
Sveinbjornsson, G. et al. Weighting sequence variants based on their annotation increases power of whole-genome association studies. _Nat. Genet._ 48, 314–317 (2016). Article CAS PubMed
Google Scholar * Yang, J., Lee, S. H., Goddard, M. E. & Visscher, P. M. GCTA: A tool for genome-wide complex trait analysis. _Am. J. Hum. Genet._ 88, 76–82 (2011). Article CAS PubMed
PubMed Central Google Scholar * Turner, S. qqman: an R package for visualizing GWAS results using Q-Q. _Manhattan plots. J. Open Source Softw._ 3, 731 (2018). Article Google Scholar *
Dobin, A. et al. STAR: ultrafast universal RNA-seq aligner. _Bioinformatics_ 29, 15–21 (2013). Article CAS PubMed Google Scholar * Howe, K. L. et al. Ensembl 2021. _Nucleic Acids Res_
49, D884–D891 (2021). Article CAS PubMed Google Scholar * Bray, N. L., Pimentel, H., Melsted, P. & Pachter, L. Near-optimal probabilistic RNA-seq quantification. _Nat. Biotechnol._
34, 525–527 (2016). Article CAS PubMed Google Scholar * Stegle, O., Parts, L., Piipari, M., Winn, J. & Durbin, R. Using probabilistic estimation of expression residuals (PEER) to
obtain increased power and interpretability of gene expression analyses. _Nat. Protoc._ 7, 500–507 (2012). Article CAS PubMed PubMed Central Google Scholar * Li, Y. I. et al.
Annotation-free quantification of RNA splicing using LeafCutter. _Nat. Genet._ 50, 151–158 (2018). Article CAS PubMed Google Scholar * Ferkingstad, E. et al. Large-scale integration of
the plasma proteome with genetics and disease. _Nat. Genet._ 53, 1712–1721 (2021). Article CAS PubMed Google Scholar * Sun, B. B. et al. Genetic regulation of the human plasma proteome
in 54,306 UK Biobank participants. Prepr. https://doi.org/10.1101/2022.06.17.496443v1 20, (2022) * Steinberg, S. et al. Truncating mutations in RBM12 are associated with psychosis. _Nat.
Genet. 2017 498_ 49, 1251–1254 (2017). CAS Google Scholar * Alves, A. C. et al. GWAS on longitudinal growth traits reveals different genetic factors influencing infant, child, and adult
BMI. _Sci. Adv._ 5, 1–17 (2019). Google Scholar * Kircher, M. et al. A general framework for estimating the relative pathogenicity of human genetic variants. _Nat. Genet._ 46, 310–315
(2014). Article CAS PubMed PubMed Central Google Scholar Download references ACKNOWLEDGEMENTS We thank the participants in this study for their valuable contribution to research. We
thank all investigators and colleagues who contributed to data collection, phenotypic characterization of clinical samples, genotyping, and analysis of the whole-genome association data. The
Estonian dataset was funded by European Union through the European Regional Development Fund Project No. 2014-2020.4.01.15-0012 GENTRANSMED and by Estonian Research Council grant PRG1291.
Data analysis of the Estonian dataset was carried out in part in the High-Performance Computing Center of University of Tartu. This research was conducted using the UK Biobank Resource
(application number 42256). AUTHOR INFORMATION AUTHORS AND AFFILIATIONS * deCODE genetics/Amgen Inc., Reykjavik, Iceland Astros Th. Skuladottir, Lilja Stefansdottir, Gisli H. Halldorsson,
Olafur A. Stefansson, Thorgeir E. Thorgeirsson, G. Bragi Walters, Rosa S. Gisladottir, Gyda Bjornsdottir, Gudrun A. Jonsdottir, Patrick Sulem, Daniel F. Gudbjartsson, Daniel Gudbjartsson,
Hreinn Stefánsson, Unnur Þorsteinsdóttir, Hreinn Stefansson & Kari Stefansson * Faculty of Medicine, University of Iceland, Reykjavik, Iceland Astros Th. Skuladottir, Palmi Jonsson,
Unnur Þorsteinsdóttir & Kari Stefansson * Heilsuklasinn Clinic, Reykjavik, Iceland Anna Bjornsdottir * Department of Geriatric Medicine, Landspitali University Hospital, Reykjavik,
Iceland Palmi Jonsson * Department of Internal Medicine, Landspitali University Hospital, Reykjavik, Iceland Vala Palmadottir * Faculty of Icelandic and Comparative Cultural Studies,
University of Iceland, Reykjavik, Iceland Rosa S. Gisladottir * Faculty of Engineering and Natural Sciences, University of Iceland, Reykjavik, Iceland Daniel F. Gudbjartsson & Daniel
Gudbjartsson * Intermountain Medical Center, Intermountain Heart Institute, Salt Lake City, USA Kirk U. Knowlton * Precision Genomics, Intermountain Healthcare, Saint George, Utah, UK David
A. Jones & Lincoln D. Nadauld * Estonian Genome Centre, Institute of Genomics, University of Tartu, Tartu, Estonia Aigar Ottas, Tõnu Esko, Reedik Mägi, Mari Nelis, Georgi Hudjashov &
Lili A. Milani * Department of Clinical Immunology, Zealand University Hospital, Køge, Denmark Ole B. Pedersen, Jakob Bay, Thorsten Brodersen & Ole Birger Pedersen * Department of
Clinical Medicine, Faculty of Health and Medical Sciences, University of Copenhagen, Copenhagen, Denmark Ole B. Pedersen, Ole Birger Pedersen, Thomas Werge & Sisse Rye Ostrowski *
Department of Clinical Immunology, Copenhagen University Hospital, Righospitale, Copenhagen, Denmark Maria Didriksen, Joseph Dowsett, Bjarke Feenstra, Frank Geller, Rikke Louise Jacobsen,
Margit Anita Hørup Larsen, Christina Mikkelsen, Ioanna Nissen, Michael Schwinn, Erik Sørensen, Lise Wegner Thørner & Sisse Rye Ostrowski * Novo Nordisk Foundation Center for Protein
Research, Faculty of Health and Medical Sciences, University of Copenhagen, Copenhagen, Denmark Søren Brunak, Karina Banasik, Kristoffer Burgdorf, Ioannis Louloudis, Agnete Lundgaard,
Alexander Pil Henriksen & David Westergaard * Danish Headache Center, Department of Neurology, Copenhagen University Hospital, Righospitalet-Glostrup, Copenhagen, Denmark Thomas Folkmann
Hansen, Mona Ameri Chalmer & Lisette Kogelman * Department of Clinical Immunology, Aarhus University Hospital, Righospitalet, Copenhagen, Denmark Christian Erikstrup, Jens Kjærgaard
Boldsen, Khoa Manh Dinh, Lotte Hindhede, Katrine Kaspersen, Bertram Dalskov Kjerulff & Susan Mikkelsen * Department of Clinical Medicine, Faculty of Health and Medical Sciences, Aarhus
University, Aarhus, Denmark Christian Erikstrup * Department of Biomedicine, University of Bergen, Bergen, Norway Jan Haavik * Bergen Center of Brain Plasticity, Division of Psychiatry,
Haukeland University Hospital, Bergen, Norway Jan Haavik * Institute of Clinical Medicine, University of Oslo, Oslo, Norway Ole A. Andreassen * NORMENT, Division of Mental Health and
Addiction, Oslo University Hospital, Oslo, Norway Ole A. Andreassen * Emory Department of Neurology, Wesley Woods Health Center, Atlanta, GA, USA David Rye * Department of Global Public
Health and Primary Care, University of Bergen, Bergen, Norway Jannicke Igland * Department of Health and Caring sciences, Western Norway University of Applied Sciences, Bergen, Norway
Jannicke Igland * Stanford University, School of Medicine, Stanford, CA, USA Lincoln D. Nadauld * Department of Epidemiology Research, Statens Serum Institut, Copenhagen, Denmark Bjarke
Feenstra, Frank Geller & Klaus Rostgaard * Danish Cancer Society Research Center, Copenhagen, Denmark Henrik Hjalgrim & Klaus Rostgaard * Department of Dermatology, Zealand
University hospital, Roskilde, Denmark Gregor Jemec * Department of Clinical Immunology, Aalborg University Hospital, Aalborg, Denmark Bitten Aagaard Jensen * Department of Health Science
and Technology, Faculty of Medicine, Aalborg University, Aalborg, Denmark Mette Nyegaard & Palle Duun Rohde * Department of Clinical Immunology, Odense University Hospital, Odense,
Denmark Mie Topholm Bruun * Statens Serum Institut, Copenhagen, Denmark Henrik Ullum * Institute of Biological Psychiatry, Mental Health Centre, Sct. Hans, Copenhagen University Hospital,
Roskilde, Denmark Thomas Werge Authors * Astros Th. Skuladottir View author publications You can also search for this author inPubMed Google Scholar * Lilja Stefansdottir View author
publications You can also search for this author inPubMed Google Scholar * Gisli H. Halldorsson View author publications You can also search for this author inPubMed Google Scholar * Olafur
A. Stefansson View author publications You can also search for this author inPubMed Google Scholar * Anna Bjornsdottir View author publications You can also search for this author inPubMed
Google Scholar * Palmi Jonsson View author publications You can also search for this author inPubMed Google Scholar * Vala Palmadottir View author publications You can also search for this
author inPubMed Google Scholar * Thorgeir E. Thorgeirsson View author publications You can also search for this author inPubMed Google Scholar * G. Bragi Walters View author publications You
can also search for this author inPubMed Google Scholar * Rosa S. Gisladottir View author publications You can also search for this author inPubMed Google Scholar * Gyda Bjornsdottir View
author publications You can also search for this author inPubMed Google Scholar * Gudrun A. Jonsdottir View author publications You can also search for this author inPubMed Google Scholar *
Patrick Sulem View author publications You can also search for this author inPubMed Google Scholar * Daniel F. Gudbjartsson View author publications You can also search for this author
inPubMed Google Scholar * Kirk U. Knowlton View author publications You can also search for this author inPubMed Google Scholar * David A. Jones View author publications You can also search
for this author inPubMed Google Scholar * Aigar Ottas View author publications You can also search for this author inPubMed Google Scholar * Ole B. Pedersen View author publications You can
also search for this author inPubMed Google Scholar * Maria Didriksen View author publications You can also search for this author inPubMed Google Scholar * Søren Brunak View author
publications You can also search for this author inPubMed Google Scholar * Karina Banasik View author publications You can also search for this author inPubMed Google Scholar * Thomas
Folkmann Hansen View author publications You can also search for this author inPubMed Google Scholar * Christian Erikstrup View author publications You can also search for this author
inPubMed Google Scholar * Jan Haavik View author publications You can also search for this author inPubMed Google Scholar * Ole A. Andreassen View author publications You can also search for
this author inPubMed Google Scholar * David Rye View author publications You can also search for this author inPubMed Google Scholar * Jannicke Igland View author publications You can also
search for this author inPubMed Google Scholar * Sisse Rye Ostrowski View author publications You can also search for this author inPubMed Google Scholar * Lili A. Milani View author
publications You can also search for this author inPubMed Google Scholar * Lincoln D. Nadauld View author publications You can also search for this author inPubMed Google Scholar * Hreinn
Stefansson View author publications You can also search for this author inPubMed Google Scholar * Kari Stefansson View author publications You can also search for this author inPubMed Google
Scholar CONSORTIA ESTONIAN BIOBANK * Tõnu Esko * , Reedik Mägi * , Mari Nelis * & Georgi Hudjashov DBDS GENOMIC CONSORTIUM * Karina Banasik * , Jakob Bay * , Jens Kjærgaard Boldsen * ,
Thorsten Brodersen * , Søren Brunak * , Kristoffer Burgdorf * , Mona Ameri Chalmer * , Maria Didriksen * , Khoa Manh Dinh * , Joseph Dowsett * , Christian Erikstrup * , Bjarke Feenstra * ,
Frank Geller * , Daniel Gudbjartsson * , Thomas Folkmann Hansen * , Lotte Hindhede * , Henrik Hjalgrim * , Rikke Louise Jacobsen * , Gregor Jemec * , Bitten Aagaard Jensen * , Katrine
Kaspersen * , Bertram Dalskov Kjerulff * , Lisette Kogelman * , Margit Anita Hørup Larsen * , Ioannis Louloudis * , Agnete Lundgaard * , Susan Mikkelsen * , Christina Mikkelsen * , Ioanna
Nissen * , Mette Nyegaard * , Sisse Rye Ostrowski * , Ole Birger Pedersen * , Alexander Pil Henriksen * , Palle Duun Rohde * , Klaus Rostgaard * , Michael Schwinn * , Kari Stefansson * ,
Hreinn Stefánsson * , Erik Sørensen * , Unnur Þorsteinsdóttir * , Lise Wegner Thørner * , Mie Topholm Bruun * , Henrik Ullum * , Thomas Werge * & David Westergaard CONTRIBUTIONS A.T.S.,
H.S., and K.S. designed the study. A.T.S., L.S., G.H.H., O.A.S., H.S., and K.S. analyzed the data and interpreted the results. Data collection and subject ascertainment and recruitment was
carried out by A.T.S., A.B., P.J., V.P., and H.S. for the Icelandic dataset, L.A.M. and A.O. for the Estonian dataset, K.U.K., D.A.J., and L.D.N. for the US-INTMT dataset, J.I., J.H., and
O.A.A. for the Norwegian dataset, D.R. for the US-EMORY dataset, and S.R.O., O.B.P., M.D., S.B., K.B., T.F.H., C.E. for the Danish dataset. A.T.S. drafted the manuscript with input and
comments from G.H.H., A.B., G.B.W., R.S.G., G.B., T.E.T., G.A.J., P.S., D.F.G., S.R.O., L.A.M., J.H., O.A.A., J.I., H.S., and K.S. All authors read the final version of the manuscript.
CORRESPONDING AUTHORS Correspondence to Astros Th. Skuladottir or Kari Stefansson. ETHICS DECLARATIONS COMPETING INTERESTS A.T.S., L.S., G.H.H., O.A.S., G.B.W., R.S.G., G.B., T.E.T., G.A.J.,
P.S., D.F.G., H.S., and K.S. are employees of deCODE genetics/Amgen Inc. The remaining authors declare no competing interests. ADDITIONAL INFORMATION PUBLISHER’S NOTE Springer Nature
remains neutral with regard to jurisdictional claims in published maps and institutional affiliations. SUPPLEMENTARY INFORMATION PEER REVIEW FILE SUPPLEMENTARY INFORMATION DESCRIPTION OF
ADDITIONAL SUPPLEMENTARY FILES SUPPLEMENTARY DATA 1-15 REPORTING SUMMARY RIGHTS AND PERMISSIONS OPEN ACCESS This article is licensed under a Creative Commons Attribution 4.0 International
License, which permits use, sharing, adaptation, distribution and reproduction in any medium or format, as long as you give appropriate credit to the original author(s) and the source,
provide a link to the Creative Commons licence, and indicate if changes were made. The images or other third party material in this article are included in the article’s Creative Commons
licence, unless indicated otherwise in a credit line to the material. If material is not included in the article’s Creative Commons licence and your intended use is not permitted by
statutory regulation or exceeds the permitted use, you will need to obtain permission directly from the copyright holder. To view a copy of this licence, visit
http://creativecommons.org/licenses/by/4.0/. Reprints and permissions ABOUT THIS ARTICLE CITE THIS ARTICLE Skuladottir, A.T., Stefansdottir, L., Halldorsson, G.H. _et al._ GWAS meta-analysis
reveals key risk loci in essential tremor pathogenesis. _Commun Biol_ 7, 504 (2024). https://doi.org/10.1038/s42003-024-06207-4 Download citation * Received: 04 December 2023 * Accepted: 17
April 2024 * Published: 26 April 2024 * DOI: https://doi.org/10.1038/s42003-024-06207-4 SHARE THIS ARTICLE Anyone you share the following link with will be able to read this content: Get
shareable link Sorry, a shareable link is not currently available for this article. Copy to clipboard Provided by the Springer Nature SharedIt content-sharing initiative