Engineering medium-range order and polyamorphism in a nanostructured amorphous alloy
- Select a language for the TTS:
- UK English Female
- UK English Male
- US English Female
- US English Male
- Australian Female
- Australian Male
- Language selected: (auto detect) - EN
Play all audios:

ABSTRACT Like crystalline materials, the properties of amorphous materials can be tailored by tuning the local atomic-to-nanoscale structural configurations. Polyamorphism is evident by the
coexistence of kinetically stabilized amorphous structures with tailorable short-to-medium-range orders, providing a viable means to engineer the degree of local order and heterogeneity.
Here, we report experimental evidence of the coexistence of liquid-like and solid-like amorphous phases in a Ni82P18 amorphous alloy with enhanced thermal stability and plasticity prepared
by pulsed electrodeposition. The two amorphous phases, of comparable volume fraction of ~50% each, have similar short-range order but are distinguished by packing at the medium-range length
scale (>6 Å). Upon heating, a structure crossover at ~450 K was observed, where the liquid-like structure transforms to the solid-like structure, as evidenced by the enthalpy release and
an anomalous contraction of atomic structure over the medium-range length scale, due to the metastable nature of the liquid-like structure. SIMILAR CONTENT BEING VIEWED BY OTHERS A
MEDIUM-RANGE STRUCTURE MOTIF LINKING AMORPHOUS AND CRYSTALLINE STATES Article 20 May 2021 SUBSTANTIALLY ENHANCED HOMOGENEOUS PLASTIC FLOW IN HIERARCHICALLY NANODOMAINED AMORPHOUS ALLOYS
Article Open access 20 June 2023 NESTED ORDER-DISORDER FRAMEWORK CONTAINING A CRYSTALLINE MATRIX WITH SELF-FILLED AMORPHOUS-LIKE INNARDS Article Open access 09 August 2022 INTRODUCTION The
structure of amorphous materials is characterized by disorder on the long-range length scale but by local order at short-range to medium-range length scales1,2,3,4. This complexity has led
to some ambiguities in describing these structures, particularly for evolving structures during phase transitions, e.g., glass transitions1,5. To modify the properties of amorphous
materials, it is desirable to develop the ability to tailor the local order in disordered states6,7. However, the structure factor for glassy alloys prepared using conventional methods,
i.e., rapid quenching techniques8,9, usually looks the same: beyond the first sharp diffraction peak, there are several peak maxima propagated at a limited momentum transfer, Q (5–20
Å−1)10,11. Moreover, there is often a right shoulder peak with lower intensity for the second peak maximum12,13, indicating the short-to-extended range structural order. Tailoring local
order based on the temperature parameter in amorphous states is difficult due to the fast critical quenching rate for most metallic glass (MG) alloy systems7,14. Before the first rapidly
quenched glassy alloy was reported in 196015, electrodeposition (ED) had already been employed as a powerful technique for preparing metastable alloys16. The ED amorphous alloys, e.g., the
iron-group alloys17, which are similar to thermally synthesized alloys in structure, have been widely used in electronics applications, such as in computers, space technology, and energy
storage devices, due to their attractive magnetic, mechanical, and chemical properties16,17,18,19. Pulsed ED has been successfully used to prepare Ni–P amorphous alloys20,21. The reported ED
Ni–P amorphous alloys possessed similar diffraction patterns22,23 as that of the MGs but showed nanoscale structure inhomogeneity. The different regions in the ED Ni–P are characterized by
different chemical compositions or packing densities. Presumably, if one can obtain ED Ni–P amorphous alloys of dual phases with appropriate volume fractions by, for example, changing the
parameters during deposition, it could be possible to tailor the packing scheme at medium-range order (MRO) in the amorphous state. Those changes in microstructure would be manifested in the
structure factor, which can be determined using diffraction measurements. Polyamorphous phase transitions (PPTs), including amorphous solid-to-solid (SS)24,25,26,27 phase transition, and
liquid-to-liquid (LL) phase transition28,29,30, are still a debated issue. A PPT has been proposed in a Ni82P18 glass upon heating23,31,32. In this regard, the observation of coexisting
multiple amorphous states at the same time and space33,34 would provide direct evidence for a PPT in amorphous alloys. That being the case, it would be possible to modify the local order in
disordered materials by temperature or pressure-induced PPTs, which should lead to tailorable properties for amorphous materials, such as the thermal stability and mechanical properties7. In
this paper, we demonstrate that Ni82P18 amorphous alloys, prepared using multi-phase pulsed ED within a specific pulse current range20, have a unique structure factor: for the second peak
maximum, there are two sub-peaks with comparable diffraction intensities. The ED Ni82P18 amorphous alloys consist of the following two kinds of amorphous structural components:
nanometer-sized regions with solid-like structure (SLS, the atomic structure of melt-quenched MG-like Ni82P18) and nanometer-sized regions with liquid-like structure (LLS, of loose-packing
compared to a melt-quenched Ni–P ribbon sample). The structure of the ED Ni82P18 amorphous alloy was determined using transmission electron microscopy (TEM) and high-energy synchrotron X-ray
scattering. The composition distribution was characterized by atom probe tomography (APT). Real-space analysis, via pair distribution function (PDF), indicates that the loose-packing
regions in ED Ni82P18 alloys have larger atomic spacing over the medium-range length scale (~6 Å), which is consistent with the features of the difference between liquid and glassy states
for two excellent glass-forming alloys, Zr57Nb5Al10Cu15.4Ni12.6 (Vit 106) and Pd43Cu27Ni10P20, respectively. Simultaneous small-angle/wide-angle X-ray scattering (SAXS/WAXS) reveal a
‘solidification-like’ structure transformation of the ED Ni82P18 alloy upon heating. Finally, compared with the expansion behavior of MG Ni82P18 alloys, an unusual thermal contraction at
medium-range length scale for the LLS of the ED Ni82P18 alloy is demonstrated by PDF analysis. The thermal mechanical analysis (TMA) measurements revealed an anomalous change in the
coefficient of thermal expansion (CTE) for ED Ni82P18 alloy upon heating, further confirming a PPT at ~450 K. Furthermore, the as-prepared ED Ni82P18 amorphous alloys show better thermal
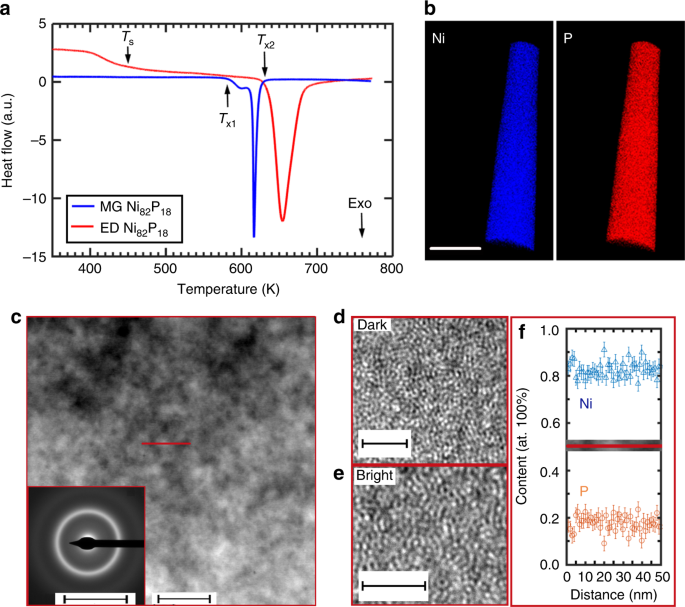
stability and even tensile ductility at the sub-micron scale. RESULTS THERMAL ANALYSIS AND NANOSCALE HETEROGENEITY Figure 1a presents the differential scanning calorimetry (DSC) scans for
the as-prepared MG Ni82P18 ribbons and ED Ni82P18 amorphous alloys. The ED Ni82P18 was prepared using the highest pulse current density (400 mA cm−2) to introduce a different structure.
Supplementary Fig. 1 shows the S(Q) patterns for ED Ni82P18 samples prepared at different pulse current densities. The crystallization temperature _T_X2 for the ED Ni82P18 alloy is ~633 K,
which is ~53 K higher than that of the MG Ni82P18 alloy (_T_X1 ~ 580 K). Surprisingly, there is a thermal release phenomenon at _T_S, ~450 K, for the ED Ni82P18 alloy, which is much lower
than the nominal glass transition temperature (_T_g), ~570 K, for the MG Ni82P18 sample35. The calorimetric studies suggest that there might be a structural change upon heating and the ED
Ni82P18 alloy has much better thermal stability than that of the MG Ni82P18 alloy. The APT results in Fig. 1b illustrate the uniform distribution of the alloying elements (Ni and P) in the
as-deposited ED Ni82P18 alloy. Figure 1c is the high angle annular dark field (HAADF) image acquired in scanning transmission electron microscopy (STEM) mode for the ED Ni82P18 alloy. It
shows variations of mass/thickness contrast ~10–20 nm, indicating that the microstructure of the ED Ni82P18 alloy varies on a nanometer scale. The inset in Fig. 1c is the selective area
electron diffraction (SAED) pattern, which illustrates that the sample is amorphous, with diffuse halos. Figure 1d, e display the HRTEM images for the dark and bright regions in Fig. 1c,
showing typical maze-like amorphous structures. No distinct composition fluctuations were detected on the nanometer scale in the energy-dispersive X-ray spectroscopy (EDS) mapping, as shown
in Fig. 1f. For comparison, Supplementary Fig. 2 illustrates the structural homogeneity using TEM observation for the MG Ni82P18 sample with the same chemical composition. Figure 2a shows
the SAXS profiles for the ED Ni82P18 alloy and the MG Ni82P18 ribbon. A hump at ~0.02 Å−1 in the SAXS log–log plot of the ED Ni–P sample confirms the presence of nanoscale structures in the
ED sample. The model fitting result was obtained based on a simple hard-sphere model. The inset in Fig. 2a shows the intensity variation of SAXS profile for ED Ni82P18, which is much higher
than that of the MG Ni82P18 ribbon sample, suggesting a much stronger scattering contrast for the scattering units in the ED sample. The SAXS profile of the MG alloy is nearly non-existent,
suggesting a homogenous structure (see Supplementary Fig. 2). On the other hand, the SAXS profile of the ED alloy shows a hump at Q ~ 0.02 Å−1, indicating the presence of nanoscale
heterogeneous structures. The SAXS data were analyzed by using the software package IRENA in Igor36. A spheroid model with polydispersity was employed to fit the scattering profile of the ED
alloys. Figure 2b displays the calculated size distribution for the ED sample based on the model fitting in Fig. 2a. It indicates that there are spheroidal granular-like structures with
diameters distributed between 8 and 25 nm. THE EXISTENCE OF LLSS Figure 3a shows the S(Q) patterns of the ED and MG Ni82P18 amorphous alloys. The second peak maximum (Q range: 4.5–7.0 Å−1)
of the S(Q) of the ED amorphous alloy shows two sub-peaks instead of the peak plus a shoulder in the ordinary S(Q) pattern of MGs. As shown in Supplementary Fig. 3, the Rietveld refinement
results of the diffraction patterns for the ED and MG alloys after crystallization illustrate that there are two crystalline products, Ni (space group: Fmmm) and Ni3P (space group: I4), with
almost the same weight percentage. Moreover, Supplementary Fig. 4 shows the S(Q) patterns of MG and ED alloys before and after crystallization. The peak positions for the crystalline
products were superimposed. There are sharp diffraction peaks in S(Q) patterns of the samples after crystallization, which are different from the diffraction patterns of the amorphous
alloys. Figure 3b illustrates the differential reduced PDF pattern, _G_(_r_), obtained by a fast Fourier transform (FFT) of the difference S(Q), which was obtained from ED Ni82P18 alloy
pattern after subtracting 50% of the MG Ni82P18 ribbon pattern. The formation of ED Ni–P amorphous alloys is proposed to consist of nucleation and growth of the amorphous nano-grains20. The
structural model37 of nanostructured amorphous alloys assumes amorphous nano-grains regions and the interface regions between the nano-grains. The atomic structure of the amorphous
nano-grains is MG-like while the boundaries between those nano-grains exhibit a reduced packing density, i.e., higher free volume. Therefore, the change of the diffraction patterns with that
of the deposition parameters in Supplementary Fig. 1 should originate from the increase of the interfacial regions between the amorphous nano-grains. The fitting to the SAXS profile of the
ED Ni82P18 alloy based on the Debye–Bueche (DB) random two-phase model38 illustrates that the volume fraction of the loose-packing regions is ~53%. For comparison, the volume fraction of the
MG-like phase in ED alloy used for calculating the difference S(Q) was estimated to be 50% based on the TEM observation and SAXS pattern fitting. For further details of the DB model
fitting, the readers are referred to the Supplementary Note 1 and Supplementary Fig. 5. Furthermore, Supplementary Fig. 6 demonstrates that a fluctuation in volume fraction within ±10% would
not affect the outcome of the differential _G_(_r_). Figure 3b shows that the PDF peaks for the MG-subtracted pattern shift to a higher value beyond _r_ ~ 6 Å (as indicated by an arrow),
suggesting a MRO with larger atomic spacing. From the comparison of the peak positions of the calculated pattern with those of the MG sample, it can be seen that the first coordination shell
changes little. However, the third coordination shell shifts by ~2.30%. It is noted that the position (6.5–6.7 Å) of the third coordination shell of the MG-subtracted pattern is similar to
the position (~6.6 Å) of the third coordination shell of the Ni81P19 metallic liquid39. To understand the significance of this increase, the peak positions for the third coordination shell
of two representative metallic glass-forming liquids (MGFLs) and their glassy state counterparts: Zr57Nb5Al10Cu15.4Ni12.6 (Vit 106) and Pd43Cu27Ni10P20 were determined. For both alloys, the
first coordination shell changes only slightly, but the higher coordination shells shift significantly. As shown in Supplementary Fig. 7, the calculated differences of the third coordination
shells, between liquid and glassy states, are 2.33% and 2.26%, respectively, for Zr57Nb5Al10Cu15.4Ni12.6 (i.e., Vit 106) and Pd43Cu27Ni10P20. The above results provided evidence for the
existence of a LLS with a different MRO in the ED Ni–P alloy. POLYAMORPHOUS PHASE TRANSITION UPON HEATING To further study the existence of the loosely packed LLSs and to probe the
structural stability, we performed simultaneous SAXS/WAXS study during heating, summarized in Fig. 4. At temperatures above _T_x ~ 633 K, crystallization occurs in the ED Ni82P18 sample as
evidenced by the abrupt appearance of Bragg peaks in the diffraction data, see inset of Fig. 4a. Meanwhile, the SAXS scattering intensity increases when heating above ~633 K. No noticeable
changes in the SAXS profiles were found before crystallization. However, an interference peak40 in the ED Ni82P18 sample appeared after crystallization, and its intensity continuously
increases during heating. Figure 4b shows the plots for the SAXS integrated intensity at a Q range of 0.0049–0.1 Å−1 and the WAXS integrated intensity at a Q range of 5.0191–5.0253 Å−1. The
DSC scan of the ED Ni82P18 alloy is superimposed, which recorded a heat release at _T_S ~ 450 K. The SAXS intensity shows a decrease at temperatures above ~_T_S and a sharp increase at _T_x.
The decrease of the SAXS intensity is attributed to a reduction in the degree of the nano-scale heterogeneity above ~_T_S. Conversely, the WAXS intensity shows an increase upon heating
above ~_T_S. Taken together, these results indicate an accelerated ordering with reduced heterogeneity at these temperatures, which is similar to the behavior of a solidification process of
MGFLs upon cooling41,42. Supplementary Fig. 8 indicates that the WAXS intensity increases during a real solidification process for the Vit 106 MGFL. The DSC scan for the ED Ni82P18 alloy is
consistent with the ‘solidification-like’ scenario. However, as shown in Fig. 1a, there is no such heat release process for the MG Ni82P18 at the temperature of ~_T_S. All the data presented
indicate that there is an accelerated local ordering upon heating due to the existence of abundant loosely packed LLSs. Furthermore, the WAXS patterns upon heating also rule out that
crystallization occurs at ~_T_S. Supplementary Fig. 9 shows the HRTEM results for ED Ni82P18 when heating above 600 K (between _T_S and _T_x), and present an additional confirmation of the
amorphous nature of ED Ni–P alloys in this temperature range. These results indicate that the LLS is a metastable structure, which continues to settle during heating. Moreover, the TEM and
diffraction results confirmed that the crystallization of MG Ni82P18 sample (not shown here) starts already at ~580 K, a much lower temperature, confirming the better thermal stability of
the ED Ni82P18 alloy compared to the MG Ni82P18 alloy. REAL SPACE STRUCTURE ANALYSIS AND NEGATIVE THERMAL EXPANSION Figure 5 shows the structure evolution in real-space for ED Ni82P18 and MG
Ni82P18 alloys upon heating. Figure 5a, b are _G_(_r_) profiles for ED and MG Ni82P18 samples, respectively. Arrows indicate the first R1 and third R3 coordination shells. The differential
_G_(_r_) profiles for both samples, as shown in Supplementary Fig. 10a, b, were obtained by subtracting the first pattern at room temperature. By tracking the position change of R1 and R3
for both samples, the structure evolution at short-range and medium-range length scales can be visualized. As shown in Fig. 5c, the peak position of R1 increases, as expected from the
results of thermal expansion measurements. However, the peak position of R3 decreases, showing a contraction upon heating. As indicated by the arrow in Supplementary Fig. 10a, the behavior
of the higher coordination shells beyond R3 is similar to that of R3 during heating. For comparison, the peak positions of R1 and R3 for MG Ni82P18 samples were also plotted in Fig. 5d. Both
are expanding during heating, as expected. Figure 6 presents the thermal expansion data for ED and MG Ni82P18 alloys. The MG Ni82P18 exhibits a linear expansion upon heating. However, the
ED Ni82P18 shows an anomalous expansion behavior at ~_T_S during heating. The CTE of the ED Ni82P18 decreases below _T_S and approaches the lowest value of ~−3 × 10⁻⁶ K−1, before starting to
increase. The valley in the CTE curve for the ED Ni82P18 amorphous alloy is exactly at the temperature ~_T_S. This anomalous thermal expansion behavior is an additional confirmation of the
PPT at _T_S, consistent with the thermal contraction of the atomic structure at MRO for ED Ni82P18 measured by synchrotron X-ray diffraction, as illustrated in Fig. 5c. DISCUSSION One of the
challenges in order to prove the existence of the PPT is whether kinetically stabilized polyamorphous structures can co-exist. Ni82P18 amorphous alloys with a nanometer-sized microstructure
(called ED Ni82P18 alloys), characterized by two sub-peaks in the second maximum of structure factor, can be prepared by changing the pulse current density based on ED (Supplementary Fig.
1)20,23,43. The ED Ni82P18 alloys were found to contain LLSs with abundant loosely packed regions of increased free volume. The main evidence is revealed by the differential PDF, as the
higher-order coordination shells show larger distance between atomic pairs, ~2.3% larger relative to the MG counterparts, which is similar to the situation of ‘real’ MGFLs as compared to
their glass states. The volume fraction of LLSs in ED Ni82P18 alloys was found to be ~50% by SAXS measurements, consistent with TEM observations. As shown in Fig. 1, although EDS mapping and
3D APT mapping did not resolve noticeable compositional variations at the nanoscale, HAADF in STEM mode showed bright/dark regions, indicating the existence of phases with different
densities. The phases with smaller density appear as dark regions in the HAADF images because of their lower density, potentially leading to faster polishing during the thinning process of
TEM sample44,45. In summary, the experimental results confirm the coexistence of two amorphous phases with comparable volume fractions but different packing schemes at MRO in ED Ni82P18
alloys. Due to the presence of LLSs, the ED Ni82P18 alloys exhibit a ‘solidification-like’ accelerated local ordering upon heating. As shown by the SAXS/WAXS experimental data in Fig. 4, the
structure change for the ED Ni82P18 alloys at _T_S is similar to the one for the real metallic liquids at _T_*, a liquid–liquid phase transition (LLPT) temperature (Supplementary Fig. 8),
i.e., at medium-range length scale. The ‘solidification-like’ ordering process upon heating is likely due to the relaxation of the local structure by the fast dynamics in the LLS and the
annihilation of excessive free volume. Hyperquenched MGs46,47 and nanostructured Sc–Fe nanoglass38 prepared by inert gas condensation (IGC) were reported to have an excess free volume.
Glasses prepared by these two processing routes are characterized by an enthalpy release peak below the glass transition, which is similar to the anomalous heat release process at _T_S for
the ED Ni82P18 alloys upon heating. A structure transition temperature at ~430 K has been proposed in Ni81P19 glasses32, which varies by 20 K from the _T_S, ~450 K observed in the present
study. The difference may be caused by the composition difference and/or the different sample production conditions, such as quenching temperature31. Recently, a cluster ordering process
scenario has been proposed to explain the free volume annihilation process for hyperquenched MGs and Sc–Fe nanoglass prepared by IGC38,46,47. Thus, the structural change at ~_T_S observed in
the present study suggests that the anomalous thermal behavior of Ni82P18 at _T_S is analogous to a transition from ‘LLS-to-SLS’ upon heating. The anomalous thermal contraction of ED
Ni82P18 at higher coordination shells provided further evidence of the existence of a LLS at room temperature and suggested that the ED Ni82P18 alloys have controllable MRO structure. The
transition point during the thermal contraction is at ~_T_S. The thermal contraction for the ED Ni82P18 sample at the MRO is consistent with the structural features of the LLS as discussed
earlier. The unusual change in the MRO structure in ED Ni82P18 further indicates that there is a PPT from a less dense LLS to a denser SLS. The CTE measurements have often been used to
identify ‘first-order’ phase transitions in condensed matter48,49,50. The anomalous change of CTE of the ED Ni82P18 amorphous alloy by the TMA measurements confirmed the PPT at ~_T_S, as
shown in Fig. 6. The thermal expansion of the ED Ni82P18 shows a transition point at _T_S, where the CTE of ED Ni82P18 alloy is ~zero. Upon heating to ~_T_S, the SLS in ED Ni82P18 alloy
shows thermal expansion, while the LLS shows a contraction. The cancellation of the positive and negative thermal expansions by different phases could result in a ~zero thermal expansion in
ED Ni82P18 amorphous alloys. By changing the volume fraction of the SLSs and LLSs with varied MRO, it is possible to design amorphous alloys with tailorable thermal expansion behavior. The
crystallization temperature (_T_X2) of the ED Ni82P18 amorphous alloy is higher than that (_T_X1) of the MG Ni82P18 amorphous alloy, suggesting higher stability of the ED amorphous alloys.
Furthermore, it was also found by additional in situ diffraction studies (not shown here) that, at the same annealing temperature, the time to crystallization in the ED Ni82P18 amorphous
alloy is much longer than that in the MG Ni82P18 alloy. As shown in Supplementary Fig. 11, although the final crystalline products are identical (Fig. S3) for both alloys, the structure of
the ED Ni82P18 alloy at medium-range scale (e.g., ~5.57 Å) starts to relax before crystallization. However, there is no such relaxation process for the MG Ni82P18 alloy. The relaxation of
before crystallization also means that ED samples are more stable. Recently, a thermodynamic scenario for nanostructured glasses prepared by IGC has been proposed, where the free energy of
the interfacial regions between the MG particles are described as a lower energy amorphous state compared to the MG state51. It has been shown that the MGs after the occurrence of LLPT often
showed better stability28,30,52. These studies suggested that it is easier for the amorphous structure to approach the lowest energy state after relaxation53,54,55. These structural
differences can lead to a dramatic change in other macroscopic properties. Here we also would like to point out that the differences in structure and changes upon annealing also result in
differences in the mechanical properties of these alloys, with ED Ni82P18 alloys displaying improved ductility. As shown in Supplementary Fig. 12 and Supplementary Note 2, in situ TEM
tensile tests for MG Ni82P18 and ED Ni82P18 alloys were conducted at room temperature. The MG Ni82P18 is relatively brittle while the ED Ni82P18 shows an improved tensile ductility. The
structural origin of this difference could be attributed to the coexistence of LLSs and SLSs of comparable volume fractions in the ED alloy, which do not exist in the MG alloy. Therefore,
the unique microstructure in the ED Ni82P18 alloy may play an important role in the supercooled-liquid-like deformation behavior56,57 observed in this material. In conclusion, the
coexistence of liquid-like and SLSs with comparable volume fractions but different packing schemes at medium-range length scale has been established in ED Ni82P18 amorphous alloys, using
calorimetry, electron microscopy, PDF analysis, and simultaneous SAXS/WAXS during heating. The ED Ni82P18 alloy possesses a unique structure factor featuring two distinct maxima intensities
in the region of the second diffraction peak, both of comparable diffraction intensity. The loosely packed LLS within these regions was characterized by a larger atomic spacing at
medium-range length scale, as revealed by the differential PDF profile. The observed structure change at temperature ~_T_S provides evidence of an ‘LLS-to-SLS’ transition upon heating. The
anomalous thermal expansion behavior, contracting at MRO and nearly zero CTE at _T_S, is consistent with the scenario of a polyamorphous phase transition at ~_T_S, indicating that the ED
Ni–P alloys have tailorable MRO. Moreover, the ED Ni–P amorphous alloys have better thermal stability against crystallization and exhibit improved tensile ductility. These results suggest
strategies to tailor the macroscopic properties of amorphous alloys, via MRO structural engineering, through the use of ED techniques. METHODS SAMPLE PREPARATION ED Ni82P18 alloys were
prepared using a multi-phase pulsed ED method. The bath compositions contain 200 g L−1 NiSO4·6H2O, 25 g L−1 NiCl2·6H2O, and 15 g L−1 H3PO3. Boric acid (H3BO3) was added as supporting
electrolytes and pH buffer. The ED was carried out at 60 °C and pH = 1.2. The applied voltage was varied during the ED process in the form of three steps. During the first step, a high
current density of 400 mA cm−2 was applied for _t_on1 = 1 ms. The second step consisted of the application of a lower current density (50–400 mA cm−2) for _t_on2 = 19 ms. During the third
and last step, the current was turned off for _t_off = 20 ms. This procedure was repeated for the total deposition time of 1–3 h. Supplementary Fig. 1 shows the structure factor patterns for
different alloys prepared using different current densities. For additional details, we refer to Guo et al. 20. MG Ni82P18 ribbons with the same composition as ED Ni82P18 alloys were
prepared using melt-spinning with a wheel speed of ~30 m s−1 under high-purity argon atmosphere, on to a single copper wheel at 4000 r.p.m. TRANSMISSION ELECTRON MICROSCOPY TEM foils are
prepared using the twin-jet electropolishing method. The instrument for electropolishing is the automatic twin-jet electro-polisher (Fischione Model 110). The electrolyte using for
electro-polishing is 16% perchloric acid, 42% acetic acid, and 42% methanol. Polishing parameters are set as voltage ~20 V, and current is ~40 mA. The electropolishing was performed at ~233
K. Details of the TEM sample preparation using electropolishing can also refer to refs. 44,45. FEI TF 20 high-resolution TEM (high voltage 200 kV) was employed. Drift-correction mode during
EDS mapping in HAADF/STEM mode was used to eliminate the experimental error. The nano-probe with resolution ~1 nm was used for EDS mapping. DIFFERENTIAL SCANNING CALORIMETRY The DSC curves
during heating were measured using platinum crucibles with Netzsch DSC 404 F3 in a high-purity Ar atmosphere. The weight of the samples for DSC is ~20 mg. The heating rate is 10 K min−1. PDF
ANALYSIS Synchrotron high-energy X-ray experiments for PDF analysis were conducted at beamline 11-ID-C at the Advanced Photon Source, Argonne National Laboratory. High energy X-rays with a
beam size of 0.5 mm × 0.5 mm and wavelength of 0.10804 Å were used in transmission geometry for data collection. Two-dimensional (2D) diffraction patterns were obtained using a Perkin Elmer
amorphous silicon detector. The data acquisition time for each pattern is 1 s. In situ heating was performed using a Linkam TS 1500 stage purified by high-purity Argon flow. A graphite
crucible was employed for X-ray diffraction measurements of high-temperature melts. To improve the statistics of the data, 100 patterns were acquired for data averaging. The static structure
factor, S(Q) with Qmax ~ 30 Å−1, was derived from the scattering data by masking bad pixels, integrating images, subtracting the appropriate background and correcting for oblique incidence,
absorption, multiple scattering, fluorescence, Compton scattering, Laue correction using Fit2D and PDFgetX2. SIMULTANEOUS SAXS/WAXS Simultaneous SAXS/WAXS experiments were performed at the
beamline1-ID-E at the Advanced Photon Source, Argonne National Laboratory. A conventional SAXS/WAXS detector array was used. High-energy X-rays with a beam size of 0.1 mm × 0.1 mm and
wavelength of 0.17711 Å were used in transmission geometry for data collection. Two-dimensional (2D) diffraction patterns were obtained using four combination GE detectors. A 2D PIXRAD
detector was used for SAXS measurements. In situ heating was performed using a Linkam TS1500 stage with purification by high purity Argon flow. The heating rate is ~10 K min−1. The data
acquisition time for each pattern is 1 s. However, including the time for saving data, the total acquisition time is ~5 s for each pattern. The static structure factor, S(Q) with Q range
from 2 to 15.5 Å−1, was derived from the scattering data by masking bad pixels, integrating images, subtracting the appropriate background and correcting for oblique incidence, absorption,
multiple scattering, fluorescence, Compton scattering, Laue correction using Fit2D and PDFgetX2. SAXS profiles with Q range from 0.0049 to 0.1686 Å−1 were reduced with data corrected for
empty cell scattering, transmission, and detector response using a beamline MATLAB script. IN SITU TEM TENSILE TESTS In situ TEM tensile test was conducted using the Hysitron PI 95 TEM
Pico-Indenter. The T-shaped specimens were prepared from the ED and MG Ni82P18 parent body by focused-ion-beam (FIB). The sample evolution during the tests was recorded in movies. The
methods for details can refer to the Tian et al.58. A total of 10 specimens were tested to confirm the observed tensile plasticity of NG Ni82P18 alloys. THERMAL EXPANSION Thermal expansion
measurements were conducted in tensile mode using NETZSCH TMA 402F3. The sample is 15, 5, and 0.035 mm in length, in width, and in thickness, respectively. Before the experiment of the Ni–P
samples, a standard sample, Al2O3, was employed for calibration of the instrument. Subsequently, a pre-set load force of 0.010 N was applied during the entire test with a nitrogen flow at a
flow rate of 20 ml min−1. The heating rate was 20 K min−1, over a temperature range of 303–723 K. DATA AVAILABILITY The data that support the findings of this study are available from the
corresponding author upon request. REFERENCES * Angell, C. A. Glass-formers and viscous liquid slowdown since David Turnbull: enduring puzzles and new twists. _MRS Bull._ 33, 544–555 (2008).
Article Google Scholar * Miracle, D. B. A structural model for metallic glasses. _Nat. Mater._ 3, 697–702 (2004). Article ADS Google Scholar * Weintraub, H. et al. Through the glass
lightly. _Science_ 267, 1609–1618 (1995). Article Google Scholar * Sheng, H. W., Luo, W. K., Alamgir, F. M., Bai, J. M. & Ma, E. Atomic packing and short-to-medium-range order in
metallic glasses. _Nature_ 439, 419–425 (2006). Article ADS Google Scholar * Berthier, L. & Biroli, G. Theoretical perspective on the glass transition and amorphous materials. _Rev.
Mod. Phys._ 83, 587–645 (2011). Article ADS Google Scholar * Plummer, J. & Johnson, W. L. Is metallic glass poised to come of age? _Nat. Mater._ 14, 553–555 (2015). Article Google
Scholar * Ma, E. Tuning order in disorder. _Nat. Mater._ 14, 547–552 (2015). Article ADS Google Scholar * Chen, M. W. A brief overview of bulk metallic glasses. _NPG Asia Mater._ 3,
82–90 (2011). Article Google Scholar * Peker, A. & Johnson, W. L. A highly processable metallic glass: Zr41.2Ti13.8Cu12.5Ni10.0Be22.5. _Appl. Phys. Lett._ 63, 2342–2344 (1993). Article
ADS Google Scholar * Ma, D., Stoica, A. D. & Wang, X. L. Power-law scaling and fractal nature of medium-range order in metallic glasses. _Nat. Mater._ 8, 30–34 (2009). Article ADS
Google Scholar * Mattern, N., Stoica, M., Vaughan, G. & Eckert, J. Thermal behaviour of Pd40Cu30Ni10P20 bulk metallic glass. _Acta Mater._ 60, 517–524 (2012). Article Google Scholar *
Mauro, N. A., Blodgett, M., Johnson, M. L., Vogt, A. J. & Kelton, K. F. A structural signature of liquid fragility. _Nat. Commun._ 5, 4616 (2014). Article ADS Google Scholar *
Kelton, K. F. et al. First x-ray scattering studies on electrostatically levitated metallic liquids: demonstrated influence of local icosahedral order on the nucleation barrier. _Phys. Rev.
Lett._ 90, 195504 (2003). Article ADS Google Scholar * Hirata, A. et al. Geometric frustration of icosahedron in metallic glasses. _Science_ 341, 376–379 (2013). Article ADS Google
Scholar * Klement, W., Willens, R. H. & Duwez, P. Non-crystalline structure in solidified gold–silicon alloys. _Nature_ 187, 869–870 (1960). Article ADS Google Scholar * Brenner, A.,
Couch, D. E. & Williams, E. K. Electrodeposition of alloys of phosphorus with nickel or cobalt. _J. Res. Natl Bur. Stand._ 44, 109–122 (1950). Article Google Scholar * Djokić, S. S.
Electrodeposition of amorphous alloys based on the iron group of metals. _J. Electrochem. Soc._ 146, 1824–1828 (1999). Article Google Scholar * Pillai, A. M., Rajendra, A. & Sharma, A.
K. Electrodeposited nickel–phosphorous (Ni–P) alloy coating: an in-depth study of its preparation, properties, and structural transitions. _J. Coat. Technol. Res._ 9, 785–797 (2012).
Article Google Scholar * Bakonyi, I. et al. Magnetic properties of electrodeposited, melt-quenched, and liquid Ni–P alloys. _Phys. Rev. B_ 47, 14961–14976 (1993). Article ADS Google
Scholar * Guo, C. Y. et al. Ni–P nanoglass prepared by multi-phase pulsed electrodeposition. _Mater. Res. Lett._ 5, 293–299 (2017). Article ADS Google Scholar * Zoikis-Karathanasis, A.,
Pavlatou, E. A. & Spyrellis, N. Pulse electrodeposition of Ni–P matrix composite coatings reinforced by SiC particles. _J. Alloy. Compd._ 494, 396–403 (2010). Article Google Scholar *
Steeb, S. & Lamparter, P. Structure of binary metallic glasses. _J. Non-Cryst. Solids_ 156-158, 24–33 (1993). Article Google Scholar * Calvo-Dahlborg, M., Machizaud, F., Nhien, S.,
Vigneron, B. & Dahlborg, U. Structural study of a phase transition in a NiP metallic glass. _Mater. Sci. Eng._ A226-228, 197–203 (1997). Article Google Scholar * Sheng, H. W. et al.
Polyamorphism in a metallic glass. _Nat. Mater._ 6, 192–197 (2007). Article ADS Google Scholar * Fedotov, V. K. et al. Solid-state amorphization of a quenched high-pressure GaSb phase
studied by real-time neutron diffraction: evolution of the crystalline phase. _J. Phys.-Condens. Mater._ 21, 045402 (2009). Article ADS Google Scholar * Calvo-Dahlborg, M. et al. Neutron
scattering study of bulk amorphous GaSb. _J. Non-Cryst. Solids_ 244, 250–259 (1999). Article ADS Google Scholar * Antonov, V. E. et al. Phase transformations of the amorphous Zn–Sb alloy
under high pressures. _Int. J. High Press. Res._ 17, 261 (2000). Article ADS Google Scholar * Xu, W. et al. Evidence of liquid–liquid transition in glass-forming La50Al35Ni15 melt above
liquidus temperature. _Nat. Commun._ 6, 7696 (2015). Article ADS Google Scholar * Wei, S. et al. Liquid–liquid transition in a strong bulk metallic glass-forming liquid. _Nat. Commun._ 4,
2083 (2013). Article ADS Google Scholar * Lan, S. et al. Hidden amorphous phase and reentrant supercooled liquid in Pd–Ni–P metallic glasses. _Nat. Commun._ 8, 14679 (2017). Article ADS
Google Scholar * Dahlborg, U. & Calvo-Dahlborg, M. Influence of the production conditions on the structure and the microstructure of metallic glasses studied by neutron scattering.
_Mater. Sci. Eng.: A_ 283, 153–163 (2000). Article Google Scholar * Calvo-Dahlborg, M., Dahlborg, U. & Ruppert, J. Influence of superheat before quench on the structure and stability
of NiP metallic glasses studied by neutron scattering techniques. _J. Non-Cryst. Solids_ 357, 798–808 (2011). Article ADS Google Scholar * Corb, B. W., O’Handley, R. C., Megusar, J. &
Grant, N. J. First-order, structural transformations in metallic glasses. _Phys. Rev. Lett._ 51, 1386–1389 (1983). Article ADS Google Scholar * Lo, Y. F., Wang, X. C., Wu, Z. D., Zhou,
W. Z. & Kui, H. W. Direct imaging of a first-order liquid-liquid phase transition in undercooled molten Pd–Ni–P alloys and its thermodynamic implications. _J. Non-Cryst. Solids_ 472,
75–85 (2017). Article ADS Google Scholar * Chen, H., Krause, J. & Coleman, E. Elastic constants, hardness and their implications to flow properties of metallic glasses. _J. Non-Cryst.
Solids_ 18, 157–171 (1975). Article ADS Google Scholar * Ilavsky, J. & Jemian, P. R. Irena: tool suite for modeling and analysis of small-angle scattering. _J. Appl. Crystallogr._
42, 347–353 (2009). Article Google Scholar * Gleiter, H., Schimmel, T. & Hahn, H. Nanostructured solids—from nano-glasses to quantum transistors. _Nano Today_ 9, 17–68 (2014). Article
Google Scholar * Fang, J. et al. Atomic structure and structural stability of Sc75Fe25 nanoglasses. _Nano Lett._ 12, 458–463 (2011). Article ADS Google Scholar * Dahlborg, U. et al.
Temperature and time dependent structure of the molten Ni81P19 alloy by neutron diffraction. _J. Non-Cryst. Solids_ 500, 359–365 (2018). Article ADS Google Scholar * Yang, L. et al.
Nanoscale solute partitioning in bulk metallic glasses. _Adv. Mater._ 21, 305–308 (2009). Article Google Scholar * Lan, S. et al. Structural crossover in a supercooled metallic liquid and
the link to a liquid-to-liquid phase transition. _Appl. Phys. Lett._ 108, 221907 (2016). Article Google Scholar * Wessels, V. et al. Rapid chemical and topological ordering in supercooled
liquid Cu46Zr54. _Phys. Rev. B_ 83, 094116 (2011). Article ADS Google Scholar * Lu, X. L., Li, Y. & Lu, L. Co-existence of homogeneous flow and localized plastic deformation in
tension of amorphous Ni-P films on ductile substrate. _Acta Mater._ 106, 182–192 (2016). Article ADS Google Scholar * Lan, S., Yip, Y. L., Lau, M. T. & Kui, H. W. Direct imaging of
phase separation in Pd41.25Ni41.25P17.5 bulk metallic glasses. _J. Non-Cryst. Solids_ 358, 1298–1302 (2012). Article ADS Google Scholar * Lan, S., Wu, Z. D., Lau, M. T. & Kui, H. W.
Crystallization in homogeneous and phase-separated Pd41.25Ni41.25P17.5 bulk metallic glasses. _J. Non-Cryst. Solids_ 373, 5–12 (2013). Article ADS Google Scholar * Hu, L. N., Zhou, C.,
Zhang, C. Z. & Yue, Y. Z. Thermodynamic anomaly of the sub-T-g relaxation in hyperquenched metallic glasses. _J. Chem. Phys._ 138, 174508 (2013). Article ADS Google Scholar * Zhu, F.
et al. Intrinsic correlation between β-relaxation and spatial heterogeneity in a metallic glass. _Nat. Commun._ 7, 11516 (2016). Article ADS Google Scholar * Ran, S. et al. Phase diagram
and thermal expansion measurements on the system URu2−xFexSi2. _Proc. Natl Acad. Sci. USA_ 113, 13348–13353 (2016). Article ADS Google Scholar * Ahadi, A., Matsushita, Y., Sawaguchi, T.,
Sun, Q. & Tsuchiya, K. Origin of zero and negative thermal expansion in severely-deformed superelastic NiTi alloy. _Acta Mater._ 124, 79–92 (2017). Article Google Scholar * Pachoud,
E., Cumby, J., Lithgow, C. T. & Attfield, J. P. Charge order and negative thermal expansion in V2OPO4. _J. Am. Chem. Soc._ 140, 636–641 (2018). Article Google Scholar * Ivanisenko, Y.
et al. Structure and properties of nanoglasses. _Adv. Eng. Mater._ 20, 1800404 (2018). Article Google Scholar * Wu, Z. W., Li, M. Z., Wang, W. H. & Liu, K. X. Hidden topological order
and its correlation with glass-forming ability in metallic glasses. _Nat. Commun._ 6, 6035 (2015). Article ADS Google Scholar * Lu, K. & Wang, J. On Avrami exponent for
crystallization of NiP glass. _Scr. Met. Mater._ 21, 1185–1188 (1987). Article Google Scholar * Wang, J. Q. et al. The ultrastable kinetic behavior of an Au-based nanoglass. _Acta Mater._
79, 30–36 (2014). Article Google Scholar * Cao, C. R. et al. Ultrahigh stability of atomically thin metallic glasses. _Appl. Phys. Lett._ 105, 095304 (2014). Google Scholar * Adibi, S.,
Branicio, P. S. & Joshi, S. P. Suppression of shear banding and transition to necking and homogeneous flow in nanoglass nanopillars. _Sci. Rep.-Uk_ 5, 15611 (2015). Article ADS Google
Scholar * Lu, Y. et al. In-situ atomic force microscopy observation revealing gel-like plasticity on a metallic glass surface. _J. Appl. Phys._ 121, 095304 (2017). Article ADS Google
Scholar * Tian, L. et al. Approaching the ideal elastic limit of metallic glasses. _Nat. Commun._ 3, 609 (2012). Article ADS Google Scholar Download references ACKNOWLEDGEMENTS We
acknowledge Dr. Lin Tian for the in situ TEM tensile tests. We also would like to give our thanks to Dr. Chellali Mohammed Reda for the APT measurement with the support of the Karlsruhe Nano
Micro Facility. We acknowledge Mr. Shu Fu for the Rietveld refinement. This work was supported by the National Natural Science Foundation of China (Grant nos. 51871120, 51520105001,
51571119, 51571170, 51501090), the Natural Science Foundation of Jiangsu Province (Grant no. BK20171425), and the Fundamental Research Funds for the Central Universities (Grant nos.
30919011107, 30915015103, 30916011106). T.F. acknowledges the support from the innovation project, Qing Lan project and the distinguished professor project of Jiangsu province. X.-L.W. is
supported by a grant from the Research Grants Council of the Hong Kong Special Administrative Region, China (Project no. CityU 11216215). H.H. is thankful to the Deutsche
Forschungsgemeinschaft (DFG) for financial support under HA 1344/30-2. This research used the resources of the Advanced Photon Source, a US Department of Energy (DOE) Office of Science User
Facility operated for the DOE Office of Science by Argonne National Laboratory under Contract no. DE-AC02-06CH11357. AUTHOR INFORMATION AUTHORS AND AFFILIATIONS * Herbert Gleiter Institute
of Nanoscience, School of Materials Science and Engineering, Nanjing University of Science and Technology, 200 Xiaolingwei Avenue, Nanjing, 210094, China Si Lan, Chunyu Guo, Chaoqun Pei,
Horst Hahn, Tao Feng & Herbert Gleiter * Department of Physics, City University of Hong Kong, 83 Tat Chee Avenue, Kowloon, Hong Kong, SAR, China Si Lan & Xun-Li Wang * Centre for
Advanced Structural Materials, City University of Hong Kong, Shenzhen Research Institute, 8 Yuexing 1st Road, Shenzhen Hi-Tech Industrial Park, Nanshan District, Shenzhen, 518057, China
Wenzhao Zhou * X-ray Science Division, Argonne National Laboratory, Argonne, IL, 60439, USA Yang Ren & Jon Almer * Institute of Nanotechnology, Karlsruhe Institute of Technology (KIT),
76021, Karlsruhe, Germany Horst Hahn & Herbert Gleiter * Center for Advanced Structural Materials & Department of Materials Science and Engineering, City University of Hong Kong, 83
Tat Chee Avenue, Kowloon, Hong Kong, SAR, China Chain-Tsuan Liu * Center for Neutron Scattering, City University of Hong Kong, Shenzhen Research Institute, 8 Yuexing 1st Road, Shenzhen
Hi-Tech Industrial Park, Nanshan District, Shenzhen, 518057, China Xun-Li Wang Authors * Si Lan View author publications You can also search for this author inPubMed Google Scholar * Chunyu
Guo View author publications You can also search for this author inPubMed Google Scholar * Wenzhao Zhou View author publications You can also search for this author inPubMed Google Scholar *
Yang Ren View author publications You can also search for this author inPubMed Google Scholar * Jon Almer View author publications You can also search for this author inPubMed Google
Scholar * Chaoqun Pei View author publications You can also search for this author inPubMed Google Scholar * Horst Hahn View author publications You can also search for this author inPubMed
Google Scholar * Chain-Tsuan Liu View author publications You can also search for this author inPubMed Google Scholar * Tao Feng View author publications You can also search for this author
inPubMed Google Scholar * Xun-Li Wang View author publications You can also search for this author inPubMed Google Scholar * Herbert Gleiter View author publications You can also search for
this author inPubMed Google Scholar CONTRIBUTIONS S.L., T.F. and X.-L.W. designed the project; C.Y.G. and T.F. prepared the electrodeposited NG Ni–P alloys; S.L. and Y.R. performed
synchrotron X-ray diffraction experiments at 11-ID-C of APS, ANL; S.L., X.-L.W. and J.A. performed the simultaneous SAXS/WAXS measurements at 1-ID-E of APS, ANL; S.L. and X.-L.W. analyzed
the scattering data; S.L. and W.Z.Z. performed the TEM study; C.Q.P. and T.F. did the thermal expansion tests; T.F., S.L., X.-L.W. and Y.R. analyzed the TMA data; S.L., T.F., X.-L.W., H.H.,
C.-T.L. and H.G. wrote the paper. All authors analyzed and reviewed the results and provided input to this paper. CORRESPONDING AUTHORS Correspondence to Tao Feng or Xun-Li Wang. ETHICS
DECLARATIONS COMPETING INTERESTS The authors declare no competing interests. ADDITIONAL INFORMATION PUBLISHER’S NOTE Springer Nature remains neutral with regard to jurisdictional claims in
published maps and institutional affiliations. SUPPLEMENTARY INFORMATION SUPPLEMENTARY INFORMATION RIGHTS AND PERMISSIONS OPEN ACCESS This article is licensed under a Creative Commons
Attribution 4.0 International License, which permits use, sharing, adaptation, distribution and reproduction in any medium or format, as long as you give appropriate credit to the original
author(s) and the source, provide a link to the Creative Commons license, and indicate if changes were made. The images or other third party material in this article are included in the
article’s Creative Commons license, unless indicated otherwise in a credit line to the material. If material is not included in the article’s Creative Commons license and your intended use
is not permitted by statutory regulation or exceeds the permitted use, you will need to obtain permission directly from the copyright holder. To view a copy of this license, visit
http://creativecommons.org/licenses/by/4.0/. Reprints and permissions ABOUT THIS ARTICLE CITE THIS ARTICLE Lan, S., Guo, C., Zhou, W. _et al._ Engineering medium-range order and
polyamorphism in a nanostructured amorphous alloy. _Commun Phys_ 2, 117 (2019). https://doi.org/10.1038/s42005-019-0222-9 Download citation * Received: 08 February 2019 * Accepted: 13 August
2019 * Published: 27 September 2019 * DOI: https://doi.org/10.1038/s42005-019-0222-9 SHARE THIS ARTICLE Anyone you share the following link with will be able to read this content: Get
shareable link Sorry, a shareable link is not currently available for this article. Copy to clipboard Provided by the Springer Nature SharedIt content-sharing initiative