Different hierarchical reconfigurations in the brain by psilocybin and escitalopram for depression
- Select a language for the TTS:
- UK English Female
- UK English Male
- US English Female
- US English Male
- Australian Female
- Australian Male
- Language selected: (auto detect) - EN
Play all audios:

ABSTRACT Effective interventions for neuropsychiatric disorders may work by rebalancing the brain’s functional hierarchical organization. Here we directly investigated the effects of two
different serotonergic pharmacological interventions on functional brain hierarchy in major depressive disorder in a two-arm double-blind phase II randomized controlled trial comparing
psilocybin therapy (22 patients) with escitalopram (20 patients). Patients with major depressive disorder received either 2 × 25 mg of oral psilocybin, three weeks apart, plus six weeks of
daily placebo (‘psilocybin arm’) or 2 × 1 mg of oral psilocybin, three weeks apart, plus six weeks of daily escitalopram (10–20 mg; ‘escitalopram arm’). Resting-state functional magnetic
resonance imaging scans were acquired at baseline and three weeks after the second psilocybin dose (NCT03429075). The brain mechanisms were captured by generative effective connectivity,
estimated from whole-brain modeling of resting state for each session and patient. Hierarchy was determined for each of these sessions using measures of directedness and trophic levels on
the effective connectivity, which captures cycle structure, stability and percolation. The results showed that the two pharmacological interventions created significantly different
hierarchical reconfigurations of whole-brain dynamics with differential, opposite statistical effect responses. Furthermore, the use of machine learning revealed significant differential
reorganization of brain hierarchy before and after the two treatments. Machine learning was also able to predict treatment response with an accuracy of 0.85 ± 0.04. Overall, the results
demonstrate that psilocybin and escitalopram work in different ways for rebalancing brain dynamics in depression. This suggests the hypothesis that neuropsychiatric disorders could be
closely linked to the breakdown in regions orchestrating brain dynamics from the top of the hierarchy. SIMILAR CONTENT BEING VIEWED BY OTHERS INCREASED GLOBAL INTEGRATION IN THE BRAIN AFTER
PSILOCYBIN THERAPY FOR DEPRESSION Article 11 April 2022 MODULATION OF NEURAL OSCILLATIONS IN ESCITALOPRAM TREATMENT: A CANADIAN BIOMARKER INTEGRATION NETWORK IN DEPRESSION STUDY Article Open
access 12 October 2024 PSILOCYBIN THERAPY INCREASES COGNITIVE AND NEURAL FLEXIBILITY IN PATIENTS WITH MAJOR DEPRESSIVE DISORDER Article Open access 08 November 2021 MAIN Neuropsychiatric
disorders are devastating, incurring significant disability and stigma for individuals and a serious and growing burden for society1,2. Major depressive disorder (MDD) has become pervasive.
A major contributor to the years lost to disability worldwide, in terms of the burden of disease, by 2030 MDD is predicted to become the largest contributor3. Adding to this problem,
antidepressant drugs show modest efficacy4,5, have unpleasant side effects that impact treatment adherence6 and are associated with high relapse rates7. Problems with current treatments and
the scarcity of reliable animal models mean that new research strategies are needed to treat neuropsychiatric disorders8,9. Yet, at the present time, it is not clear how brain dynamics
change when patients get better following pharmacological intervention. Neuroimaging has identified abnormal brain dynamics in depression10,11, with changes linked primarily to higher-order
brain networks including the default mode network (DMN), executive network (EN) and salience network (SN)11,12. Research in healthy individuals has associated these networks with
higher-order functioning, including executive control and attentional switching13, which are often impaired in depressed patients14. There have also been neuroimaging studies investigating
the effective connectivity in depression associated with treatment response15,16,17. Successful pharmacological intervention for depression must therefore be linked to a rebalancing of these
dynamics. One candidate mechanism is the role of the serotonin 2A (5-HT2A) receptor subtype, which is closely associated with serotonergic psychedelic drugs such as psilocybin18,19. The
spatial distribution of 5-HT2A receptors overlaps with the DMN, EN and SN20. It has been hypothesized in the ‘relaxed beliefs under psychedelics’ (REBUS) theory21 that psychedelics can bring
about a relaxation of the precision of high-level priors or ‘beliefs’, allowing bottom–up rather than hierarchical top–down information flow, which is consistent with more hierarchy-free
system dynamics, suggesting a hierarchical reconfiguration of brain dynamics22. However, a full whole-brain quantification of hierarchical processing has not yet been attempted. In this
Article, the main aim is to study the effects of pharmacological intervention on brain dynamics and in particular to determine how this affects the hierarchy of brain processing associated
with two serotonergic pharmacological interventions given to patients with treatment-resistant depression. To answer this research question, we leveraged a double-blind phase II randomized
controlled trial23, where resting-state functional magnetic resonance imaging (fMRI) scans at baseline and after treatment were obtained from all patients22. To best quantify the changes in
brain dynamics, we implemented a sensitive measure of hierarchy, inspired by work in ecology capturing the hierarchical relationships between plants, herbivores and carnivores in a food web.
The method uses the concept of trophic levels for each node in a directed graph, which can be thought of as the ‘height’ of a node in the hierarchy24. A flat hierarchy is characterized by
equal trophic levels and low directedness, which reflects low asymmetry in a network. In contrast, a strong hierarchy is associated with high directedness and strong asymmetric connections
in a many-layered network. This measure of directedness (also called trophic coherence) has been related to other network properties, such as cycle structure, stability, normality and
percolation25. This hierarchy measure provides the global level of directedness and regional trophic levels, which we applied to the graph of the generative effective connectivity (GEC)
matrix26. This was estimated from whole-brain modeling of the resting state for each session of each patient. The GEC is an extension of the classic concept of effective connectivity27, but
generative in the sense that the GEC is created from a whole-brain model of empirical resting-state data, where the strengths of existing anatomical connectivity are adapted iteratively
until best fit, thus providing a mechanistic explanation of the resting-state data. This asymmetric measure of functional brain connectivity is fundamental for assessing hierarchy, while
other simpler measures such as functional connectivity (FC) are not suitable because they are, by definition, symmetric. The overall result was that the two pharmacological interventions
gave rise to significantly different hierarchical reconfigurations following treatment, with differential, opposite statistical effect responses. In other words, we found significant
differences between measures of both directedness and the trophic level, before and after intervention. These differences were found both from direct statistical tests and when using machine
learning to measure the degree of pattern separation. Furthermore, we also found significant differences in trophic levels when comparing responders with non-responders for each
pharmacological intervention. Importantly, pharmacological interventions were found to work best when select cortical and subcortical regions in the so-called ‘global workspace’ were
re-established as being near the top of the hierarchy28. These results strongly suggest that the psilocybin and escitalopram work in very different ways when used for rebalancing the
hierarchical organization of brain dynamics in depression. In general, the research presented here offers a principled route to evaluate the effects of pharmacological intervention based on
empirical brain dynamics data. Many obstacles remain, including replication of the results in a much larger population and for other interventions, but the results show potential for
fulfilling the great expectations of using neuroimaging for understanding the underlying mechanisms of neuropsychiatric disorders. RESULTS We addressed the main research question of how
pharmacological interventions affect brain dynamics by assessing hierarchical reconfiguration in the brain state in MMD patients enrolled in a double-blind phase II randomized controlled
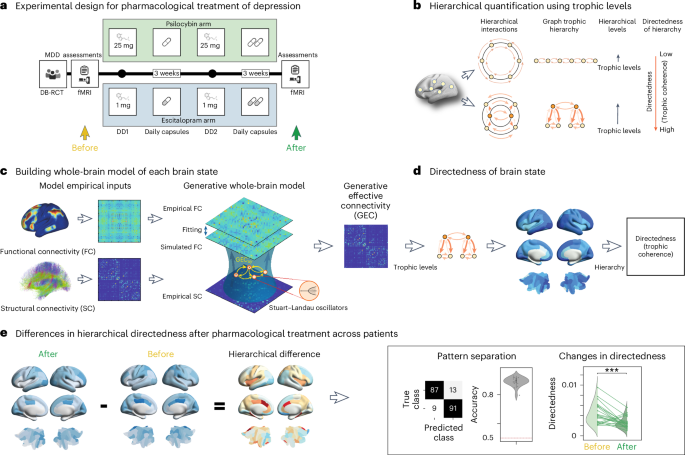
trial comparing two drugs (psilocybin and escitalopram)23. In this study, as shown in Fig. 1a, neuroimaging resting-state data were acquired before and after the pharmacological intervention
(details of the trial are provided in Methods). We used the data for these two sessions six weeks apart to quantify the effects on global directedness and regional trophic levels on the
brain dynamics following either intervention. QUANTIFYING HIERARCHY IN BRAIN STATES To reveal the spatiotemporal hierarchical organization of the brain dynamics for the two pharmacological
interventions, we implemented a method measuring the directedness and trophic levels of a network based on previous work in ecology29 and extended to general directed networks24. This
measure of hierarchy is very robust and has been used in many other fields; it has been described as ‘upstreamness’ in economics30 and is a key ingredient in the construction of SinkRank, a
measure of contribution to systemic risk31. For a given directed network, this method provides both the hierarchical, node-level information (trophic level) and the global information (the
directedness, or trophic coherence). In other words, the trophic level provides a measure of where a node sits in the hierarchy of a directed network. In ecology, low trophic levels would be
assigned to plants, and high trophic level nodes would be assigned to carnivores, given that energy flows up the food web from low to high trophic levels. Our implementation of the
hierarchy methods uses the recent extension from ref. 24 to the standard definitions of trophic level, which allows the method to overcome the limitations of requiring a basal node (that is,
a node with no incoming edges) and taking into account reverse flow. As a result, this optimized method is even more robust, as it captures aspects of related network measures of stability,
cycles and normality. We thus use a well-established method to measure the spatiotemporal hierarchical organization of brain dynamics. Figure 1b presents a cartoon illustrating the trophic
levels and directedness measures for flat and hierarchical networks. As can be seen in the top panel, a flat hierarchy has approximately equal trophic levels, resulting in low directedness
and reflecting the low asymmetry of the network. This is not the case for a strong hierarchy, which is associated with high directedness and consequently strong asymmetric connections. In
the latter case, the diversity of trophic levels reflects that the network contains many hierarchical layers and an overall direction pointing from the lowest to the highest. To estimate the
functional hierarchy of a given brain state, we applied this method to the network produced by whole-brain modeling of a patient’s individual resting state in the DK80 parcellation28. This
network captures the underlying mechanisms generating the resting-state dynamics32. In brief, whole-brain modeling combines the anatomical connectivity with local dynamics to fit the
dynamics of empirical neuroimaging data32,33,34. The local dynamics can be simulated using, for example, spiking, dynamical mean field and Hopf local regional models to fit many different
empirical observables. Overall, the best fit is obtained with the Hopf model, so we chose to fit this model to the model-free observable of non-reversibility of the neuroimaging
data26,35,36,37. More specifically, Fig. 1c shows the procedure for fitting a whole-brain model, initially using the anatomical connectivity and then iteratively adjusting a GEC, which is
given as asymmetric weights of the existing anatomical connections26. This is an extension of the concept of effective connectivity27, but where GEC is generative because it uses the
whole-brain model to adapt the strength of existing anatomical connectivity (that is, the effective conductive values of each fiber). In contrast to normal symmetrical measures of effective
connectivity (typically using FC), here we use the asymmetrical optimization obtained from using the non-reversibility INSIDEOUT method26. Recent advances in the analysis of brain-imaging
data have shown that the thermodynamic concept of the arrow of time (or non-reversibility) is a very sensitive and robust measure of the underlying asymmetric information
flow26,35,36,37,38,39,40,41,42,43. This body of research has demonstrated that creating a whole-brain model of the arrow of time in empirical neuroimaging data can provide access to the
generative mechanisms underlying hierarchy—which in turn can provide a direct measure of the hierarchical reconfiguration over time (Methods). Figure 1d shows how the hierarchy of the brain
state in each session can be quantified using the directedness method on the individual GEC. This produces the trophic levels for each brain region, that is, where in the hierarchy each is
placed, as well as the global measure of directedness (or trophic coherence) based on the trophic levels. Finally, Fig. 1e illustrates the procedure for estimating the difference in
hierarchical organization, which is obtained by subtracting the sessions before the pharmacological intervention from after. As shown in the following, this is used as the basis of machine
learning to compare pattern separation based on regional trophic levels and for the direct comparison of the hierarchical reconfiguration of directedness. MACHINE LEARNING OF HIERARCHICAL
RECONFIGURATIONS We used machine learning to establish the significant hierarchical reorganization between before and after treatment. To do this, we first computed the GEC for both sessions
in each patient receiving either psilocybin or escitalopram, independent of treatment response. This allowed us to compute the trophic levels and directedness before and after intervention
in each patient. The before and after scan sessions for each of the two types of intervention were classified using machine learning (Fig. 2a). For classification we used the hierarchical
trophic levels for each region (for each patient and condition) as input features. We sorted the regions according to each region’s statistical significant hierarchical trophic level across
patients, region by region, using Wilcoxon 10,000-permutation tests. To estimate with the highest possible accuracy, we selected sequentially the minimum numbers of regions from the sorted
list of statistically significant trophic levels with the minimum number of inputs that yielded the largest accuracy. We found that the highest accuracy was obtained using 69 regions for the
psilocybin treatment arm and six regions for the escitalopram treatment arm. Importantly, we trained the support vector machine (SVM) with the leave-one-out cross-validation procedure; that
is, we randomly chose one patient for generalization and the rest for training, repeated, and shuffled 1,000 times. Furthermore, we made sure that the training set was balanced in terms of
number of examples for each class label, and randomly selected the patients in each class for each shuffling iteration (Methods). The results show significant effects above chance levels
with an accuracy of 0.89 ± 0.03 (mean ± s.d.) for psilocybin and 0.89 ± 0.02 for escitalopram. In addition, we also carried out machine learning for all 80 regions for both treatments to
show that the preselection of regions does not affect the results (Supplementary Fig. 5). DIRECTEDNESS OF HIERARCHICAL RECONFIGURATION The overall global hierarchical reconfiguration can be
directly quantified using the measure of directedness, which is a global measure of hierarchy based on regional trophic levels (Methods). Figure 2b shows the significant differences between
before and after treatment (_P_ < 0.001, paired Wilcoxon test using 10,000 permutations) for both the psilocybin and escitalopram treatment arms. Importantly, with psilocybin treatment,
the directedness significantly decreases, but it increases for the escitalopram treatment, reflecting the differential hierarchical reconfiguration for the two pharmacological interventions.
This demonstrates differential, opposite statistical effect responses, whereby the directedness decreases for the psilocybin treatment but increases for the escitalopram treatment.
Importantly, the finding of a differential treatment-dependent hierarchical reconfiguration was confirmed by additional analyses. First, we computed the correlations between changes in Beck
Depression Inventory (BDI)/treatment response (post–pre) for hierarchy (changes in directedness post–pre) for the psilocybin and escitalopram groups. As shown in Supplementary Fig. 6, this
yielded no significance for psilocybin (corr: −0.023, _P_ = 0.91 (not significant (NS)), red line) and for escitalopram (corr: 0.16, _P_ = 0.50 (NS), blue line). Yet, as expected when we
combine the two groups, this yields a significant correlation of 0.3 (_P_ _=_ 0.049, black line). The results mean that the change in BDI score is not predictive for the change in hierarchy
for either group, but only when combining them. Overall, this shows that treatment is the important variable. Second, further validating this important result, we ran an analysis of variance
(ANOVA) with three variables: (1) binary variable of whether a patient was classified as responder, (2) change in BDI score (post–pre) and (3) type of treatment (psilocybin or
escitalopram). The results confirmed that only the treatment is significant: factor 1 (response): _F_-statistics 0.063, _P_ = 0.81 (NS); factor 2 (BDI change): _F_-statistics 1.22, _P_ =
0.35 (NS); factor 3 (treatment): _F_-statistics 16.086, _P_ = 0.0013. We also investigated possible self-reported sex effects using multi-way ANOVA of the differences in directedness before
and after intervention. This showed non-significant effects of sex (_P_ > 0.05) on the mean of the differences in directedness (_F_(1,39) = 3.08, _P_ = 0.087), whereas the intervention
effect was highly significant (_F_(1,39) = 33.28, _P_ < 0.001). It is also important to remark that although the interventions had different remission rates (based on the BDI: 64% for
psilocybin and 30% for escitalopram), the main finding of different reconfigurations between the treatment arms is independent of remission rates, but based on the significant differential,
opposite statistical effect responses in the changes in hierarchy after intervention. In the case of patients given psilocybin, the mean directedness of the hierarchy is decreasing, whereas
it increases for patients given escitalopram. Furthermore, this reconfiguration in hierarchy is also found at the node level, as shown in the new analysis presented in Supplementary Fig. 1,
which shows the statistical significance of the differential reconfiguration with differential, opposite statistical effect responses (one is positive and the other negative). We also
carried out a rigorous analysis matching patients with a similar baseline and change in depression score and tested for differential, opposite statistical effect responses. Supplementary
Fig. 2 shows the changes in directedness for patients with similar initial BDI baseline scores (>23) and changes in BDI after and before (<−10). The results shows that the mean
directedness hierarchy decreases for the psilocybin arm (_P_ < 0.05, paired Wilcoxon test using 10,000 permutations), but increases for the escitalopram arm (_P_ < 0.05, paired
Wilcoxon test using 10,000 permutations). More detailed information was obtained from running four different linear mixed-effect models. Supplementary Table 4 provides the details of a
linear mixed-effect model for paired repeated measures analysis with a random effect and matching (grouping) patients according to (1) their BDI baseline, (2) their BDI change (post–pre) and
(3) their treatment type (psilocybin or escitalopram) to predict hierarchy change (directedness change post–pre). For this procedure, we first used _k_-means clustering to find the optimal
silhouette and used _n_ = 5 clusters to define the grouping. We thus matched five similar groups of participants across the whole group of participants and ran the linear mixed-effect model
in MATLAB (2022b). The results showed an intercept (bias) _t_-statistic = −0.394 (_P_ = 0.695 (NS)), BDI baseline _t_-statistic = 0.431 (_P_ = 0.668 (NS)), BDI change _t_-statistic = 0.399
(_P_ = 0.692 (NS)) and treatment _t_-statistic = −5.152 (_P_ < 0.001). This highly significant result demonstrates that only the treatment is important, without any confounding factors.
Supplementary Table 5 provides the details of a linear mixed model of directedness using BDI change as a fixed effect grouped by treatment as the random effect. The results showed an
intercept (bias) _t_-statistic = −0.051 (_P_ = 0.96 (NS)) and BDI change _t_-statistic = 0.409 (_P_ = 0.68 (NS)). The lack of significance for intercept and BDI change when using treatment
as the random effect shows that treatment is the important factor. Supplementary Table 6 provides the details of a linear mixed model of directedness change using BDI change, BDI baseline,
QIDS baseline, QIDS change, age, sex, illness duration, medication withdrawal and medication as a fixed effect grouped by treatment as the random effect. As can be seen in the table, none of
the results are significant and are therefore not confounding factors. Supplementary Table 7 provides the details of a linear mixed model of directedness change using treatment as a fixed
effect and using other variables as random effects: BDI baseline, QIDS baseline, QIDS change, age, sex, illness duration, medication withdrawal and medication. The results showed an
intercept (bias) _t_-statistic = 0.526 (_P_ = 0.60 (NS)) and treatment _t_-statistic = −4.08 (_P_ < 0.001). This highly significant result demonstrates that only the treatment is
important, without any confounding factors. Overall, all these investigations (Fig. 2b, Supplementary Figs. 3, 4 and 6 and Supplementary Tables 4–7) converge on the fact that the
differential, opposite statistical effect responses in hierarchy are consistently changed in opposite directions for the psilocybin and escitalopram arms. This strongly supports the main
finding of a differential reconfiguration of hierarchy. In addition to this hierarchy analysis, we also tested this claim using more traditional methods based on FC. We first tested the
ability of FC (Supplementary Fig. 3a) to distinguish the effects of psilocybin and escitalopram before and after intervention. We compared the mean across all elements in FC matrices and did
not find any significant differences between before and after intervention. Second, we tested the ability of time-shifted FC (with a shift of 1 repetition time (TR); Supplementary Fig. 3b)
using a measure of asymmetry of these matrices before and after intervention. In particular, we computed asymmetry as the mean of the absolute difference between the respective time-shifted
FC matrix and the transposed matrix. We found a significant difference for the psilocybin session (_P_ < 0.05, paired Wilcoxon test using 10,000 permutations) but not for the escitalopram
session. Still, the effect for psilocybin is less statistically significant than what we found using the hierarchy measure. This lack of sensitivity of both alternate measurements is not
surprising given that these methods are focused on grand average static, spatial correlation and lack sensitivity to temporal dynamics. Even more importantly, in the case of FC, this measure
is symmetric, meaning that FC does not capture the asymmetry intrinsic to hierarchical organization. On the other hand, the time-shifted FC is a simple but effective measure to capture
asymmetry. Yet, it only captures static spatial correlations across the entire time window. In contrast, the hierarchy measure captures the hierarchical organization of spatiotemporal
dynamics generated from a whole-brain model. It is therefore more sensitive to changes for both interventions and, more importantly, reveals the differential, opposite statistical effect
responses. Additionally, we tested the power of using our measure of hierarchical organization to distinguish treatment effects in a relatively small sample of patients and repeated these
procedures using another measure of global brain connectivity (GBC; Methods), which captures the functional coupling of each region with the rest of the brain. Supplementary Fig. 4 shows
that this measure performs significantly worse using GBC than when using hierarchical levels. This poorer performance can be seen in the differences in the scatterplots in Supplementary Fig.
4a for GBC and hierarchical levels before and after both psilocybin and escitalopram. To further quantify this difference, we directly tested the inability of FC for distinguishing
treatment effects by comparing the individual correlations after versus before treatment: psilocybin (_P_ < 0.001, paired Wilcoxon test with 10,000 permutations) and escitalopram (_P_
< 0.04, paired Wilcoxon test with 10,000 permutations) (see the violin plots in Supplementary Fig. 4b). REGIONAL DIFFERENCES IN HIERARCHICAL RECONFIGURATION To achieve a better
understanding of the regional changes underlying the differential hierarchical reconfiguration for each treatment arm, Fig. 2c shows cortical and subcortical renderings of the average
trophic regional levels (across patients) for before and after treatment with psilocybin (left column) and escitalopram (right column). Figure 2d shows renderings of the differential trophic
levels, demonstrating the hierarchical reconfiguration and how the differential effects of the two interventions result in strikingly different patterns of regional trophic levels. Although
the small sample size makes statistical testing at the regional level more difficult due to the multiple comparisons, Supplementary Table 1 presents quantitative information reporting on
the top 20% of regions involved in the hierarchical reorganization overall in each intervention arm (irrespective of whether responders or non-responders). As can be seen, the psilocybin
treatment changes the hierarchy for a large number of mainly cortical regions, many of which have been shown to be part of the global workspace28. The top regions include both cortical (left
posterior cingulate and left rostral anterior cingulate cortices) and subcortical (right hippocampus and right amygdala) regions. In contrast, the overall response to escitalopram treatment
does not change the hierarchy of cortical regions, but only subcortical regions (of which the amygdala, left putamen and right hippocampus are found in the global workspace). In spite of
the small sample size, we also carried out rigorous statistical testing. Supplementary Table 2 shows the results for the full psilocybin treatment arm (22 patients), where 61 of 80 regions
survive statistical testing (_P_ < 0.05, paired Wilcoxon test using 10,000 permutations and false discovery rate (FDR)-corrected for multiple comparisons). In contrast, only 4 of 80
regions survive similar statistical testing for the escitalopram treatment arm (20 patients, _P_ < 0.05, paired Wilcoxon test using 10,000 permutations and FDR-corrected for multiple
comparisons). Please note that this difference in number of significant regions between the two treatment arms is also found in the classification. RECONFIGURATION IN RESPONDERS AND
NON-RESPONDERS Importantly, we also found significant differences between responders and non-responders in the hierarchical reconfigurations of brain dynamics following psilocybin and
escitalopram treatment. Given the potential limitations of statistical testing in the small sample, we used machine learning (again with cross-validation; Methods) to quantify the
significant hierarchical reorganization related to treatment response. We used the efficacy of treatment using the amended (revised) Beck Depression Inventory (BDI-1A), which captures a
broad range of symptoms and places emphasis on the cognitive features of depression44. For further justification for the use of this measure here, see ref. 45. Here we used the
classification from Daws and colleagues22, where a patient is classified as a responder if they show a significant reduction in BDI-1A after treatment (details in ref. 22). Figure 3a shows
the results of using machine learning for testing significantly above chance level accuracies of pattern separation between responders versus non-responders for each treatment arm (0.67 ±
0.05 for psilocybin and 0.69 ± 0.04 for escitalopram, using the methods described above). The highest accuracy was obtained using five regions for psilocybin and six regions for escitalopram
treatment. We systematically investigated the regional changes underlying these different responses. Figure 3b shows renderings of the differences in trophic levels after and before
treatment for psilocybin (left column) and escitalopram (right column) for non-responders (left) and responders (right). Confirming the significant machine-learning pattern separation
results, within each treatment the responders and non-responders show differences in the regional trophic levels for responders versus non-responders. Supplementary Table 3 presents
quantitative information reporting on the top 20% of regions involved in the overall hierarchical reorganization in each intervention arm. These results offer some added insights into the
treatment mechanisms. In the case of the escitalopram treatment, the results show that patients improve if the treatment also affects the hierarchical reorganization of cortical regions that
could be said to be part of the global workspace. Specifically, the following cortical regions of the global workspace moved up in hierarchy following treatment: left and right posterior
cingulate, left rostral anterior cingulate and right rostral anterior cingulate cortices. In addition, the subcortical regions (left putamen, left nucleus accumbens and right amygdala) of
the global workspace also moved back up the hierarchy. However, this will need to be confirmed in future larger studies. In the case of the psilocybin, most of the patients responded and so
show hierarchical changes similar to the general treatment response, which is both cortical and subcortical regions of the global workspace moving back up the hierarchy. As expected,
non-responders do have a slightly different response to responders, with prefrontal regions more likely to move up the hierarchy. We note that, due to the small sample size, statistical
testing at the regional level is difficult due to multiple comparisons. Still, for psilocybin responders (18/22), we found 41 regions that were significantly different before and after
successful treatment (_P_ < 0.05, paired Wilcoxon test using 10,000 permutations and FDR-corrected for multiple comparisons). In escitalopram responders (8/20), there was only one
surviving region (left STN), which is at the top of the changing hierarchy in Supplementary Table 3. TREATMENT RESPONSE CAN BE DIFFERENTIATED AND PREDICTED BY THE HIERARCHICAL REORGANIZATION
Further investigating the treatment response, we show that when comparing the directedness of the hierarchical organization in treatment, the after session gives significant differences
across patients (_P_ < 0.001, paired Wilcoxon test with 10,000 permutations; Fig. 4a). In other words, the directedness reveals which intervention a given patient has received, confirming
the significantly different hierarchical reorganization linked to the two pharmacological interventions. Furthermore, as shown in Fig. 4b, we can also classify the treatment response using
the regional trophic levels with a high accuracy of 0.83 ± 0.03 for the pattern-separation machine learning with cross-validation (Methods). Please note that the training set was carefully
balanced in terms of number of examples for each class label, and the patients in each class for each shuffling iteration were randomly selected. Finally, we were able to predict the
treatment response using the baseline data (that is, the before escitalopram treatment data). This was only done for escitalopram, because this arm, unlike psilocybin, had the necessary
power, with roughly equal numbers of responders and non-responders. Using machine learning with cross-validation, Fig. 4c shows a high accuracy of prediction (0.85 ± 0.04). This significant
prediction is potentially interesting for future clinical applications. DISCUSSION We have studied the effects of pharmacological interventions on the brain dynamics of MDD patients before
and after treatment with either psilocybin or escitalopram. Directly addressing our main research question, we were able to show that—despite leading to equal improvements in depressive
symptoms (as measured with BDI-1A)—the two drugs work in significantly different ways and show differential, opposite statistical effect responses, as indexed by how each reconfigures the
global functional hierarchy of brain dynamics. In particular, we have demonstrated that hierarchical measures of both directedness and trophic levels associated with brain dynamics are
significantly different before and after intervention, as well as different between responders and non-responders for both drug types. Our results complement previous research showing that
there are shared and unique changes in brain connectivity following different types of intervention for depression46. More generally, the framework presented here offers a principled route
to evaluate the effects of any pharmacological intervention with before and after empirical brain dynamics data. To generalize the results, however, they should be replicated in larger
populations and for other interventions, but there could be a path for fulfilling the great expectations of using neuroimaging for understanding the underlying mechanisms of neuropsychiatric
disorders and successful treatments32. HIERARCHICAL REORGANIZATION FOR PSILOCYBIN AND ESCITALOPRAM We found that psilocybin treatment leads to a decrease in the overall global measure of
directedness of the hierarchy of brain dynamics when comparing brain dynamics after versus before treatment (Fig. 2b). In contrast, escitalopram leads to an increase in the overall global
measure of directedness of the hierarchy of brain dynamics. These differential effects are in line with the known differential effects of the pharmacology of the two drugs. Psilocybin is the
prodrug of psilocin (4-OH-dimethyltryptamine) and has been shown to act mainly through the serotonin 2A receptor (5-HT2AR)18,19,47, thereby initiating a multi-level plasticity48.
Psychedelics works partly through 5-HT2A receptor agonism leading to an increase in the sensitivity of excitatory neurons expressing the receptor, which in turn causes dysregulation of
spontaneous population-level activity and spike-wave decoupling49. Attesting to this, dynamic sensitivity analysis of the systematic perturbation of whole-brain models has been used to
identify brain networks that are part of the transition away from a depressive brain state following administration of psilocybin50. In contrast, escitalopram is a member of the most
frequently prescribed antidepressant drug class, the so-called selective serotonin reuptake inhibitors (SSRIs). Unlike psilocybin, which has no appreciable affinity or action of the
serotonin transporter (5-HTT), SSRIs are thought to rely on reuptake blockade at the 5-HTT. This suggests an overall flattening of the hierarchy for psilocybin after administration in MDD
patients, which is consistent with the evidence from healthy participants on psilocybin and other classic psychedelics51,52. Specifically, psychedelics have been shown to broaden the
repertoire of connectivity states53,54,55,56,57, increase the entropy of resting-state activity58,59,60,61, and enhance the connectivity between central high-level networks and the rest of
the brain51,60,62,63. More generally, the results are consistent with the REBUS theory21 and the anarchic brain hypothesis, integrating Friston’s free-energy principle64 with the entropic
brain hypothesis of Carhart-Harris58,65. Here, the main hypothesis is that psychedelics can bring about a relaxation of the precision of high-level priors or ‘beliefs’ (REBUS), allowing
(anarchic) bottom–up information flow, consistent with ‘anarchic’ (that is, hierarchy-free) system dynamics. This theory is consistent with our results showing psilocybin treatment leading
to a hierarchical reconfiguration and general flattening of the hierarchy. In contrast, the increase in directedness of the hierarchical reorganization after escitalopram treatment would
imply that the responders show a more top–down hierarchical organization of their brain dynamics. It is tempting to speculate that this top–down organization may also be linked to dampened
responsivity in stress circuitry under these drugs66, allowing easier top–down control. However, to test this speculation would require a new, carefully designed study, for which some
progress has already been made67. Even so, further work is required to better scrutinize this hypothesis. The results show that psilocybin and escitalopram work in very different ways when
used for rebalancing the hierarchical organization of the brain dynamics in depression. Both interventions may lead to a significant reduction in depressive symptoms, but do so in
significantly different ways. This was first hypothesized by Carhart-Harris and Nutt66, and implied but not proven in the research of Daws and colleagues22, who used the same data analysed
here but only found a change in integration–segregation for psilocybin but not for escitalopram, thus missing the differential, opposite statistical effect. Crucially, as we have
demonstrated here, this differential, opposite statistical effect is not revealed using simple symmetric FC measures or even asymmetric time-shifted FC, which do not capture the relevant
temporal dynamics. Fully revealing the hierarchical organization of the underlying spatiotemporal dynamics requires the sensitivity of our hierarchical method combined with a causal,
generative whole-brain model. The key argument for causality in connection with whole-brain modeling is that removing a ‘causal’ region from the model results in a significant inability to
maintain the fit to empirical data. This is analogous to how lesions are used in animal models, but used now for ‘in silico’ models. Previously, Deco and colleagues lesioned the top and
bottom of the hierarchy and showed that only the first lesioning significantly changed the fit of the model to the empirical data28. Here, we first determine the GEC that allows the
whole-brain model to generate the best fit to the empirical data. Hence, we know that the regions in this network are causally important for generating the functional dynamics. REGIONAL
HIERARCHICAL REORGANIZATION FOR TREATMENTS The regional results show that positive depression recovery is linked to when both cortical and subcortical regions of the global workspace are
moving back up in the hierarchy following treatment. However, these changes differ in how psilocybin and escitalopram restore the orchestration of healthy brain function, and the main
mechanisms underlying the treatment response for depression involve regional hierarchical reconfiguration. In terms of hierarchical organization at the regional level, psilocybin treatment
(Fig. 2c, left column brain rendering) leads to broad changes across the whole brain, with multiple regions in the cingulate cortex increasing their trophic level when comparing after with
before the treatment. Similarly, subcortical regions such as the STN, hippocampus and amygdala are also moving up in the hierarchy and drive the orchestration to a higher degree than before.
In contrast, large parts of the prefrontal and temporal cortices decrease their trophic level, suggesting that they are moving down the hierarchical organization. These patterns of
hierarchical reconfiguration are very different after escitalopram treatment for all patients (Fig. 2c, right column brain rendering); in all cortical regions the trophic levels decrease
from after to before treatment for all patients, and many subcortical regions (such as amygdala, putamen, hippocampus, caudate and STN) show an increase in trophic levels. This drives the
global increase in directedness from before to after treatment, irrespective of outcome. Importantly, comparing the regional trophic levels for responders with non-responders following
escitalopram treatment (Fig. 3b, right column), the responders show a significantly different pattern, with increases of trophic level in parts of cortical as well as subcortical regions.
These changes in the hierarchical position of brain regions are driving the treatment response. In fact, the patients that respond to either pharmacological intervention show an increase in
the hierarchical position of both cortical and subcortical regions. Given that the trophic hierarchical levels are based on the GEC measure coming from a whole-brain model of the brain
dynamics, this implicates these brain regions in the healthy transition away from treatment-resistant depression. These findings fit well with previous literature, which has implicated major
depression with disturbances in multiple resting-state networks, including the SN and DMN, which are known to regulate cognitive control and attention68,69,70,71. In particular, the
findings also fit well with the changes in large-scale FC between networks72,73. Specifically in remitted depressed patients, increased FC has been observed between the DMN and the dorsal
attention network, and also within and between networks such as the SN and executive control networks74. There is also an emerging literature showing how an increase in activity in the DMN
is associated with rumination and recurrence of depression75,76. Interestingly, many of the regions changing with treatment have been shown to be part of the global workspace28, which
orchestrates healthy brain function. This opens up the interesting hypothesis that depression is caused by a malfunctioning orchestration of brain dynamics, where there is a partial
breakdown in one or more of the brain regions at the top of the hierarchy28. This hypothesis may even hold for other neuropsychiatric disorders70 and, as such, it would be of considerable
interest to further test this hypothesis in other datasets. PREDICTING OUTCOME USING MACHINE LEARNING Even more relevant for treatment, we were able to demonstrate that the trophic
hierarchical levels for an individual depressed patient at baseline before treatment can be used to predict the outcome of escitalopram treatment (Fig. 4c). However, there were too few
non-responders for the psilocybin treatment arm to be able to use this for prediction. This finding for escitalopram is potentially exciting but will need replication in a much larger
dataset to test the true predictive value of this finding. The importance of more data can be appreciated when comparing this predictive result with the lower accuracy results in Fig. 3a,
where machine learning was used to measure the accuracy in separating the difference between responders and non-responders before and after treatment. This lower accuracy runs counter to the
intuition that more information should lead to higher accuracy than the prediction accuracy. Still, in both cases, machine learning performs significantly better than chance, although the
noise level is clearly having a major effect with the relatively low sample size. Hence, in future this problem should be further investigated in more appropriate large-scale studies with
more non-responders. POTENTIAL LIMITATIONS Importantly, it should be noted that there are several potential limitations to this study. First, the results here are based on neuroimaging using
BOLD signals from fMRI and thus carry a number of potential limitations. These include the fact that BOLD signals are indirect measures of neural activity77 at a coarse spatial scale of
~1–2 mm3, corresponding to ~5 million neurons with diverse properties and functions78,79. This heterogeneity of neuronal populations is especially true in the higher-order brain regions
often associated with neuropsychiatric disorders80. Equally, another limitation of resting-state fMRI is the significant intra-individual rest–retest variability, which has been linked to
variations in a number of different factors including diet, diurnal changes, blood pressure and even cognitive load81. Nevertheless, BOLD signals are still useful given that they are highly
correlated with local field potentials and multi-unit activity and thus accurately reflect the activity in local cortical circuits78,79. Second, the study has a relatively low sample size,
which limits the statistical power used for regional analyses. As such, the regional results mentioned above are not conclusive but will require further study and replication in larger
studies. CONCLUSION Overall, the hierarchy of brain dynamics is clearly a very sensitive measure of change. This is made possible by recent advances in whole-brain modeling using a novel
thermodynamics-inspired framework26, providing the level of non-reversibility (or arrow of time) in brain signals35,37,43. This provides the observable for a model-based, direct
quantification of the asymmetric interactions, which is then quantified using the trophic framework. The thermodynamic framework provides measures of the non-reversibility of brain states
and the identification of brain regions involved in breaking the balance as well as the net fluxes between underlying brain networks before and after interventions. In other words, the arrow
of time of brain signals can provide a powerful new way to identify the cause and effect when the brain is reorganized. Here we have used this framework to identify how different
pharmacological interventions reorganize brain dynamics differently. This has provided insights into the underlying mechanisms of depression and may in time lead to even better
interventions. The results also confirm the hypothesis that problems with the main regions of the global workspace orchestrating brain dynamics could be the main cause of neuropsychiatric
disorders—consistent with previous findings and hypotheses70,82. Future larger studies should further investigate this hypothesis. We also note that the present whole-brain modeling
framework could be used for treatment studies using any kind of effective intervention, whether pharmacological, electrical or behavioral. METHODS EMPIRICAL DATA The trial’s design (Fig. 1a)
and primary clinical outcomes (clinicaltrials.gov: NCT03429075) have been documented previously22,23. The clinical trial took place at the National Institute for Health Research Imperial
Clinical Research Facility and received sponsorship from Imperial College London. It obtained ethical approval (ID 17/LO/0389) from the NHS Research and Imperial College Joint Research and
Compliance Office, as well as approval from the Health Research Authority and Medicines and Healthcare Products Regulatory Agency. This study was carried out under a Schedule 1 Drug Licence
granted by the UK Home Office. Written informed consent was provided by all participants who did not receive any financial compensation. PARTICIPANTS To be eligible for participation,
individuals needed a confirmed diagnosis of unipolar MDD from a general practitioner, scoring 16 or higher on the 21-item Hamilton Depression Rating scale. Patients were also queried about
any prior use of psychedelics. Within this trial, 31% of patients in the psilocybin group and 24% in the escitalopram group reported previous experience with psychedelics. Individuals were
excluded from the trial if they had an immediate family or personal history of psychosis, a physician-assessed risky physical health condition, a history of serious suicide attempts, a
positive pregnancy test or contraindications for undergoing an MRI. In addition, individuals with contraindications for selective serotonin reuptake inhibitors (SSRIs) or previous use of
escitalopram were also excluded. It is important to note that treatment resistance was not considered as an inclusion or exclusion criterion. All eligible patients underwent telephone
screening interviews, provided written informed consent, and underwent comprehensive evaluations of their mental and physical medical histories. Supplementary Table 8 provides the
self-reported demographics for all patients. INTERVENTIONS Of the 59 recruited patients with MDD, a random number generator was used to assign 30 patients to the psilocybin arm and 29
patients to the escitalopram arm. Similar to Daws and colleagues22, we excluded some of the patients in each arm. Specifically, for the psilocybin arm, one patient was excluded for choosing
not to take the daily (placebo) capsules, and due to the COVID-19 UK lockdown, two patients did not attend the post-treatment session; finally, five patients were excluded due to excessive
fMRI head motion. The remaining 22 patients (mean age, 41.9 years, s.d. = 11.0, 14 men and 8 women) were included in the psilocybin imaging sample. For the escitalopram arm, four patients
discontinued due to adverse reactions to escitalopram, one patient reported cannabis use, one patient was lost due to the COVID-19 UK lockdown, and a further three patients were excluded due
to excessive fMRI head motion. The remaining 20 patients (mean age, 38.7 years, s.d. = 11.0, 14 men and 6 women) were included in the escitalopram imaging sample. Before treatment, all
patients underwent a baseline resting-state fMRI session with their eyes closed. On the first dosing day (DD1), patients received either 25 mg of psilocybin (psilocybin arm) or a presumed
negligible dose of 1 mg of psilocybin (escitalopram arm). Although all patients were informed that they would receive psilocybin, they were unaware of the specific dosage to ensure blinding.
A second dosing day (DD2) took place three weeks after DD1, where patients received the same dosage as in the first session. There was no crossover in dosages between the two arms. Starting
from the day after DD1, patients took daily capsules for a total of six weeks and one day. In both conditions, patients ingested one capsule per day during the initial three weeks, and
increased the dosage to two capsules per day afterward. The capsule content was either an inert placebo (microcrystalline cellulose in the psilocybin arm) or escitalopram in the escitalopram
arm. In the escitalopram arm, patients received 10 mg of escitalopram for the first three weeks and a total of 2 × 10 mg (20 mg) thereafter. Blinding was not done in the clinical trial upon
which the data were based. However, there are recent data showing that psychedelic therapy may be less vulnerable to expectancy biases than previously suspected83. In this study, the
authors analyzed the clinical data with mixed linear models to investigate the association between both escitalopram and psilocybin and pre-treatment efficacy-related expectations, baseline
trait suggestibility and absorption and therapeutic response. The results showed that patients overall had significantly higher expectancy for psilocybin relative to escitalopram. Yet,
expectancy for escitalopram was associated with improved therapeutic outcomes to escitalopram, and expectancy for psilocybin was not predictive of the response to psilocybin. The BDI
remission rates were 64% for the psilocybin arm and 30% for the escitalopram arm. MEASURING DEPRESSION SEVERITY The severity of depression was evaluated using BDI (BDI-1A) scores in this
study. BDI-1A is a patient-rated assessment tool that encompasses a wider range of symptoms and places particular emphasis on the cognitive aspects of depression44. Baseline BDI assessments
were conducted before the first dosing day (DD1), and subsequent evaluations took place at two, four and six weeks after DD1. It is important to note that BDI was considered a secondary
outcome measure for this study, as indicated by its registration on ClinicalTrials.gov (NCT03429075). The primary outcome measure (QIDS-SR-16) was found not to be different between the two
intervention arms23. MRI ACQUISITION Imaging of the brain was carried out with a 3T Siemens Tim Trio set-up at Invicro. For the acquisition of brain anatomy, we used the recommended MPRAGE
parameters from Alzheimer’s Disease Neuroimaging Initiative, Grand Opportunity (ADNI-GO56): 1-mm isotropic voxels; 160 sagittal slices; 256 × 256 in-plane field of view; echo time (TE), 2.98
ms; TR, 2,300 ms; generalized autocalibrating partially parallel acquisitions (GRAPPA) acceleration, 2; flip angle, 9°; bandwidth, 240 Hz per pixel. For the acquisition of functional data,
we collected eyes-closed resting-state fMRI data using T2*-weighted echo-planar images. We used a 32-channel head coil to acquire 480 volumes in ~10 min: 3-mm isotropic voxels; 44 axial
slices; TE, 30 ms; TR, 1,250 ms; GRAPPA acceleration, 2; flip angle, 70°; bandwidth, 2,232 Hz per pixel. PARCELLATIONS All neuroimaging data were processed using the DK80 cortical
parcellation28, which is a combination of the Mindboggle-modified Desikan–Killiany parcellation84 with a total of 62 cortical regions (31 regions per hemisphere)85 and 18 subcortical
regions, that is, nine regions per hemisphere: hippocampus, amygdala, subthalamic nucleus (STN), globus pallidus internal segment (GPi), globus pallidus external segment (GPe), putamen,
caudate, nucleus accumbens and thalamus. We chose this parcellation given our previous work showing that this is the best compromise between spatial accuracy and computational load for
whole-brain modeling when measuring brain hierarchy in neuropsychiatric disorders28. However, we note that there is no current consensus about what is the best spatial parcellation scheme,
as shown by the paper by Eickhoff and colleagues reviewing the literature on the topographic organization of the brain86. FMRI DATA PREPROCESSING The imaging data were preprocessed using an
in-house pipeline using the FMRIB Software Library (FSL)87, Analysis of Functional NeuroImages (AFNI)88, Freesurfer89 and Advanced Normalization Tools90 packages, as described in detail in a
previous publication22. Briefly, this pipeline consists of de-spiking, slice time correction, motion correction, brain extraction, rigid body registration to anatomical scans, nonlinear
template registration, scrubbing, bandpass filtering, regression with six realignment motion regressors, three tissue signal regressors, draining veins and local white matter. Daws and
colleagues were careful to rule out any systematic bias from akathisia or similar movement artifacts, as also shown in their supplementary materials and in particular their supplementary
table 1 showing the head motion descriptive statistics22. The DK80 parcellated timeseries used here for hierarchical analysis was extracted from this preprocessed data. HOPF WHOLE-BRAIN
MODEL In this study we utilized a Stuart–Landau oscillator model to represent the local dynamics of each brain region. This model, which corresponds to the normal form of a supercritical
Hopf bifurcation, is widely used for investigating the transition from noisy to oscillatory dynamics91. Previous research has successfully employed whole-brain Hopf models to replicate
important characteristics of brain dynamics observed in electrophysiology92,93, magnetoencephalography94 and fMRI95. The full mathematical description of the Hopf model and the linearization
of this model are available in Supplementary Information. MODEL OPTIMIZATION—GEC To fit the model to the empirical data (BOLD fMRI of each participant in each brain state), we used a
pseudo-gradient procedure to optimize the coupling connectivity matrix _C_, where the starting point was the standard structural connectivity matrix computed from the diffusion MRI data from
a specially optimized state-of-the-art Human Connectome Project (HCP) protocol28. The final optimized matrix comprises the effective conductivity values for each anatomical existing pair
connections instead of just the diffusion MRI (dMRI)-based density of fibers. Specifically, we iteratively compared the output of the model with the empirical measures of the functional
correlation matrix (_FC_empirical), that is, the normalized covariance matrix of the functional neuroimaging data. Additionally, to fit the whole-brain level of non-reversibility, we define
the forward and reversal matrices of time-shifted correlations for the forward version and respective reversed backward version of a multidimensional timeseries for the different brain
regions. This allows us to compute the forward and reversal matrices, expressing the functional causal dependencies between the different variables for the forward and artificially generated
reversed backward version of a multidimensional system. We compared the output of the model with the forward normalized _τ_ time-shifted covariances
(\({{{FS}}}_{{\rm{forward}}}^{{\rm{empirical}}}{\left(\tau \right)}\)). These normalized time-shifted covariances were derived by shifting the empirical covariance matrix
\({{{KS}}}_{{\rm{forward}}}^{{\rm{empirical}}}{(\tau )}\) and dividing each pair (_i_, _j_) by
\({\sqrt{{{KS}}_{{\rm{forward}},\,{ii}}^{{\rm{empirical}}}{\left(0\right){KS}}_{{\rm{forward}},\,{jj}}^{{\rm{empirical}}}(0)}}\). It is worth noting that these normalized time-shifted
covariances break the symmetry of the couplings, resulting in an enhanced fitting quality96. To fully capture the asymmetry, we fit the non-reversibility by performing the same procedure on
the reversed normalized _τ_ time-shifted covariances (\({{{FS}}}_{{\rm{reversal}}}^{{\rm{empirical}}}{(\tau )}\)). Using a heuristic pseudo-gradient algorithm, we set _α_ = _ς_ = 0.00001 and
updated _C_ until achieving a fully optimized fit. More specifically, the updating uses the following form: $$\begin{array}{l}{C}_{{ij}}={C}_{{ij}}+\alpha
\left({{FC}}_{{ij}}^{{\rm{empirical}}}-{{FC}}_{{ij}}^{{\rm{model}}}\right)\\\qquad\qquad+\varsigma
\left(\left({{FS}}_{{\rm{forward}},\,{ij}}^{{\rm{empirical}}}\left({\tau}\right)-{{FS}}_{{\rm{reversal}},\,{ij}}^{{\rm{empirical}}}\left({\tau}\right)\right)\right.\\\left.\qquad\qquad-\left({{FS}}_{{\rm{forward}},\,{ij}}^{{\rm{model}}}\left({\tau}\right)-{{FS}}_{{\rm{reversal}},\,{ij}}^{{\rm{model}}}\left({\tau}\right)\right)\right)\end{array}$$
(1) where \({{FS}}_{{\rm{forward}},\,{ij}}^{{\rm{model}}}{(\tau )}\) is defined similarly for forward \({{FS}}_{{\rm{forward}},\,{ij}}^{{\rm{empirical}}}{\left(\tau \right)}\) and
\({{FS}}_{{\rm{reversal}},\,{ij}}^{{\rm{model}}}{(\tau )}\) is defined for reversal \({{FS}}_{{\rm{reversal}},\,{ij}}^{{\rm{empirical}}}{\left(\tau \right)}\). In other words, for the
forward version, it is given by the first _N_ rows and columns of the simulated _τ_ time-shifted covariances \({{{KS}}}_{{\rm{forward}}}^{{\rm{model}}}{(\tau )}\) normalized by dividing each
pair (_i_, _j_) by \({\sqrt{{{KS}}_{{\rm{forward}},\,{ii}}^{{\rm{model}}}{\left(0\right){KS}}_{{\rm{forward}},\,{jj}}^{{\rm{model}}}(0)}}\), where
\({{{KS}}}_{{\rm{forward}}}^{{\rm{model}}}{(\tau )}\) is the shifted simulated covariance matrix computed as $${{{KS}}}_{{\rm{forward}}}^{{\rm{model}}}{(\tau )}={\exp \left(\tau
{{J}\,}\right){{K}}}$$ (2) where the _J_ matrix is the Jacobian of the linearized Hopf model evaluated at the fixed point (Supplementary Information). It is important to note that
\({{{KS}}}_{{\rm{forward}}}^{{\rm{model}}}{\left(0\right)={{K}}}\). The same procedure was applied to the reversal version of \({{FS}}_{{\rm{reversal}},\,{ij}}^{{\rm{model}}}{\left(\tau
\right)}\). The model is executed iteratively with the updated _C_ until a stable and convergent fit is achieved. We use this method in two stages: (1) at the group level (for the before and
after for each of the two treatment types); (2) this is then used as the starting point for individual optimization. At the group level, we initialize _C_ as the anatomical connectivity
data obtained through probabilistic tractography from dMRI (Methods). The update process only modifies the known existing connections from this matrix within each hemisphere, following the
anatomical connections. However, an exception is made for homolog connections between corresponding regions in both hemispheres, as tractography tends to be less accurate in capturing this
type of connectivity. For the Stuart–Landau model, as mentioned above, we set _α_ = ς = 0.00001 and continue the algorithm until convergence is attained. In each iteration, we compute the
model results by averaging over multiple simulations corresponding to the number of participants. In summary, we refer to the optimized matrix _C_ as the GEC26. Briefly, the main difference
between the GEC and other examples of effective connectivity such as dynamic causal modeling (DCM)27, Granger causality97 and transfer entropy28,98,99,100,101,102 is the anatomically
constrained nature of GEC. In most implementations of DCM, Granger and transfer entropy, the underlying brain anatomy is not constraining the results. Furthermore, both methods measure some
form of causality from the timeseries but do not use a generative form of causality. In our GEC, this generative aspect is explicitly given by brain anatomical constraints and whole-brain
modeling. Importantly, this modeling typically allows for an estimation across the whole brain rather than only for the limited amount of regions given by DCM (up to ten regions in recent
implementations), although recent work has applied the framework to the whole brain103,104,105. DEFINING GBC For each session in each patient, we computed the GBC, given by
$${\rm{GBC}}_{i}={\frac{1}{N}\mathop{\sum }\limits_{j=1}^{N}{{FC}}_{{ij}}}$$ (3) FUNCTIONAL HIERARCHY METRICS To investigate functional hierarchical organization following pharmacological
treatments in MDD patients, we adapted the hierarchy measures of directedness and trophic levels in directed networks24. This provides both the hierarchical node-level information (trophic
level) and the global information (directedness, or trophic coherence), and here we apply this to the directed graph obtained from the GEC matrix, the individualized optimized matrix _C_
given by equation (1). TROPHIC LEVELS The GEC matrix defines a graph of _N_ nodes connected by weighted edges determined by the elements of _C_. For each node _n_ in the graph, we introduce
the concepts of in-weight (\({d}_{n}^{\,{\rm{in}}}\)), by summing the _m_ columns of _C_, and out-weight (\({d}_{n}^{\,{\rm{out}}}\)), by summing the _m_ rows of _C_, defined as follows:
$${d}_{n}^{\,{\rm{in}}}={\sum _{m}{C}_{{nm}}}$$ (4) $${d}_{n}^{\,{\rm{out}}}={\sum _{m}{C}_{{mn}}}$$ (5) We define the total weight of node _n_ as _u__n_ by
$${u}_{n}={d}_{n}^{\,{\rm{in}}}+{d}_{n}^{\,{\rm{out}}}$$ (6) Furthermore, we define the imbalance for node _n_ as _v__n_, representing the difference between the flow into and out of the
node by $${v}_{n}={d}_{n}^{\,{\rm{in}}}-{d}_{n}^{\,{\rm{out}}}$$ (7) The (weighted) graph-Laplacian operator Λ on vector H is given by $${{\Lambda
}}={\rm{diag}}{\left(u\right)}-{{C}}-{{{C}}}^{{\bf{T}}}$$ (8) Consequently, the enhanced concept of trophic level corresponds to the solution H of the linear system of equations $${{\Lambda
}}{\bf{h}}={\bf{v}}$$ (9) Here each component of the vector H corresponds to the trophic level in a given brain region. Importantly, while the operator Λ is symmetric, the asymmetry of the
network is evident in the imbalance vector V. DIRECTEDNESS (TROPHIC COHERENCE) OF A NETWORK Once the hierarchy level _h_ has been established, we can assess the network’s global
directionality by computing its directedness (or trophic coherence) using the equation $${F}_{0}={1-\frac{\sum _{{mn}}{C}_{{mn}}\,{({h}_{n}-{h}_{m}-1)}^{2}}{\sum _{{mn}}{C}_{{mn}}}}$$ (10) A
network is considered maximally coherent when _F_0 = 1, whereas it is regarded as incoherent when _F_0 = 0. The trophic coherence is a graph theoretical measure of hierarchical
organization. Elevated values of trophic coherence indicate a greater degree of hierarchical organization. Using the GEC obtained through the whole-brain model-based framework, we computed
hierarchical levels for each region in our parcellation and trophic coherence characterizing the global level of hierarchical organization. SVM FOR PATTERN SEPARATION AND CLASSIFICATION Both
pattern separation and classification were conducted using a support vector machine (SVM) with Gaussian kernels as implemented by the function fitcecoc in MATLAB (2022b), returning a full,
trained, two-class, error-correcting output codes model with the predictors in the input with class labels. We used the one-versus-one coding design with _K_ = 2 as the number of unique
class labels in _K_(_K_ − 1)/2 binary SVM models. The output of the SVM was two classes, which correspond to (1) after versus before, (2) responder versus non-responder or (3) psilocybin
versus escitalopram treatment. The input features used for classification were hierarchical trophic levels (for each patient and condition). We used a selection of inputs by statistically
comparing hierarchical trophic levels across patients, region by region, using a Wilcoxon 10,000 permutation tests and sorting these. We selected the minimum number of inputs that yielded
the largest accuracy. The SVM was trained using the leave-one-out cross-validation procedure; that is, we randomly chose one patient for generalization and used the rest for training. This
was repeated and shuffled 1,000 times. Furthermore, the training set was balanced in terms of number of examples for each class label, while randomly selecting the patients in each class for
each shuffling iteration. To estimate the highest possible accuracy, we systematically computed the accuracy by sequentially selecting different numbers of regions from the sorted list of
statistically significant trophic levels mentioned above. In terms of the minimum number of regions used for the pattern separation in Fig. 2a, the highest accuracy was obtained for 69
regions for psilocybin and six regions for escitalopram treatment before versus after. In Fig. 3a, for the pattern separation between responders versus non-responders, the highest accuracy
was obtained using five regions for psilocybin and six regions for escitalopram treatment. In Fig. 4b, the highest accuracy comparing treatment was obtained using 33 regions. In Fig. 4c, the
highest accuracy was obtained using five regions for the prediction of treatment response. REPORTING SUMMARY Further information on research design is available in the Nature Portfolio
Reporting Summary linked to this article. DATA AVAILABILITY All requests for raw and analysed data and materials are promptly reviewed by R.L.C.-H., the chief investigator on the original
work. Patient-related data not included in the paper were generated as part of clinical trials and may be subject to patient confidentiality. All data needed to evaluate the conclusions in
the paper are present in the paper and/or Supplementary Information. CODE AVAILABILITY Code used to analyze the data is available from https://github.com/decolab/Psilodep2. REFERENCES *
Vigo, D., Thornicroft, G. & Atun, R. Estimating the true global burden of mental illness. _Lancet Psychiatry_ 3, 171–178 (2016). Article PubMed Google Scholar * Vigo, D., Jones, L.,
Atun, R. & Thornicroft, G. The true global disease burden of mental illness: still elusive. _Lancet Psychiatry_ 9, 98–100 (2022). Article PubMed Google Scholar * World Health
Organization. _Depression and Other Common Mental Disorders_: _Global Health Estimates_ (World Health Organization, 2017). * Cipriani, A. et al. Comparative efficacy and acceptability of 21
antidepressant drugs for the acute treatment of adults with major depressive disorder: a systematic review and network meta-analysis. _Lancet_ 391, 1357–1366 (2018). Article PubMed PubMed
Central Google Scholar * Hofmann, S. G., Curtiss, J., Carpenter, J. K. & Kind, S. Effect of treatments for depression on quality of life: a meta-analysis. _Cogn. Behav. Ther._ 46,
265–286 (2017). Article PubMed PubMed Central Google Scholar * Locher, C. et al. Efficacy and safety of selective serotonin reuptake inhibitors, serotonin-norepinephrine reuptake
inhibitors, and placebo for common psychiatric disorders among children and adolescents: a systematic review and meta-analysis. _JAMA Psychiatry_ 74, 1011–1020 (2017). Article PubMed
PubMed Central Google Scholar * Steinert, C., Hofmann, M., Kruse, J. & Leichsenring, F. Relapse rates after psychotherapy for depression—stable long-term effects? A meta-analysis. _J.
Affect. Disord._ 168, 107–118 (2014). Article PubMed Google Scholar * Holtzheimer, P. E. & Mayberg, H. S. Stuck in a rut: rethinking depression and its treatment. _Trends Neurosci._
34, 1–9 (2011). Article PubMed Google Scholar * Nutt, D. & Carhart-Harris, R. The current status of psychedelics in psychiatry. _JAMA Psychiatry_ 78, 121–122 (2021). Article PubMed
Google Scholar * Hamilton, J. P. et al. Default-mode and task-positive network activity in major depressive disorder: implications for adaptive and maladaptive rumination. _Biol.
Psychiatry_ 70, 327–333 (2011). Article PubMed PubMed Central Google Scholar * Goodman, Z. T. et al. Whole-brain functional dynamics track depressive symptom severity. _Cereb. Cortex_
31, 4867–4876 (2021). Article PubMed PubMed Central Google Scholar * Lydon-Staley, D. M. et al. Repetitive negative thinking in daily life and functional connectivity among default mode,
fronto-parietal and salience networks. _Transl. Psychiatry_ 9, 234 (2019). Article PubMed PubMed Central Google Scholar * Turnbull, A. et al. Reductions in task positive neural systems
occur with the passage of time and are associated with changes in ongoing thought. _Sci. Rep._ 10, 9912 (2020). Article PubMed PubMed Central Google Scholar * Wilkinson, P. O. &
Goodyer, I. M. Attention difficulties and mood-related ruminative response style in adolescents with unipolar depression. _J. Child Psychol. Psychiatry_ 47, 1284–1291 (2006). Article PubMed
Google Scholar * Jamieson, A. J., Harrison, B. J., Razi, A. & Davey, C. G. Rostral anterior cingulate network effective connectivity in depressed adolescents and associations with
treatment response in a randomized controlled trial. _Neuropsychopharmacology_ 47, 1240–1248 (2022). Article PubMed Google Scholar * Sacu, S. et al. Effective connectivity during face
processing in major depression—distinguishing markers of pathology, risk and resilience. _Psychol. Med._ 53, 4139–4151 (2023). Article PubMed Google Scholar * Rolle, C. E. et al. Cortical
connectivity moderators of antidepressant vs placebo treatment response in major depressive disorder: secondary analysis of a randomized clinical trial. _JAMA Psychiatry_ 77, 397–408
(2020). Article PubMed PubMed Central Google Scholar * Kringelbach, M. L. et al. Dynamic coupling of whole-brain neuronal and neurotransmitter systems. _Proc. Natl Acad. Sci. USA_ 117,
9566–9576 (2020). Article PubMed PubMed Central Google Scholar * Nichols, D. E. Psychedelics. _Pharmacol. Rev._ 68, 264–355 (2016). Article PubMed PubMed Central Google Scholar *
Beliveau, V. et al. A high-resolution in vivo atlas of the human brain’s serotonin system. _J. Neurosci._ 37, 120–128 (2017). PubMed PubMed Central Google Scholar * Carhart-Harris, R. L.
& Friston, K. J. REBUS and the anarchic brain: toward a unified model of the brain action of psychedelics. _Pharmacol. Rev._ 71, 316–344 (2019). Article PubMed PubMed Central Google
Scholar * Daws, R. E. et al. Increased global integration in the brain after psilocybin therapy for depression. _Nat. Med._ 28, 844–851 (2022). Article PubMed Google Scholar *
Carhart-Harris, R. et al. Trial of psilocybin versus escitalopram for depression. _N. Engl. J. Med._ 384, 1402–1411 (2021). Article PubMed Google Scholar * MacKay, R. S., Johnson, S.
& Sansom, B. How directed is a directed network? _R. Soc. Open Sci._ 7, 201138 (2020). Article PubMed PubMed Central Google Scholar * Rodgers, N., Tino, P. & Johnson, S. Strong
connectivity in real directed networks. _Proc. Natl Acad. Sci. USA_ 120, e2215752120 (2023). Article PubMed PubMed Central Google Scholar * Kringelbach, M. L., Sanz Perl, Y.,
Tagliazucchi, E. & Deco, G. Toward naturalistic neuroscience: mechanisms underlying the flattening of brain hierarchy in movie-watching compared to rest and task. _Sci. Adv._ 9, eade6049
(2023). Article PubMed PubMed Central Google Scholar * Friston, K. J., Harrison, L. & Penny, W. Dynamic causal modelling. _NeuroImage_ 19, 1273–1302 (2003). Article PubMed Google
Scholar * Deco, G., Vidaurre, D. & Kringelbach, M. L. Revisiting the Global Workspace orchestrating the hierarchical organisation of the human brain. _Nat. Human Behav._ 5, 497–511
(2021). Article Google Scholar * Levine, S. Several measures of trophic structure applicable to complex food webs. _J. Theor. Biol._ 83, 195–207 (1980). Article Google Scholar * Antràs,
P., Chor, D., Fally, T. & Hillberry, R. Measuring the upstreamness of production and trade flows. _Am. Econ. Rev._ 102, 412–416 (2012). Article Google Scholar * Soramäki, K. &
Cook, S. SinkRank: an algorithm for identifying systemically important banks in payment systems. _Economics_ 7, 20130028 (2013). Article Google Scholar * Deco, G. & Kringelbach, M. L.
Great expectations: using whole-brain computational connectomics for understanding neuropsychiatric disorders. _Neuron_ 84, 892–905 (2014). Article PubMed Google Scholar * Kringelbach, M.
L. & Deco, G. Brain states and transitions: insights from computational neuroscience. _Cell Rep._ 32, 108128 (2020). Article PubMed Google Scholar * Breakspear, M. Dynamic models of
large-scale brain activity. _Nat. Neurosci._ 20, 340–352 (2017). Article PubMed Google Scholar * Deco, G., Sanz Perl, Y., Tagliazucchi, E. & Kringelbach, M. L. The INSIDEOUT framework
provides precise signatures of the balance of intrinsic and extrinsic dynamics in brain states. _Commun. Biol._ 5, 572 (2022). Article PubMed PubMed Central Google Scholar * G.Guzman,
E. et al. The lack of temporal brain dynamics asymmetry as a signature of impaired consciousness states. _Interface Focus_ 13, 20220086 (2023). Article PubMed PubMed Central Google
Scholar * Deco, G. et al. The arrow of time of brain signals in cognition: potential intriguing role of parts of the default mode network. _Netw. Neurosci._ 7, 966–998 (2023). Article
PubMed PubMed Central Google Scholar * Deco, G. et al. One ring to rule them all: the unifying role of prefrontal cortex in steering cognitive brain dynamics in review. _Prog. Neurobiol._
227, 102468 (2023). Article PubMed Google Scholar * de la Fuente, L. A. et al. Temporal irreversibility of neural dynamics as a signature of consciousness. _Cereb. Cortex_ 33, 1856–1865
(2023). * Sanz Perl, Y. et al. Non-equilibrium brain dynamics as a signature of consciousness. _Phys. Rev. E_ 104, 014411 (2021). Article PubMed Google Scholar * Lynn, C. W., Holmes, C.
M., Bialek, W. & Schwab, D. J. Decomposing the local arrow of time in interacting systems. _Phys. Rev. Lett._ 129, 118101 (2022). Article PubMed PubMed Central Google Scholar * Lynn,
C. W., Holmes, C. M., Bialek, W. & Schwab, D. J. Emergence of local irreversibility in complex interacting systems. _Phys. Rev. E_ 106, 034102 (2022). Article PubMed PubMed Central
Google Scholar * Lynn, C. W., Cornblath, E. J., Papadopoulos, L., Bertolero, M. A. & Bassett, D. S. Broken detailed balance and entropy production in the human brain. _Proc. Natl Acad.
Sci. USA_ 118, e2109889118 (2021). Article PubMed PubMed Central Google Scholar * Fried, E. I. The 52 symptoms of major depression: lack of content overlap among seven common depression
scales. _J. Affect. Disord._ 208, 191–197 (2017). Article PubMed Google Scholar * Weiss, B., Erritzoe, D., Giribaldi, B., Nutt, D. J. & Carhart-Harris, R. L. A critical evaluation of
QIDS-SR-16 using data from a trial of psilocybin therapy versus escitalopram treatment for depression. _J. Psychopharmacol._ 37, 717–732 (2023). Article PubMed PubMed Central Google
Scholar * Dunlop, B. W. et al. Shared and unique changes in brain connectivity among depressed patients after remission with pharmacotherapy versus psychotherapy. _Am. J. Psychiatry_ 180,
218–229 (2023). Article PubMed Google Scholar * Vargas, M. V. et al. Psychedelics promote neuroplasticity through the activation of intracellular 5-HT2A receptors. _Science_ 379, 700–706
(2023). Article PubMed PubMed Central Google Scholar * Carhart-Harris, R. L. How do psychedelics work? _Curr. Opin. Psychiatry_ 32, 16–21 (2019). Article PubMed Google Scholar * Nutt,
D., Erritzoe, D. & Carhart-Harris, R. Psychedelic psychiatry’s brave new world. _Cell_ 181, 24–28 (2020). Article PubMed Google Scholar * Vohryzek, J. et al. Brain dynamics
predictive of response to psilocybin for treatment-resistant depression. _Brain Commun._ 6, fcae049 (2024). Article PubMed PubMed Central Google Scholar * Girn, M. et al. Serotonergic
psychedelic drugs LSD and psilocybin reduce the hierarchical differentiation of unimodal and transmodal cortex. _NeuroImage_ 256, 119220 (2022). Article PubMed Google Scholar * Erritzoe,
D. et al. Exploring mechanisms of psychedelic action using neuroimaging. _Nat. Mental Health_ 2, 141–153 (2024). Article Google Scholar * Tagliazucchi, E., Carhart‐Harris, R., Leech, R.,
Nutt, D. & Chialvo, D. R. Enhanced repertoire of brain dynamical states during the psychedelic experience. _Hum. Brain Mapping_ 35, 5442–5456 (2014). Article Google Scholar * Atasoy,
S., Vohryzek, J., Deco, G., Carhart-Harris, R. L. & Kringelbach, M. L. Common neural signatures of psychedelics: frequency-specific energy changes and repertoire expansion revealed using
connectome-harmonic decomposition. _Prog. Brain Res._ 242, 97–120 (2018). Article PubMed Google Scholar * Varley, T. F., Carhart-Harris, R., Roseman, L., Menon, D. K. & Stamatakis,
E. A. Serotonergic psychedelics LSD & psilocybin increase the fractal dimension of cortical brain activity in spatial and temporal domains. _NeuroImage_ 220, 117049 (2020). Article
PubMed Google Scholar * Cruzat, J. et al. Effects of classic psychedelic drugs on turbulent signatures in brain dynamics. _Netw. Neurosci._ 6, 1104–1124 (2022). Article PubMed PubMed
Central Google Scholar * Luppi, A. I. et al. Distributed harmonic patterns of structure-function dependence orchestrate human consciousness. _Commun. Biol._ 6, 117 (2023). Article PubMed
PubMed Central Google Scholar * Carhart-Harris, R. et al. The entropic brain: a theory of conscious states informed by neuroimaging research with psychedelic drugs. _Front. Hum.
Neurosci._ 8, 20 (2014). Article PubMed PubMed Central Google Scholar * Herzog, R. et al. A mechanistic model of the neural entropy increase elicited by psychedelic drugs. _Sci. Rep._
10, 17725 (2020). Article PubMed PubMed Central Google Scholar * Timmermann, C. et al. Human brain effects of DMT assessed via EEG-fMRI. _Proc. Natl Acad. Sci. USA_ 120, e2218949120
(2023). Article PubMed PubMed Central Google Scholar * Schartner, M. M., Carhart-Harris, R. L., Barrett, A. B., Seth, A. K. & Muthukumaraswamy, S. D. Increased spontaneous MEG signal
diversity for psychoactive doses of ketamine, LSD and psilocybin. _Sci. Rep._ 7, 46421 (2017). Article PubMed PubMed Central Google Scholar * Carhart-Harris, R. et al. Neural correlates
of the LSD experience revealed by multimodal neuroimaging. _Proc. Natl Acad. Sci. USA_ 113, 4853–4858 (2016). Article PubMed PubMed Central Google Scholar * Tagliazucchi, E. et al.
Increased global functional connectivity correlates with LSD-induced ego dissolution. _Curr. Biol._ 26, 1043–1050 (2016). Article PubMed Google Scholar * Friston, K. The free-energy
principle: a unified brain theory? _Nat. Rev. Neurosci._ 11, 127–138 (2010). Article PubMed Google Scholar * Carhart-Harris, R. The entropic brain-revisited. _Neuropharmacology_ 142,
167–178 (2018). Article PubMed Google Scholar * Carhart-Harris, R. L. & Nutt, D. J. Serotonin and brain function: a tale of two receptors. _J. Psychopharmacol._ 31, 1091–1120 (2017).
Article PubMed PubMed Central Google Scholar * Matthew, B. W. et al. Reduced brain responsiveness to emotional stimuli with escitalopram but not psilocybin therapy for depression.
Preprint at _medRxiv_ https://doi.org/10.1101/2023.05.29.23290667 (2023). * Warlow, S. M., Naffziger, E. E. & Berridge, K. C. The central amygdala recruits mesocorticolimbic circuitry
for pursuit of reward or pain. _Nat. Commun._ 11, 2716 (2020). Article PubMed PubMed Central Google Scholar * Kaiser, R. H., Andrews-Hanna, J. R., Wager, T. D. & Pizzagalli, D. A.
Large-scale network dysfunction in major depressive disorder: a meta-analysis of resting-state functional connectivity. _JAMA Psychiatry_ 72, 603–611 (2015). Article PubMed PubMed Central
Google Scholar * Menon, V. Large-scale brain networks and psychopathology: a unifying triple network model. _Trends Cogn. Sci._ 15, 483–506 (2011). Article PubMed Google Scholar *
Mulders, P. C., van Eijndhoven, P. F., Schene, A. H., Beckmann, C. F. & Tendolkar, I. Resting-state functional connectivity in major depressive disorder: a review. _Neurosci. Biobehav.
Rev._ 56, 330–344 (2015). Article PubMed Google Scholar * Li, G. et al. Large-scale dynamic causal modeling of major depressive disorder based on resting-state functional magnetic
resonance imaging. _Hum. Brain Mapp._ 41, 865–881 (2020). Article PubMed Google Scholar * Liu, X. et al. Disrupted rich-club network organization and individualized identification of
patients with major depressive disorder. _Prog. Neuropsychopharmacol. Biol. Psychiatry_ 108, 110074 (2021). Article PubMed Google Scholar * Liu, J. et al. The neuroprogressive nature of
major depressive disorder: evidence from an intrinsic connectome analysis. _Transl. Psychiatry_ 11, 102 (2021). Article PubMed PubMed Central Google Scholar * Lythe, K. E. et al.
Self-blame-selective hyperconnectivity between anterior temporal and subgenual cortices and prediction of recurrent depressive episodes. _JAMA Psychiatry_ 72, 1119–1126 (2015). Article
PubMed Google Scholar * Marchetti, I., Koster, E. H., Sonuga-Barke, E. J. & De Raedt, R. The default mode network and recurrent depression: a neurobiological model of cognitive risk
factors. _Neuropsychol. Rev._ 22, 229–251 (2012). Article PubMed Google Scholar * Logothetis, N. K., Pauls, J., Augath, M., Trinath, T. & Oeltermann, A. Neurophysiological
investigation of the basis of the fMRI signal. _Nature_ 412, 150–157 (2001). Article PubMed Google Scholar * Bandettini, P. A. & Ungerleider, L. G. From neuron to BOLD: new
connections. _Nat. Neurosci._ 4, 864–866 (2001). Article PubMed Google Scholar * Logothetis, N. K. What we can do and what we cannot do with fMRI. _Nature_ 453, 869–878 (2008). Article
PubMed Google Scholar * Price, J. L. & Drevets, W. C. Neural circuits underlying the pathophysiology of mood disorders. _Trends Cogn. Sci._ 16, 61–71 (2012). Article PubMed Google
Scholar * Specht, K. Current challenges in translational and clinical fMRI and future directions. _Front. Psychiatry_ 10, 924 (2019). Article PubMed Google Scholar * Carhart-Harris, R.
L. et al. Canalization and plasticity in psychopathology. _Neuropharmacology_ 226, 109398 (2023). Article PubMed Google Scholar * Szigeti, B. et al. Assessing expectancy and
suggestibility in a trial of escitalopram v. psilocybin for depression. _Psychol. Med._ 54, 1717–1724 (2024). Article PubMed Google Scholar * Desikan, R. S. et al. An automated labeling
system for subdividing the human cerebral cortex on MRI scans into gyral based regions of interest. _NeuroImage_ 31, 968–980 (2006). Article PubMed Google Scholar * Klein, A. &
Tourville, J. 101 labeled brain images and a consistent human cortical labeling protocol. _Front. Neurosci._ 6, 171 (2012). Article PubMed PubMed Central Google Scholar * Eickhoff, S.
B., Yeo, B. T. T. & Genon, S. Imaging-based parcellations of the human brain. _Nat. Rev. Neurosci._ 19, 672–686 (2018). Article PubMed Google Scholar * Smith, S. M. et al. Advances in
functional and structural MR image analysis and implementation as FSL. _NeuroImage_ 23, S208–S219 (2004). Article PubMed Google Scholar * Cox, R. W. AFNI: software for analysis and
visualization of functional magnetic resonance neuroimages. _Comput. Biomed. Res._ 29, 162–173 (1996). Article PubMed Google Scholar * Dale, A. M., Fischl, B. & Sereno, M. I. Cortical
surface-based analysis. I. Segmentation and surface reconstruction. _NeuroImage_ 9, 179–194 (1999). Article PubMed Google Scholar * Avants, B. B., Tustison, N. & Song, G. Advanced
normalization tools (ANTS). _Insight J._ 2, 1–35 (2009). Google Scholar * Kuznetsov, Y. A. _Elements of Applied Bifurcation Theory_ (Springer, 1998). * Freyer, F. et al. Biophysical
mechanisms of multistability in resting-state cortical rhythms. _J. Neurosci._ 31, 6353–6361 (2011). Article PubMed PubMed Central Google Scholar * Freyer, F., Roberts, J. A., Ritter, P.
& Breakspear, M. A canonical model of multistability and scale-invariance in biological systems. _PLoS Comput. Biol._ 8, e1002634 (2012). Article PubMed PubMed Central Google Scholar
* Deco, G. et al. Single or multi-frequency generators in on-going MEG data: a mechanistic whole-brain model of empirical MEG data. _NeuroImage_ 152, 538–550 (2017). Article PubMed
Google Scholar * Deco, G. et al. Awakening: predicting external stimulation forcing transitions between different brain states. _Proc. Natl Acad. Sci. USA_ 116, 18088–18097 (2019). Article
PubMed PubMed Central Google Scholar * Gilson, M. et al. Effective connectivity inferred from fMRI transition dynamics during movie viewing points to a balanced reconfiguration of
cortical interactions. _NeuroImage_ 180, 534–546 (2017). Article PubMed Google Scholar * Granger, C. Testing for causality. _J. Econ. Dyn. Control_ 2, 329–352 (1980). Article Google
Scholar * Schreiber, T. Measuring information transfer. _Phys. Rev. Lett._ 85, 461–464 (2000). Article PubMed Google Scholar * Vicente, R., Wibral, M., Lindner, M. & Pipa, G.
Transfer entropy—a model-free measure of effective connectivity for the neurosciences. _J. Comput. Neurosci._ 30, 45–67 (2011). Article PubMed Google Scholar * Brovelli, A., Chicharro,
D., Badier, J. M., Wang, H. & Jirsa, V. Characterization of cortical networks and corticocortical functional connectivity mediating arbitrary visuomotor mapping. _J. Neurosci._ 35,
12643–12658 (2015). Article PubMed PubMed Central Google Scholar * Chicharro, D. & Ledberg, A. Framework to study dynamic dependencies in networks of interacting processes. _Phys.
Rev. E_ 86, 041901 (2012). Article Google Scholar * Wibral, M., Vicente, R. & Lindner, M. in _Directed Information Measures in Neuroscience_ (eds. Wibral, M. et al.) 3–36 (Springer,
2014). * Frassle, S. et al. Regression DCM for fMRI. _NeuroImage_ 155, 406–421 (2017). Article PubMed Google Scholar * Prando, G. et al. Sparse DCM for whole-brain effective connectivity
from resting-state fMRI data. _NeuroImage_ 208, 116367 (2020). Article PubMed Google Scholar * Razi, A. et al. Large-scale DCMs for resting-state fMRI. _Netw. Neurosci._ 1, 222–241
(2017). Article PubMed PubMed Central Google Scholar Download references ACKNOWLEDGEMENTS G.D. is supported by grant no. PID2022-136216NB-I00 funded by MICIU/AEI/10.13039/501100011033
and by ‘ERDF A way of making Europe’, ERDF, EU, Project NEurological MEchanismS of Injury, and Sleep-like cellular dynamics (NEMESIS; ref. 101071900) funded by the EU ERC Synergy Horizon
Europe, and AGAUR research support grant (ref. 2021 SGR 00917) funded by the Department of Research and Universities of the Generalitat of Catalunya. Y.S.P. is supported by the project
NEurological MEchanismS of Injury, and Sleep-like cellular dynamics (NEMESIS; ref. 101071900) funded by the EU ERC Synergy Horizon Europe. M.L.K. is supported by the Centre for Eudaimonia
and Human Flourishing (funded by the Pettit and Carlsberg Foundations) and the Center for Music in the Brain (funded by the Danish National Research Foundation, DNRF117). The neuroimaging
analysis and whole-brain modeling is based on clinical research carried out at the National Institute for Health Research/Wellcome Trust Imperial Clinical Research Facility. The open-label
trial was funded by a Medical Research Council clinical development scheme grant (MR/J00460X/1). The double-blind randomized controlled trial was funded by a private donation from the
Alexander Mosley Charitable Trust, supplemented by Founders of Imperial College London’s Centre for Psychedelic Research. The funders had no role in study design, data collection and
analysis, decision to publish or preparation of the paper. AUTHOR INFORMATION AUTHORS AND AFFILIATIONS * Center for Brain and Cognition, Computational Neuroscience Group, Department of
Information and Communication Technologies, Universitat Pompeu Fabra, Barcelona, Spain Gustavo Deco & Yonatan Sanz Perl * Institució Catalana de la Recerca i Estudis Avançats (ICREA),
Barcelona, Spain Gustavo Deco * Department of Physics, University of Buenos Aires, Buenos Aires, Argentina Yonatan Sanz Perl * School of Mathematics, University of Birmingham, Birmingham, UK
Samuel Johnson * The Alan Turing Institute, London, UK Samuel Johnson * Centre for Eudaimonia and Human Flourishing, Linacre College, University of Oxford, Oxford, UK Niamh Bourke &
Morten L. Kringelbach * Department of Psychiatry, University of Oxford, Oxford, UK Niamh Bourke & Morten L. Kringelbach * Centre for Psychedelic Research, Department of Brain Sciences,
Imperial College London, London, UK Robin L. Carhart-Harris * Psychedelics Division, Neuroscape, Department of Neurology, University of California, San Francisco, CA, USA Robin L.
Carhart-Harris * Center for Music in the Brain, Department of Clinical Medicine, Aarhus University, Aarhus, Denmark Morten L. Kringelbach Authors * Gustavo Deco View author publications You
can also search for this author inPubMed Google Scholar * Yonatan Sanz Perl View author publications You can also search for this author inPubMed Google Scholar * Samuel Johnson View author
publications You can also search for this author inPubMed Google Scholar * Niamh Bourke View author publications You can also search for this author inPubMed Google Scholar * Robin L.
Carhart-Harris View author publications You can also search for this author inPubMed Google Scholar * Morten L. Kringelbach View author publications You can also search for this author
inPubMed Google Scholar CONTRIBUTIONS All authors designed the study, developed the methods, performed the analyses, and wrote and edited the paper. CORRESPONDING AUTHORS Correspondence to
Gustavo Deco or Morten L. Kringelbach. ETHICS DECLARATIONS COMPETING INTERESTS R.L.C.-H. reports receiving consulting fees from COMPASS Pathways, Entheon Biomedical, Mydecine, Synthesis
Institute, Tryp Therapeutics and Usona Institute. The other authors declare no competing interests. PEER REVIEW PEER REVIEW INFORMATION _Nature Mental Health_ thanks Richard Dear, Alec
Jamieson, Jakob Kaminski and Lucina Uddin for their contribution to the peer review of this work. ADDITIONAL INFORMATION PUBLISHER’S NOTE Springer Nature remains neutral with regard to
jurisdictional claims in published maps and institutional affiliations. SUPPLEMENTARY INFORMATION SUPPLEMENTARY INFORMATION Supplementary methods, Figs. 1–7 and Tables 1–8. REPORTING SUMMARY
RIGHTS AND PERMISSIONS OPEN ACCESS This article is licensed under a Creative Commons Attribution 4.0 International License, which permits use, sharing, adaptation, distribution and
reproduction in any medium or format, as long as you give appropriate credit to the original author(s) and the source, provide a link to the Creative Commons licence, and indicate if changes
were made. The images or other third party material in this article are included in the article’s Creative Commons licence, unless indicated otherwise in a credit line to the material. If
material is not included in the article’s Creative Commons licence and your intended use is not permitted by statutory regulation or exceeds the permitted use, you will need to obtain
permission directly from the copyright holder. To view a copy of this licence, visit http://creativecommons.org/licenses/by/4.0/. Reprints and permissions ABOUT THIS ARTICLE CITE THIS
ARTICLE Deco, G., Sanz Perl, Y., Johnson, S. _et al._ Different hierarchical reconfigurations in the brain by psilocybin and escitalopram for depression. _Nat. Mental Health_ 2, 1096–1110
(2024). https://doi.org/10.1038/s44220-024-00298-y Download citation * Received: 22 November 2023 * Accepted: 12 July 2024 * Published: 05 August 2024 * Issue Date: September 2024 * DOI:
https://doi.org/10.1038/s44220-024-00298-y SHARE THIS ARTICLE Anyone you share the following link with will be able to read this content: Get shareable link Sorry, a shareable link is not
currently available for this article. Copy to clipboard Provided by the Springer Nature SharedIt content-sharing initiative