8. Computational tools and methods
- Select a language for the TTS:
- UK English Female
- UK English Male
- US English Female
- US English Male
- Australian Female
- Australian Male
- Language selected: (auto detect) - EN
Play all audios:

Robust statistical pipelines and novel computational methods enable large-scale integrative analysis of reference epigenomes You have full access to this article via your institution.
Download PDF REFERENCE EPIGENOME MAPPING ACROSS TISSUES AND CELL TYPES INTEGRATIVE ANALYSIS OF 111 REFERENCE HUMAN EPIGENOMES. Roadmap Epigenomics Consortium _et al.Nature_
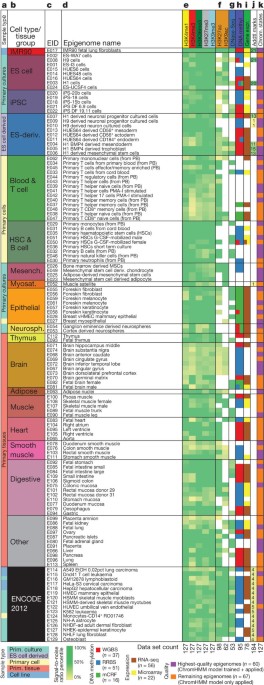
10.1038/nature14252 We jointly processed and analyzed our 111 reference epigenomes with 16 additional epigenomes from ENCODE 9,23. We generated genome-wide normalized coverage tracks, peaks
and broad enriched domains for ChIP-seq and DNase-seq 7,32, normalized gene expression values for RNA-seq 33, and fractional methylation levels for each CpG site 31,34,35. We computed
several quality control measures (Fig. 2, Table S1) including: number of distinct uniquely mapped reads; the fraction of mapped reads overlapping areas of enrichment 18,36 ; genome-wide
strand cross-correlation 37 (Fig. 2e-g); inter-replicate correlation; multidimensional scaling of datasets from different production centers (Fig. S1); correlation across pairs of datasets
(Extended Data 1e); consistency between assays carried out in multiple mapping centers (Table S2); and read mapping quality for bisulfite-treated reads 38,39. Outlier datasets were flagged,
removed or replaced, and lower-coverage datasets were combined when possible (See Methods). FINE-MAPPED GENETIC ARCHITECTURE OF DISEASE GENETIC AND EPIGENETIC FINE MAPPING OF CAUSAL
AUTOIMMUNE DISEASE VARIANTS. Farh, K. K.-H. _et al.Nature_ 10.1038/nature13835 Prior studies that have integrated GWAS with epigenomic features focused on lead SNPs or multiple associated
SNPs within a locus, of which only a small minority reflects causal variants10,16–19,21. Although these studies demonstrated enrichments within enhancer-like regulatory elements, they could
not with any degree of certainty pinpoint the specific elements or processes affected by the causal variants. To overcome this limitation, we leveraged dense genotyping data to refine a
statistical model for predicting causal SNPs from genetic data alone. Rare recombination events within haplotypes can provide information on the identity of the causal SNP, provided
sufficient genotyping density and sample size. We therefore examined a cohort of 14,277 cases with multiple sclerosis and 23,605 healthy controls genotyped using the Immunochip, which
comprehensively covers 1000 Genomes Project SNPs22 within 186 loci associated with autoimmunity20. We developed an algorithm, Probabilistic Identification of Causal SNPs (PICS), that
estimates the probability that an individual SNP is a causal variant given the haplotype structure and observed pattern of association at the locus (Methods, Extended Data Figs 1–4). […] We
next generalized PICS to analyze 21 autoimmune diseases, using Immunochip data when they were available or imputation to the 1000 Genomes Project22 when they were not (Methods; Supplementary
Table 1). We mapped 636 autoimmune GWAS signals to 4,950 candidate causal SNPs (mean probability of representing the causal variant responsible for the GWAS signal: ~10%). PICS indicates
that index SNPs reported in the GWAS catalogue have on average only a 5% chance of representing a causal SNP. Rather, GWAS catalogue index SNPs are typically some distance from the PICS lead
SNP (median 14 kb), and many are not in tight LD (Fig. 1d, Extended Data Fig. 5). PICS identified a single most likely causal SNP (>75% probability) at 12% of loci linked to
autoimmunity. However, most GWAS signals could not be fully resolved due to LD and thus contain several candidate causal SNPs (Fig. 1e). To confirm the functional significance of fine-mapped
SNPs, we compared PICS SNPs against a strict background of random SNPs drawn from the same loci. Candidate causal SNPs derived by PICS were strongly enriched for protein-coding (missense,
nonsense, frameshift) changes, which account for 14% of the predicted causal variants compared to just 4% of the random SNPs. Modest enrichments over the locus background were also observed
for synonymous substitutions (5%), 3′ UTRs (3%), and splice junctions (0.2%) (Fig. 1f). Although these results support the efficacy of PICS for identifying causal variants, ~90% of GWAS hits
for autoimmune diseases remain unexplained by protein-coding variants. Candidate causal SNPs and the PICS algorithm are available through an accompanying online portal
(http://www.broadinstitute.org/pubs/finemapping). EPIGENOMIC ANNOTATION OF GENETIC VARIANTS USING THE ROADMAP EPIGENOME BROWSER. Zhou, X. _et al.Nature Biotechnology_ 10.1038/nbt.3158
Advances in next-generation sequencing platforms have reshaped the landscape of functional genomic and epigenomic research as well as human genetics studies. Annotation of noncoding regions
in the genome with genomic and epigenomic data has facilitated the generation of new, testable hypotheses regarding the functional consequences of genetic variants associated with human
complex traits1,2. Large consortia, such as the US National Institutes of Health (NIH) Roadmap Epigenomics Consortium3 and ENCODE4, have generated tens of thousands of sequencing-based
genome-wide data sets, creating a useful resource for the scientific community5. The WashU Epigenome Browser6-8 continues to provide a platform for investigators to effectively engage with
this resource in the context of analyzing their own data. Here, we describe the Roadmap Epigenome Browser (http://epigenomegateway.wustl.edu/browser/roadmap), which is based on the WashU
Epigenome Browser and integrates data from both the NIH Roadmap Epigenomics Consortium and ENCODE in a visualization and bioinformatics tool that enables researchers to explore the
tissue-specific regulatory roles of genetic variants in the context of diseases. The Browser takes advantage of over 10,000 epigenomic data sets it currently hosts, including 346 ‘complete
epigenomes’, defined as tissues and cell types for which we have collected a complete set of DNA methylation, histone modification, open chromatin and other genomic datasets9. Data from both
the NIH Roadmap Epigenomics and ENCODE resources are seamlessly integrated in the browser using a new Data Hub Cluster framework. Investigators can specify any number of SNP-associated
regions and any type of epigenomic data, for which the browser automatically creates “virtual data hubs” through a shared hierarchical metadata annotation, retrieves the data, and performs
real-time clustering analysis. Investigators interact with the Browser to determine the tissue specificity of the epigenetic state encompassing genetic variants in physiologically or
pathogenically relevant cell types from normal or diseased samples. We illustrate the epigenomic annotation of two noncoding SNPs, identified from genome-wide association studies of people
with multiple sclerosis10, by clustering the histone H3K4me1 profile of SNP-harboring regions and RNA-seq signal of their closest genes across multiple primary tissues and cells (Fig. 1).
Both SNPs lie within putative enhancer regions. Whereas rs307896 marks an enhancer common across cell types, rs756699 is located in an enhancer specific to immune cells and is potentially
targeting TCF7, a T cell specific gene 3.8kb downstream (Fig. 1). Thus, reference epigenomes provide important clues into the functional relevance of these genetic variants in the context of
the pathophysiology of multiple sclerosis, including inflammation11. Investigators can also use the browser to identify co-variation of epigenomic, transcriptomic, and transcription factor
binding profiles across cell types to predict relationships between regulatory sites and target genes. Additionally, investigators can explore multiple complete reference epigenomes in
different browser panels in parallel using synchronized genomic coordinates or independent genomic coordinates. A variety of Epigenome Browser functions, including gene set view, genome
juxtaposition, chromatin interaction display and statistical testing, can be applied to better engage with this epigenomic resource. We also provide the means for investigators to build
their own Data Hub Clusters of different scales and clone the browser on Amazon Cloud to visualize and analyze private data in the context of public data. These tools, along with the rapidly
growing epigenomic datasets of human cells of different states, will facilitate the translation of genetic signals into molecular mechanisms, leading to prognostic, diagnostic and
therapeutic advances. MAPPING ORTHOLOGOUS REGULATORY REGIONS BETWEEN MOUSE AND HUMAN CONSERVED EPIGENOMIC SIGNALS IN MICE AND HUMANS REVEAL IMMUNE BASIS OF ALZHEIMER’S DISEASE. Gjoneska, E.
_et al.Nature_ 10.1038/nature14252 We mapped orthologous genes between mouse and human using ENSEMBL one-to-one orthologs (see Methods). We also mapped orthologous non-coding regions using
multiple mammalian sequence alignments, mapping each mouse peak to its best human match (see Methods). We found matches for 90% of promoter regions, 84% of enhancers, 74% of
Polycomb-repressed regions, and 33% of heterochromatin regions (Supplementary Table S3). Comparing our mouse chromatin states to human hippocampus chromatin states 10, we found significant
epigenomic conservation at orthologous non-coding regions (Extended Data Fig. 3b), consistent with recent results 11. IDENTIFICATION OF ORTHOLOGOUS HUMAN REGIONS CONSERVED EPIGENOMIC SIGNALS
IN MICE AND HUMANS REVEAL IMMUNE BASIS OF ALZHEIMER’S DISEASE. Gjoneska, E. _et al.Nature_ 10.1038/nature14252 The promoter (H3K4me3 peaks annotated as transcription start site by chromatin
state), enhancer (H3K27ac peaks annotated as enhancer by chromatin state), and Polycomb-repressed regions (H3K27me3 peaks annotated as Polycomb-repressed by chromatin state) were mapped to
the human genome. BED files representing the coordinates of these peaks in mm9 were mapped to mm10 using liftover 44. Those peaks were mapped compared to the human genome the UCSC multiple
alignment chain files (http://hgdownload.soe.ucsc.edu/goldenPath/mm10/multiz60way/)45. More specifically, the alignments that overlap the mouse peak and include hg19 were extracted. We
calculated the human mouse pairwise alignment for each multiple alignment using the “globalms” function of biopython (http://biopython.org/, version 1.59; python version 2.71). The highest
scoring pairwise alignment formed base of the orthologous region in human. This region was extended on either side using lower scoring multiple alignments. The orthologous region in hg19 was
required to be greater than 30bp and no more than twice the length of the region in mouse. The mean conservation was examined using the PHASTCons score across placental mammals46 based on
the same 60-way multiple sequence alignment. The mapped enhancer regions were annotated with their chromatin state in human hippocampus, and across all 127 cell types and tissues, using
BEDTools47. EPIGRAM — A PIPELINE TO PREDICT HISTONE MODIFICATION AND DNA METHYLATION PATTERNS FROM DNA MOTIFS PREDICTING THE HUMAN EPIGENOME FROM DNA MOTIFS. Whitaker, J. W., Chen, Z. &
Wang, W. _Nature Methods_ 10.1038/nmeth.3065 Herein, we used our analysis pipeline, Epigram, to capture the cis elements that interact with the dynamic regulatory program to shape the
epigenome (Fig. 1b). By surveying various cell types, we revealed mark-specific motifs, which may be universally recognized by chromatin-modifying enzymes, and motifs with cell type–specific
interplay, which may be recognized by cell type–specific cofactors. We applied this approach to predicting the placement of six histone modifications and DNA methylation valleys (DMVs) in
five cell types17: human embryonic stem cells (H1), neural progenitor cells (NPC), trophoblast-like cells (TBL), mesendoderm cells (ME) and mesenchymal stem cells (MSC) (Fig. 1c). To tease
out the _cis_ elements that are recognized by epigenomic regulatory factors, we removed simple sequence biases such as G+C content during analysis. We observed that motifs have location
preferences within modified regions, such as the center of H3K27ac or the edge of H3K4me3 or H3K9me3. Furthermore, we demonstrated the importance of Epigram motifs in the regulation of
histone modification through the significant correlation between their disruption and inter-individual H3K27ac variation. Our study provides a catalog of cis elements that play important
roles in shaping the epigenomic modifications, which is useful for designing new epigenome-editing tools. We first examined whether DNA motifs could distinguish genomic regions that possess
modified histones from regions that do not possess any modified histones. For the sake of discussion, we refer to this as the ‘single-mark analysis’. We started by correcting a potential
bias in the chromatin immunoprecipitation–sequencing (ChIP-seq) data that can be caused by the preferential sequencing of (G+C)-rich genomic fragments 18,19 (Fig. 1d). GENBOREE WORKBENCH
BRINGS TOGETHER EPIGENOMIC DATA AND TOOLS INTEGRATIVE ANALYSIS OF 111 REFERENCE HUMAN EPIGENOMES. Roadmap Epigenomics Consortium _et al.Nature_ 10.1038/nature14248 On-line tools integrated
within the Genboree Workbench enable the types of analyses reported in [EC14 Amin V et al. Nature Comm. 2015] and in Figure 4i, [Roadmap Epigenomics Consortium et al. Nature 2015]. The tools
enable users to carry out similar types of analyses by using either consortium-generated or their own epigenomic profiling data. To learn how to use the tools, check the on-line tutorial at
http://genboree.org/theCommons/projects/aminv-natcomm-2015/wiki. RECOMMENDATIONS FOR METHYLATION ANALYSIS BY WHOLE-GENOME BISULFITE SEQUENCING COVERAGE RECOMMENDATIONS FOR METHYLATION
ANALYSIS BY WHOLE-GENOME BISULFITE SEQUENCING. Ziller, M. J., Hansen, K. D., Meissner, A. & Aryee, M. J. _Nature_ 10.1038/nmeth.3152 Whole genome bisulfite sequencing (WGBS) allows
unbiased genome-wide DNA methylation profiling but the associated high sequencing costs continue to limit its widespread application. To experimentally determine the minimal sequencing
requirements we utilized several high coverage reference data sets for our analysis. Here, we present the data derived recommendations for minimum sequencing depth for WGBS libraries,
highlight what is gained with increasing coverage and discuss the trade off between sequencing depth and number of assayed replicates. METHOD FOR METHYLC-SEQ LIBRARY PREPARATION METHYLC-SEQ
LIBRARY PREPARATION FOR BASE-RESOLUTION WHOLE-GENOME BISULFITE SEQUENCING. Urich, M. A. _et al.Nature Protocols_ 10.1038/nprot.2014.114 Overview of MethlyC-seq To survey the methylation
states of cytosines at single-base resolution on a genome-wide scale, we developed a whole-genome bisulfite sequencing approach called MethylC-seq (Fig. 1). This method uses high-throughput
DNA sequencing of genomic DNA subjected to sodium bisulfite conversion15–18. After deep sequencing of a library generated from fragments of sodium bisulfite–treated DNA, the basecall at each
cytosine reference position indicates the original methylation status of the cytosine in each genomic DNA (gDNA) fragment, where a thymine indicates that it was unmethylated and a cytosine
indicates that it was methylated. The frequency of DNA methylation at any cytosine with sufficient sequence coverage can be estimated for the population of genomes that comprised the genomic
DNA sample. Typical methylomes generated by MethylC-seq for mouse, human and Arabidopsis genomes achieve coverage of >90–95% of the cytosines in the genome6,19. This protocol is largely
framed around standard protocols designed to construct DNA sequencing libraries, but substantial modifications have been made such as eliminating all electrophoresis and gel extraction
steps, adding the sodium bisulfite conversion reaction and making modifications to the number of PCR cycles. Briefly, purified genomic DNA (50 ng–2 µg) is fragmented, end repaired,
3’-adenylated and ligated to sequencing adapters in which all cytosines are methylated. Adapter-ligated DNA is then subjected to bisulfite conversion, after which limited amplification of
the library is performed by PCR using primers specific for the sequencing adapters. The resulting library is then ready for sequencing after library quantification. CHROMIMPUTE FOR
LARGE-SCALE EPIGENOME IMPUTATION LARGE-SCALE IMPUTATION OF EPIGENOMIC DATASETS FOR SYSTEMATIC ANNOTATION OF DIVERSE HUMAN TISSUES. Ernst, J. & Kellis, M. _Nature Biotechnology_
10.1038/nbt.3157 Here, we take an ensemble regression-based approach to epigenomic imputation. We impute each target mark in each target sample separately, by combining information from
large numbers of datasets that were experimentally determined, but without using any data for the target mark in the target cell type (Fig. 1a, S1). We leverage two classes of features (see
Methods, Fig. 1d): * Same-sample (different-mark) information (Fig. 1b): The first class of features uses information from the signal of other marks mapped in the target sample, both at the
target position and at neighboring sites. * Same-mark (different-sample) information (Fig. 1c): The second class of features uses information from the signal of the specific mark of interest
at the target position in the most similar samples. Similar samples are defined based on similarity with the signal of marks that have been mapped in the target sample both locally and
globally (see Methods). The features in this class are effectively predictions that could be made by a K-nearest neighbor method for various values of K and distance functions. As no
training data is available for the target mark in the target sample, we learn the relationships between the features and the target mark using other samples that contain the target mark. We
use regression trees27, as they can handle nonlinearities (including the constraint that signal values are non-negative), they support combinatorial interactions among features, and they are
relatively fast to train. The prediction for each target mark in each target sample is based on an ensemble predictor that averages the values resulting from regression trees trained on
each sample in which the target mark is available, thus reducing the impact of biases from any one individual predictor RIGHTS AND PERMISSIONS Reprints and permissions ABOUT THIS ARTICLE
CITE THIS ARTICLE 8. Computational tools and methods. _Nature_ (2015). https://doi.org/10.1038/nature14316 Download citation * Published: 18 February 2015 * DOI:
https://doi.org/10.1038/nature14316 SHARE THIS ARTICLE Anyone you share the following link with will be able to read this content: Get shareable link Sorry, a shareable link is not currently
available for this article. Copy to clipboard Provided by the Springer Nature SharedIt content-sharing initiative