Permo–triassic boundary carbon and mercury cycling linked to terrestrial ecosystem collapse
- Select a language for the TTS:
- UK English Female
- UK English Male
- US English Female
- US English Male
- Australian Female
- Australian Male
- Language selected: (auto detect) - EN
Play all audios:

ABSTRACT Records suggest that the Permo–Triassic mass extinction (PTME) involved one of the most severe terrestrial ecosystem collapses of the Phanerozoic. However, it has proved difficult
to constrain the extent of the primary productivity loss on land, hindering our understanding of the effects on global biogeochemistry. We build a new biogeochemical model that couples the
global Hg and C cycles to evaluate the distinct terrestrial contribution to atmosphere–ocean biogeochemistry separated from coeval volcanic fluxes. We show that the large short-lived Hg
spike, and nadirs in δ202Hg and δ13C values at the marine PTME are best explained by a sudden, massive pulse of terrestrial biomass oxidation, while volcanism remains an adequate explanation
for the longer-term geochemical changes. Our modelling shows that a massive collapse of terrestrial ecosystems linked to volcanism-driven environmental change triggered significant
biogeochemical changes, and cascaded organic matter, nutrients, Hg and other organically-bound species into the marine system. SIMILAR CONTENT BEING VIEWED BY OTHERS ASSESSING THE IMPORTANCE
OF THERMOGENIC DEGASSING FROM THE KAROO LARGE IGNEOUS PROVINCE (LIP) IN DRIVING TOARCIAN CARBON CYCLE PERTURBATIONS Article Open access 28 October 2021 SIX-FOLD INCREASE OF ATMOSPHERIC
_P_CO2 DURING THE PERMIAN–TRIASSIC MASS EXTINCTION Article Open access 09 April 2021 PALEOCENE/EOCENE CARBON FEEDBACKS TRIGGERED BY VOLCANIC ACTIVITY Article Open access 31 August 2021
INTRODUCTION The Permo–Triassic mass extinction (PTME) is the largest known extinction in Earth′s history, with the loss of ~90% of species in the sea and ~70% of species on land1,2,3,4. The
PTME has been causally linked to the emplacement of the Siberian Traps Large Igneous Province (LIP) and associated volcanic gas emissions (especially CO2, SO2 and halogens), via widespread
environmental changes such as warming and oceanic anoxia5,6,7,8. The PTME also saw a crisis in terrestrial ecosystems, with loss of plant diversity, increased wildfire activity and
consequent enhanced soil erosion9,10,11,12,13,14. Recent work has shown that the disruption of vegetation started before and culminated at the marine extinction level (Fig. 1), implying that
the environmental disaster impacted terrestrial ecosystems first12,14. The cause of the terrestrial mass extinction is still unclear, and several kill mechanisms have been hypothesised. For
example, a shift from a humid warm climate to an unstable highly seasonal climate and an associated increase in wildfires affected the equatorial Permo–Triassic peatlands, drastically
reducing the abundance and diversity of the flora14; abnormal pollen and spores found in different localities around the world during the PTME interval suggest widespread mutagenesis
possibly linked to an increase in UV-B radiation due to ozone depletion15,16; a terrestrial S-isotope record from the Karoo basin in South Africa could indicate volcanically driven acid rain
at the P–T transition17 that might have also severely impacted the flora. Whilst the taxonomic losses in terrestrial ecosystems are becoming clearer12,18, and local, enhanced input of
terrestrial material into marine environments has been recorded9,11, the biogeochemical impacts and feedbacks on the exogenic C cycle are not known. It is possible that these impacts were
severe: the PTME represents the largest, and maybe the only, known mass extinction of insects19, suggesting that there may have been a substantial decrease in available food sources at the
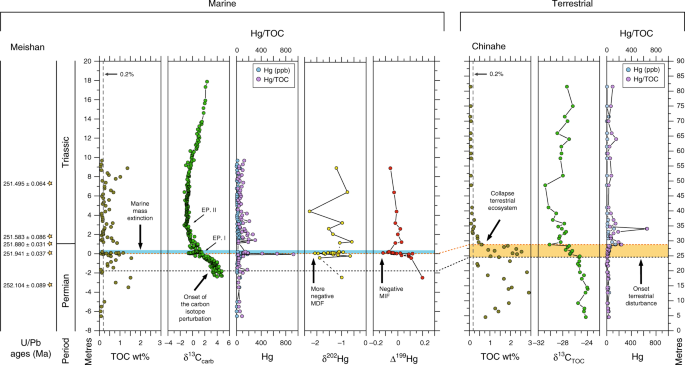
lowest levels of the food chain. The PTME is marked by an approximately two- to four-fold increase in marine sedimentary Hg concentration with respect to background levels during a ~400 kyr
interval also characterised by negative δ13C values20, which implies a relatively long-term injection of Hg and 13C-depleted CO2 into the atmosphere–land–ocean system during this time.
Superimposed on this trend is a prominent, short-lived Hg spike, which is usually expressed as Hg/TOC, given the affinity of Hg with organic matter, and which is coincident with the collapse
of the terrestrial ecosystems14, the onset of the marine mass extinction interval and a sharp minimum in δ13C values (Fig. 1). While higher Hg/TOC values have been reported preceding the
marine extinction in the deep-water settings of Japan21, these are an artefact of normalisation to values of TOC which are below the analytical detection limit (<<0.1%), and do not
track increases in Hg concentrations (see TOC and Hg data in the Supplementary Information of ref. 21). The Hg record is interpreted as evidence of increased Hg input into the Earth's
surface system from the Siberian Traps13,21,22,23,24. However, Hg is also stored in large quantities in terrestrial biomass and soils25,26,27. The mobilisation of these terrestrial
reservoirs during the PTME could also result in the increased loading of Hg to aquatic environments, even without an elevated volcanic Hg flux to the atmosphere23,27,28,29. Any such changes
in the soil and biomass carbon reservoir would also have direct implications for the release of C to the atmosphere and the sedimentary δ13C record. Hg isotopes can be used to better
understand how Hg has been transported into the sedimentary environment. Mass-independent fractionation (MIF—denoted by Δ) occurs due to aqueous photoreduction of Hg2+ to
\({\mathrm{Hg}}_{({\mathrm{g}})}^0\) that takes place in surface waters and in clouds29. This results in positive Δ199Hg values in the remaining water Hg2+ pool, hence positive Δ199Hg values
in sediments dominated by atmospheric Hg2+ deposition. Conversely, slightly negative Δ199Hg values characterise the terrestrial reservoir (soil and biomass), which primarily captures
\({\mathrm{Hg}}_{({\mathrm{g}})}^0\)29. During Hg uptake by plants additional mass-dependent fractionation (MDF) and MIF occur, resulting in more negative δ202Hg and Δ199Hg values29. The
Permian–Triassic boundary shallow-water record of Meishan shows a prominent negative δ202Hg excursion in correspondence to the Hg spike coupled to a small negative Δ199Hg shift, but deeper
water successions show persistent positive Δ199Hg20,21,23,24. Therefore, isotope data appear to indicate that the Hg was transported to the deep-water settings mostly via the atmosphere, and
to the shallow-water settings via continental runoff and via the atmosphere20,21,23,24. The δ13C records at the Permian–Triassic boundary show two minima30,31, which are here called EP. I
and II (EP. = episode) following ref. 30 (Fig. 1). The observed δ13C trends are similarly recorded in different depositional settings and by different substrates (carbonates, bulk organic
matter, separate plant remains)14,30,31,32, strongly indicating that they represent actual changes in the C-isotope composition of the reservoirs of the exogenic C cycle. The Hg
concentration spike occurs in the same interval as the minimum in δ13C values associated with the PTME (EP. I, Fig. 1). At Meishan, where the chronostratigraphic framework is well
established33,34, the initial large Hg spike occurs about 60 Kyrs after the onset of the carbon-isotope perturbation (Fig. 1). Data from non-marine end-Permian successions confirms this
diachrony13,14 (Fig. 1) and show that the Hg spike is also coincident with a sudden decrease in Total Organic Carbon (TOC) values to almost zero14 (Fig. 1). The combination of geochemical
and palaeontological data from these sections shows that the terrestrial ecosystem disruption started with the onset of the carbon-isotope perturbation and climaxed at the very sharp δ13C
minimum (EP. I), coincident with the Hg spike (Fig. 1), and the start of the main marine extinction interval. This mismatch in both timings and fluxes between the C and Hg cycles at the
PTME, suggest that the 13C-depleted C and the Hg came from multiple sources. Overall, the interplay between volcanism and terrestrial reservoir changes in controlling PTME biogeochemistry is
not well known, and previous attempts to model the δ13C record have been fundamentally hampered because of the lack of an independent tracer of the C source. To overcome this, we use
published records of δ13C and Hg systematics to jointly constrain a new coupled C and Hg biogeochemical model. Our model shows that the large, sudden geochemical shifts at the PTME are best
explained by a massive pulse of terrestrial biomass oxidation, while Siberian Traps volcanism can explain the longer-term geochemical changes. RESULTS AND DISCUSSION A COUPLED HG-C CYCLE
MODEL Figure 2 shows the biogeochemical box model developed here. The full model derivation follows in the ‘Methods’ section. The model combines a multi-box sediment–ocean–atmosphere
carbon-alkalinity cycle (based on previous work35,36,37), with the global mercury cycle38,39. The ocean is split into ‘surface’, ‘high-latitude’ and ‘deep’ boxes. It considers ocean
circulation and carbonate speciation, and contains a simplified organic carbon cycle in which burial rates are prescribed. As well as computing the global C and Hg cycles it also computes
δ13C of all C reservoirs and δ202Hg of the ocean reservoirs. A full atmosphere–ocean model of δ202Hg would require dynamic biosphere reservoirs, which would greatly increase model
complexity. We therefore simplify the system to a mixing model for marine δ202Hg, in which atmospheric and riverine inputs have different isotopic signatures. The atmosphere is assumed to
have \(\delta ^{202}{\mathrm{Hg}}_{{\mathrm{atm}}} = - 1\) ‰, and riverine input is assumed to have \(\delta ^{202}{\mathrm{Hg}}_{{\mathrm{runoff}}} = - 3\) ‰, following ref. 40. The model
is set up for the late Permian by reducing the solar constant to that of 250 Ma, and increasing the background tectonic CO2 degassing rate to 1.5 times the present day (_D_ = 1.5), in line
with estimates for the Late Permian41. To obtain the observed pre-event ocean–atmosphere δ13C composition of ~3.5‰, we set the rate of land-derived organic carbon burial to 20% higher than
present day, and adjust the composition of the weathered carbonate reservoir to 3‰. This is consistent with high terrestrial productivity and C burial in the Permian (e.g., coal forests and
mires) and rapid recycling of more recently buried and 13C-enriched carbonate material. In the following paragraphs, we test two model end-member scenarios: (I) the release of volcanic and
thermogenic Hg and C from Siberian Traps activity alone, and (II) with the additional release of Hg and C as a consequence of the collapse of the terrestrial ecosystems. VOLCANIC AND
THERMOGENIC DEGASSING We first model the release of volcanic/volcanogenic Hg and C from the Siberian Traps. Existing radioisotope data show that the extinction, the negative δ13C excursion
and Hg spike might have all occurred during the intrusive phase of the Siberian Traps20,34,42. It is suggested that the emplacement of large sills caused the combustion or thermal
decomposition of organic-rich sediments with the consequent release of thermogenic volatiles, such as C and Hg20,22. It has been proposed that over a ~400 Kyrs intrusive phase the Siberian
Traps emitted ~7600–13,000 Mg yr−1 of volcanic Hg, which included both magmatic and coal-derived Hg20,22,23. Relating this Hg release to the background volcanic source is not straightforward
because estimates of the background source vary, but taking the most likely present day range25 (~90–360 Mg yr−1), and further constraining this by taking into account the need to balance
overall sedimentary burial of Hg (~190 Mg yr−1), and the overall ~50% increase in tectonic degassing in the late Palaeozoic relative to today43, we arrive at a best guess for the background
late Permian Hg flux of ~300 Mg yr−1. This means that the Siberian Traps eruption increased the geogenic Hg input by a factor of ~25–43 over ~400 Kyrs. To test this scenario, we model
Siberian Traps intrusion by increasing the volcanic Hg source by 25–43-fold for 450 Kyrs, while also increasing the CO2 source in line with estimates44,45 for Siberian Traps degassing based
on magma volumes and sediment intrusion (by 4-8 × 10¹² moles/year). The CO2 released by contact metamorphism at the PTME is assumed to have an average δ13C composition of −25‰44.
Specifically, the input functions are: $$f_{CO_{2input}} = \, \left[ { - 253 - 251.99 - 251.98 - 251.56 - 251.55 - 251} \right],\\ \big[ {0\,0\,CO_{2ramp}\,CO_{2ramp}\,0\,0} \big]$$
$$F_{Hg_{input}} = \, \left[ { - 253 - 251.99 - 251.98 - 251.56 - 251.55 - 251} \right],\\ \big[ {1\,1\,Hg_{ramp}\,Hg_{ramp}\,1\,1} \big]$$ Here the first vector is time in millions of years
and the second is the flux alteration at that time. Here \(CO_{2ramp}\) is the additional CO2 release in mol yr−1, and \(Hg_{ramp}\) is the relative Hg degassing rate increase. For the
duration of these pulses, the thermohaline circulation is also assumed to collapse due to warming and freshwater input46. We reduce the circulation term to 1 Sv over this period, which
allows more rapid change in the model surface ocean C isotopes and Hg loading. This is a large reduction, and also reflects the simple structure of the model in which the entire low-latitude
surface ocean is represented by a single box, and so is well-mixed. Figure 3a–d shows that this magnitude and timing of release of C and Hg is capable of driving the longer-term decline in
carbonate δ13C, and the coeval long-term approximately two- to four-fold enrichment in shallow sediment Hg/TOC that is observed in Meishan. However, the model scenario does not capture the
spike in Hg concentration, or nadir in δ13C (EP. I30 in Fig. 1) that are coincident with the final stage of the terrestrial extinction. It also does not produce any substantial change in
marine δ202Hg isotopes (Fig. 1d), because the primary Hg source to the ocean is the atmosphere for the full model run. Within the model, we have also explored a scenario wherein the large Hg
pulse represents a further rapid pulse of LIP volcanism. We have attempted this scenario in Supplementary Note 1 (Scenario I–2), where a 1 Kyr volcanic pulse is assumed to raise the Hg and
C input rates by a further factor of 5. While the Hg/TOC can indeed be explained by an additional short-lived pulse of Hg, we require the total release rate of Hg to be ~200 times greater
than background levels, and even then, this scenario fails to reproduce any of the Hg isotope signature or the nadir in carbonate δ13C (Supplementary Fig. 1). TERRESTRIAL ECOSYSTEM COLLAPSE
For scenario II, we explore the additional effects of a geologically rapid (~1 Kyr) pulse of Hg and C as the result of the collapse of terrestrial ecosystems at the PTME. The magnitude of
this Hg flux is again difficult to quantify precisely, and we explore an increase of 100-fold over background conditions. This level of increase represents the magnitude required to drive
the sedimentary Hg signal that we observe, and is compatible with the available terrestrial biosphere Hg reservoir: total soil Hg is estimated to be on the order of ~106 Mg Hg when
considering a soil depth of ~15 cm47. So, our model Hg delivery flux would require decimetre-scale soil organic matter oxidation over 1000 years, coincident with the PTME and the sharp EP. I
negative δ13C shift11. The Hg pulse is delivered directly to the low-latitude surface ocean via runoff in the model, and is accompanied by a pulse of ‘soil oxidation’ C which we assume
raises the global rate of oxidative weathering by a factor of 30—a number chosen to have the observed level of impact on the C-isotope record while being compatible with the Hg input change.
We also assume a cessation of terrestrial organic C burial. Terrestrial Hg deposition and erosion is not altered during the pulse as the fluxes are minor by comparison. The new model
functions applied in addition to the longer-term inputs of scenario I are: $$F_{Cburial} = \, \left[ { - 253 - 251.951 - 251.950 - 251.949 - 251.948 - 251} \right],\\ \big[
{1\,1\,C_{ramp}\,C_{ramp}\,1\,1} \big]$$ $$F_{oxidw} = \, \left[ { - 253 - 251.951 - 251.950 - 251.949 - 251.948 - 251} \right],\\ \big[ {1\,1\,O_{ramp}\,O_{ramp}\,1\,1} \big]$$ $$F_{runoff}
= \, \left[ { - 253 - 251.951 - 251.950 - 251.949 - 251.948 - 251} \right],\\ \big[ {1\,1\,Hg_{bio}\,Hg_{bio}\,1\,1} \big]$$ Here, the first vector is time in millions of years, and the
second shows flux multipliers at these times. \(C_{ramp},O_{ramp}\) and \(Hg_{bio}\) denote the relative rate of land organic C burial, oxidative weathering and Hg runoff, respectively, and
are set at 0, 30 and 100, respectively, for the duration of the 1-kyr pulse. This ‘biosphere’ pulse causes a short-term large concentration spike in the shallow marine Hg reservoir and its
sediments, which is superimposed on the volcanically driven changes (Fig. 3e–h). The Hg spike is far larger than would be expected from simply increasing the volcanic source by the same
amount because the biospheric Hg is delivered directly to the surface ocean and sedimentation occurs mostly on the shelf. With the inclusion of terrestrial C oxidation and cessation of
terrestrial carbon burial, the model also replicates the transient shift to more negative δ13C values recorded at the marine extinction interval (EP. I30,31 in Fig. 1): Terrestrial C
oxidation is a source of isotopically light C48. The model now also shows a sharp negative δ202Hg shift in the shallow ocean box, which is triggered by increased Hg riverine input, but shows
no change in the deeper ocean, where the source of Hg remains predominantly atmospheric. This also compares well with existing records (Fig. 3). At Meishan, which was located in the margins
of the Yangtze carbonate platform, the Hg and Hg/TOC spike is coincident with more negative δ202Hg values (Fig. 1), while in the deeper water sections of south China the values are more
positive20,23. Hence, oxidation of terrestrial biomass is a compelling scenario to explain the palaeontological, sedimentological and geochemical data. There is clear observational evidence
for the collapse of the terrestrial ecosystems and cessation of terrestrial C burial, stratigraphic evidence supporting the sequence and timing of the events (onset of the δ13C
shift—collapse of the terrestrial ecosystem—Hg and C spike), sufficient quantity of Hg available, consistency with the isotopic evidence for changing Hg sources, and consistency with the
δ13C records. MASSIVE TERRESTRIAL BIOMASS OXIDATION DURING THE PTME Using our coupled C–Hg biogeochemical model, we show that the massive collapse of terrestrial ecosystems and oxidation of
terrestrial biomass during the Permian–Triassic extinction had a huge impact on global Hg and C biogeochemistry. Hg stored in the terrestrial reservoirs was rapidly released as a consequence
of the loss of terrestrial biomass and increased soil erosion9,14. This mechanism is the best explanation for the sharp increased loading of Hg into both terrestrial and marine water bodies
and the negative shift in δ202Hg in coincidence with the marine mass extinction. Contemporaneously, increased soil carbon oxidation introduced large quantities of isotopically light C,
accounting for the sharp negative δ13C anomaly registered in the sedimentary record (EP. I30). In the model, the emission of Hg and C from magma and heating of sedimentary organic matter
during the intrusive phase of the Siberian Traps LIP emplacement can account for the smaller, two- to fourfold increase of Hg concentrations with respect to background levels, and the
relatively longer negative δ13C trend that is recorded by both carbonates and organic matter, in marine and terrestrial settings. A new scenario emerges for the PTME that links the collapse
of ecosystems on land to the global geochemical changes recorded at the marine extinction interval. The disruption of terrestrial environments started during the initial phases of the
Siberian Traps emplacement likely due to the release of volcanic gases as CO2, SO2 and halogens, which could have triggered acid rain, ozone depletion, volcanic darkness, rapid cooling and
subsequent global warming8,49. At the culmination of the terrestrial disturbance interval, when the ecosystems totally collapsed, large amounts of 13C-depleted C and Hg deriving from a
massive oxidation of terrestrial biomass were transported into aqueous habitats causing a steep decline in sedimentary δ13C (carbonates and organic matter), a sedimentary Hg concentrations
spike and a shift in δ202Hg (Fig. 3). At this level, the marine mass extinction started. This, according to the existing chronostratigraphic framework, happened ∼60 Kyrs after the onset of
the carbon-isotope perturbation and of the terrestrial ecological disturbances14 (Fig. 1). The biogeochemical cycle of Hg is intimately linked to the cycle of organic matter and its
constituting elements, such as C, N, S and P50. Hence, besides Hg and C, other organically-bound species would have been transferred from the terrestrial reservoirs into the marine system in
large quantities at EP. I (Fig. 1). Addition of these species, particularly the nutrients P and N, are easily capable of driving ecosystem turnover, anoxia and eutrophication, and it is
likely that this terrestrial input contributed to the marine extinction9,11. Our model does not include these additional cycles, but other models have shown that a relatively small increase
in marine P delivery (2–3-fold) has the potential to drive marine anoxia or euxinia51,52. The scale of the terrestrial ecosystem collapse at the PTME could explain the severity of the biotic
crisis at the Permian–Triassic boundary at all trophic levels, and should be a key consideration for future research. For other events, the Hg records are not so consistent nor as detailed
as for the PTME. However, it is very likely that future research on other intervals could show the same Hg and C patterns as for the PTME. METHODS MODEL DERIVATION This model is designed to
track the transfer and isotopic signature of atmospheric and marine carbon and mercury over geological time, while being broadly applicable to changes on the timescale of ocean circulation.
The biogeochemical system is taken largely from ref. 36, with some additions from refs. 37,53,54, with the underlying hydrological model from ref. 35. The Hg cycle follows ref. 25. MODEL
STRUCTURE The model has three ocean boxes: surface (s), high latitude (h) and deep (d). As in ref. 35, the surface box is 100-m deep and occupies 85% of the ocean surface, whereas the
high-latitude box is 250-m deep and represents 15% of the ocean surface. Each ocean box includes the same biogeochemical species, and a thermohaline circulation mixes the boxes in the order
s, h, d. The upper boxes exchange with the atmosphere, which is a single box. As well as transfer fluxes between ocean and atmosphere boxes, biogeochemical fluxes of weathering, degassing
and burial operate between the surface system and crust. MODEL SPECIES All model species are shown in Table 1. MODEL FLUXES Model fluxes, with equations and present values are shown in Table
2. NON-FLUX CALCULATIONS Atmospheric CO2 volume ratio is calculated as: $${\mathrm{CO}}_2{\mathrm{ppm}} = 280\frac{{{\mathrm{CO}}_{2{\mathrm{a}}}}}{{{\mathrm{CO}}_{2{\mathrm{a}}_0}}}$$
where \({\mathrm{CO}}_{2{\mathrm{a}}}\) is atmospheric CO2 in moles, and \({\mathrm{CO}}_{2{\mathrm{a}}_0}\) is this value at present day. Global average surface temperature (GAST) is:
$${\mathrm{GAST}} = 288 + {\mathrm{k}}_{{\mathrm{clim}}}\left( {\frac{{{\mathrm{log}}\left( {\frac{{{\mathrm{CO}}_2{\mathrm{ppm}}}}{{280}}} \right)}}{{\log \left( 2 \right)}}} \right) -
7.4\left( {\frac{{{\mathrm{t}}_{{\mathrm{geol}}}}}{{ - 570}}} \right)$$ where kclim is climate sensitivity to doubling CO2, and tgeol is time in millions of years before present and is
expressed in negative terms. Low-latitude surface temperature (Ts) is assumed to scale by \({\textstyle{2 \over 3}}\) times global temperature change, and both high-latitude (Th) and deep
(Td) temperature are assumed to follow global temperature change. For carbonate speciation, effective equilibrium constants are calculated following refs. 36,55:
$${\mathrm{K}}_{{\mathrm{carb}}} = 5.75 \times 10^{ - 4} + 6 \times 10^{ - 6}({\mathrm{T}}_{\mathrm{j}} - 278)$$ $${\mathrm{K}}_{{\mathrm{CO}}_2} = 0.035 + 0.0019({\mathrm{T}}_{\mathrm{j}} -
278)$$ Dissolved carbon species are then calculated following Walker and Kasting36: $$\left[ {{\mathrm{HCO}}_3^ - } \right]_{\mathrm{j}} = \frac{{{\mathrm{DIC}}_{\mathrm{j}} - \sqrt
{{\mathrm{DIC}}_{\mathrm{j}}^2 - {\mathrm{ALK}}_{\mathrm{j}}\left( {2{\mathrm{DIC}}_{\mathrm{j}} - {\mathrm{ALK}}_{\mathrm{j}}} \right)\left( {1 - 4{\mathrm{K}}_{{\mathrm{carb}}}} \right)}
}}{{1 - 4{\mathrm{K}}_{{\mathrm{carb}}}}}$$ $$\left[ {{\mathrm{CO}}_3^{2 - }} \right]_{\mathrm{j}} = \frac{{{\mathrm{ALK}}_{\mathrm{j}} - \left[ {{\mathrm{HCO}}_3^ - }
\right]_{\mathrm{j}}}}{2}$$ $${\mathrm{pCO}}_{2{\mathrm{j}}} = \frac{{{\mathrm{K}}_{{\mathrm{CO}}_{2}}\left[ {{\mathrm{HCO}}_3^ - } \right]^2}}{{[{\mathrm{CO}}_3^{2 - }]}}$$ We also
explicitly calculate [H+] concentration to observe model pH: $$\left[ {{\mathrm{H}}^ + } \right] = {\mathrm{K}}_2\frac{{\left[ {{\mathrm{HCO}}_3^ - } \right]}}{{[{\mathrm{CO}}_3^{2 - }]}}$$
Calcium carbonate saturation state is calculated as: $${\mathrm{\Omega }}_{\mathrm{j}} = \frac{{\left[ {{\mathrm{Ca}}} \right]_{\mathrm{j}}\left[ {{\mathrm{CO}}_3^{2 - }}
\right]_{\mathrm{j}}}}{{{\mathrm{K}}_{{\mathrm{sp}}}}}$$ where Ωj is the CaCO3 saturation state in box j, and Ksp is the solubility product. For terrestrial chemical weathering, temperature
dependence of basalt and granite weathering is calculated as: $${\mathrm{f}}_{{\mathrm{Tbas}}} = {\mathrm{e}}^{0.0608\left( {{\mathrm{GAST}} - 288} \right)}\left( {1 + 0.038\left(
{{\mathrm{GAST}} - 288} \right)} \right)^{0.65}$$ $${\mathrm{f}}_{{\mathrm{Tgran}}} = {\mathrm{e}}^{0.0724\left( {{\mathrm{GAST}} - 288} \right)}\left( {1 + 0.038\left( {{\mathrm{GAST}} -
288} \right)} \right)^{0.65}$$ And temperature dependence of carbonate weathering: $${\mathrm{f}}_{{\mathrm{Tcarb}}} = 1 + 0.087({\mathrm{GAST}} - 288)$$ FIXED PARAMETERS Fixed parameters
are shown in Table 3. DIFFERENTIAL EQUATIONS The following equations track the 11 non-water species from Table 1. Atmospheric CO2: $$\frac{{\mathrm{d}}\left( {{\mathrm{CO}}_{2{\mathrm{a}}}}
\right)}{{{\mathrm{dt}}}} = - {\mathrm{f}}_{{\mathrm{airsea}}_{\mathrm{s}}} - {\mathrm{f}}_{{\mathrm{airsea}}_{\mathrm{h}}} + {\mathrm{f}}_{{\mathrm{ccdeg}}} +
{\mathrm{f}}_{{\mathrm{ocdeg}}} + {\mathrm{f}}_{{\mathrm{oxidw}}} - {\mathrm{f}}_{{\mathrm{locb}}} - {\mathrm{f}}_{{\mathrm{carbw}}} - 2{\mathrm{f}}_{{\mathrm{silw}}} +
{\mathrm{f}}_{{\mathrm{CO}}_{2\mathrm{input}}}$$ Low-latitude surface ocean DIC: $$\frac{{\mathrm{d}}\left( {{\mathrm{DIC}}_{\mathrm{s}}} \right)}{{{\mathrm{dt}}}} =
{\mathrm{f}}_{{\mathrm{airsea}}_{\mathrm{s}}} + {\mathrm{tran}}_{{\mathrm{DIC}}_{\mathrm{ds}}} - {\mathrm{tran}}_{{\mathrm{DIC}}_{\mathrm{sh}}} + 2{\mathrm{f}}_{{\mathrm{carbw}}} +
2{\mathrm{f}}_{{\mathrm{silw}}} - {\mathrm{f}}_{{\mathrm{mccb}}} - {\mathrm{f}}_{{\mathrm{mocb}}}$$ High-latitude surface ocean DIC: $$\frac{{\mathrm{d}}\left( {{\mathrm{DIC}}_{\mathrm{h}}}
\right)}{{{\mathrm{dt}}}} = {\mathrm{f}}_{{\mathrm{airsea}}_{\mathrm{h}}} + {\mathrm{tran}}_{{\mathrm{DIC}}_{\mathrm{sh}}} - {\mathrm{tran}}_{{\mathrm{DIC}}_{\mathrm{hd}}}$$ Deep ocean DIC:
$$\frac{{\mathrm{d}}\left( {{\mathrm{DIC}}_{\mathrm{d}}} \right)}{{{\mathrm{dt}}}} = {\mathrm{tran}}_{{\mathrm{DIC}}_{\mathrm{hd}}} - {\mathrm{tran}}_{{\mathrm{DIC}}_{\mathrm{ds}}}$$
Low-latitude surface ocean alkalinity: $$\frac{{{\mathrm{d}}\left( {{\mathrm{ALK}}_{\mathrm{s}}} \right)}}{{{\mathrm{dt}}}} = {\mathrm{tran}}_{{\mathrm{ALK}}_{\mathrm{ds}}} -
{\mathrm{tran}}_{{\mathrm{ALK}}_{\mathrm{sh}}} + 2{\mathrm{f}}_{{\mathrm{carbw}}} + 2{\mathrm{f}}_{{\mathrm{silw}}} - 2{\mathrm{f}}_{{\mathrm{mccb}}}$$ High-latitude surface ocean
alkalinity: $$\frac{{\mathrm{d}}\left( {{\mathrm{ALK}}_{\mathrm{h}}} \right)}{{{\mathrm{dt}}}} = {\mathrm{tran}}_{{\mathrm{ALK}}_{\mathrm{sh}}} -
{\mathrm{tran}}_{{\mathrm{ALK}}_{\mathrm{hd}}}$$ Deep ocean alkalinity: $$\frac{{\mathrm{d}}\left( {{\mathrm{ALK}}_{\mathrm{d}}} \right)}{{{\mathrm{dt}}}} =
{\mathrm{tran}}_{{\mathrm{ALK}}_{\mathrm{hd}}} - {\mathrm{tran}}_{{\mathrm{ALK}}_{\mathrm{ds}}}$$ δ13C of atmospheric CO2: $$\frac{{\mathrm{d}}\left( {\delta
^{13}{\mathrm{CO}}_{2{\mathrm{a}}} \cdot {\mathrm{CO}}_{2{\mathrm{a}}}} \right)}{{{\mathrm{dt}}}} = - {\mathrm{f}}_{{\mathrm{airsea}}_{\mathrm{s}}}\delta ^{13}{\mathrm{C}}_{{\mathrm{atm}}} -
{\mathrm{f}}_{{\mathrm{airsea}}_{\mathrm{h}}}\delta ^{13}{\mathrm{C}}_{{\mathrm{atm}}} + {\mathrm{f}}_{{\mathrm{ccdeg}}}\delta ^{13}{\mathrm{C}}_{\mathrm{C}} \\ +
{\mathrm{f}}_{{\mathrm{ocdeg}}}\delta ^{13}{\mathrm{C}}_{\mathrm{G}} + {\mathrm{f}}_{{\mathrm{oxidw}}}\delta ^{13}{\mathrm{C}}_{\mathrm{G}} - {\mathrm{f}}_{{\mathrm{locb}}} \left( {\delta
^{13}{\mathrm{C}}_{{\mathrm{atm}}}\, - \Delta {\mathrm{B}}} \right) \\ - {\mathrm{f}}_{{\mathrm{carbw}}}\delta ^{13}{\mathrm{C}}_{{\mathrm{atm}}} - 2{\mathrm{f}}_{{\mathrm{silw}}}\delta
^{13}{\mathrm{C}}_{{\mathrm{atm}}} + {\mathrm{f}}_{{\mathrm{CO}}_{2{\mathrm{input}}}}\delta ^{13}{\mathrm{C}}_{{\mathrm{input}}}$$ δ13C of low-latitude surface ocean DIC:
$$\frac{{\mathrm{d}}\left( {\delta} ^{13}{\mathrm{DIC}}_{\mathrm{s}} \cdot {\mathrm{DIC}}_{\mathrm{s}} \right)}{{{\mathrm{dt}}}} = \, {\mathrm{f}}_{{\mathrm{airsea}}_{\mathrm{s}}}{\delta}
^{13}{\mathrm{C}}_{{\mathrm{atm}}} + {\mathrm{tran}}_{{\mathrm{DIC}}_{\mathrm{ds}}}{\delta} ^{13}{\mathrm{DIC}}_{\mathrm{d}} \, - {\mathrm{tran}}_{{\mathrm{DIC}}_{\mathrm{sh}}}{\delta}
^{13}{\mathrm{DIC}}_{\mathrm{s}} \\ + {\mathrm{f}}_{{\mathrm{carbw}}}{\delta} ^{13}{\mathrm{C}}_{{\mathrm{atm}}} + {\mathrm{f}}_{{\mathrm{carbw}}}{\delta} ^{13}{\mathrm{C}}_{\mathrm{C}}\, +
2{\mathrm{f}}_{{\mathrm{silw}}}{\delta} ^{13}{\mathrm{C}}_{{\mathrm{atm}}} \\ - {\mathrm{f}}_{{\mathrm{mccb}}}{\delta} ^{13}{\mathrm{DIC}}_{\mathrm{s}} -
{\mathrm{f}}_{{\mathrm{mocb}}}({\delta} ^{13}{\mathrm{DIC}}_{\mathrm{s}} - {\Delta} {\mathrm{B}})$$ δ13C of high-latitude surface ocean DIC: $$\frac{{{\mathrm{d}}\left( {{\updelta
}}^{13}{\mathrm{DIC}}_{\mathrm{h}} \cdot {\mathrm{DIC}}_{\mathrm{h}} \right)}}{{{\mathrm{dt}}}} = {\mathrm{f}}_{{\mathrm{airsea}}_{\mathrm{h}}}{\updelta}^{13}{\mathrm{C}}_{{\mathrm{atm}}} +
{\mathrm{tran}}_{{\mathrm{DIC}}_{\mathrm{sh}}}{\updelta}^{13}{\mathrm{DIC}}_{\mathrm{s}} - {\mathrm{tran}}_{{\mathrm{DIC}}_{\mathrm{hd}}}{\updelta}^{13}{\mathrm{DIC}}_{\mathrm{h}}$$ δ13C of
deep ocean DIC: $$\frac{{\mathrm{d}}\left( {{\updelta }}^{13}{\mathrm{DIC}}_{\mathrm{d}} \cdot {\mathrm{DIC}}_{\mathrm{d}} \right)}{{{\mathrm{dt}}}} =
{\mathrm{tran}}_{{\mathrm{DIC}}_{hd}}{\updelta}^{13}{\mathrm{DIC}}_{\mathrm{h}} - {\mathrm{tran}}_{{\mathrm{DIC}}_{ds}}{\updelta}^{13}{\mathrm{DIC}}_{\mathrm{d}}$$ Atmospheric Hg:
$$\frac{{{\mathrm{d}}\left( {{\mathrm{Hg}}_{\mathrm{a}}} \right)}}{{{\mathrm{dt}}}} =\, {\mathrm{f}}_{{\mathrm{Hg}}_{\mathrm{volc}}} + {\mathrm{f}}_{{\mathrm{Hg}}_{\mathrm{wildfire}}} -
{\mathrm{f}}_{{\mathrm{oceandep}}_{\mathrm{h}}} + {\mathrm{f}}_{{\mathrm{oceaneva}}_{\mathrm{h}}}\\ \, - \,{\mathrm{f}}_{{\mathrm{oceandep}}_{\mathrm{s}}} +
{\mathrm{f}}_{{\mathrm{oceaneva}}_{\mathrm{s}}} - {\mathrm{f}}_{{\mathrm{vegdep}}} + {\mathrm{f}}_{{\mathrm{vegeva}}}$$ Low-latitude surface ocean Hg: $$\frac{{{\mathrm{d}}\left(
{{\mathrm{Hg}}_{\mathrm{s}}} \right)}}{{{\mathrm{dt}}}} = {\mathrm{f}}_{{\mathrm{Hg}}_{\mathrm{runoff}}} + {\mathrm{f}}_{{\mathrm{oceandep}}_{\mathrm{s}}} -
{\mathrm{f}}_{{\mathrm{oceaneva}}_{\mathrm{s}}} + {\mathrm{tran}}_{{\mathrm{Hg}}_{\mathrm{ds}}} - {\mathrm{tran}}_{{\mathrm{Hg}}_{\mathrm{sh}}} - {\mathrm{f}}_{{\mathrm{Hg}}_{\mathrm{b}}}$$
High-latitude surface ocean Hg: $$\frac{{{\mathrm{d}}\left( {{\mathrm{Hg}}_{\mathrm{h}}} \right)}}{{{\mathrm{dt}}}} = {\mathrm{f}}_{{\mathrm{oceandep}}_{\mathrm{h}}} -
{\mathrm{f}}_{{\mathrm{oceaneva}}_{\mathrm{h}}} + {\mathrm{tran}}_{{\mathrm{Hg}}_{\mathrm{sh}}} - {\mathrm{tran}}_{{\mathrm{Hg}}_{\mathrm{hd}}}$$ Deep ocean Hg: $$\frac{{{\mathrm{d}}\left(
{{\mathrm{Hg}}_{\mathrm{d}}} \right)}}{{{\mathrm{dt}}}} = {\mathrm{tran}}_{{\mathrm{Hg}}_{\mathrm{hd}}} - {\mathrm{tran}}_{{\mathrm{Hg}}_{\mathrm{ds}}}$$ δ202Hg of Low-latitude surface ocean
Hg: $$\frac{{{\mathrm{d}}\left( {{\updelta }}^{202}{\mathrm{Hg}}_{\mathrm{s}} \cdot {\mathrm{Hg}}_{\mathrm{s}} \right)}}{{{\mathrm{dt}}}} = \,
{\mathrm{f}}_{{\mathrm{Hg}}_{\mathrm{runoff}}}{\updelta}^{202}{\mathrm{Hg}}_{{\mathrm{runoff}}} +
{\mathrm{f}}_{{\mathrm{oceandep}}_{\mathrm{s}}}{\updelta}^{202}{\mathrm{Hg}}_{{\mathrm{atm}}} - {\mathrm{f}}_{{\mathrm{oceaneva}}_{\mathrm{s}}}{\updelta}^{202}{\mathrm{Hg}}_{\mathrm{s}} \\ +
{\mathrm{tran}}_{{\mathrm{Hg}}_{\mathrm{ds}}}{\updelta}^{202}{\mathrm{Hg}}_{\mathrm{d}} - {\mathrm{tran}}_{{\mathrm{Hg}}_{\mathrm{sh}}}{\updelta}^{202}{\mathrm{Hg}}_{\mathrm{s}} -
{\mathrm{f}}_{{\mathrm{Hg}}_{\mathrm{b}}}{\updelta}^{202}{\mathrm{Hg}}_{\mathrm{s}}$$ δ202Hg of High-latitude surface ocean Hg: $$\frac{{{\mathrm{d}}\left( {{\updelta
}}^{202}{\mathrm{Hg}}_{\mathrm{h}} \cdot {\mathrm{Hg}}_{\mathrm{h}} \right)}}{{{\mathrm{dt}}}} =
\,{\mathrm{f}}_{{\mathrm{oceandep}}_{\mathrm{h}}}{\updelta}^{202}{\mathrm{Hg}}_{{\mathrm{atm}}} - {\mathrm{f}}_{{\mathrm{oceaneva}}_{\mathrm{h}}}{\updelta}^{202}{\mathrm{Hg}}_{\mathrm{h}}\\
\, + {\mathrm{tran}}_{{\mathrm{Hg}}_{\mathrm{sh}}}{\updelta}^{202}{\mathrm{Hg}}_{\mathrm{s}} - {\mathrm{tran}}_{{\mathrm{Hg}}_{\mathrm{hd}}}{\updelta}^{202}{\mathrm{Hg}}_{\mathrm{h}}$$
δ202Hg of Deep ocean Hg: $$\frac{{{\mathrm{d}}\left( {{\updelta }}^{202}{\mathrm{Hg}}_{\mathrm{d}} \cdot {\mathrm{Hg}}_{\mathrm{d}} \right)}}{{{\mathrm{dt}}}} =
{\mathrm{tran}}_{{\mathrm{Hg}}_{\mathrm{hd}}}{\updelta}^{202}{\mathrm{Hg}}_{\mathrm{h}} - {\mathrm{tran}}_{{\mathrm{Hg}}_{\mathrm{ds}}}{\updelta}^{202}{\mathrm{Hg}}_{\mathrm{d}}$$ DATA
AVAILABILITY The geochemical data used in this paper come from already published literature, as cited in the text. CODE AVAILABILITY MATLAB code to run the model is available from B.J.W.
Mills on request. REFERENCES * Erwin, D. H. _The Great Paleozoic Crisis: Life and Death in the Permian_ (Columbia University Press, New York, 1993). Google Scholar * Benton, M. J. _When
Life Nearly Died: The Greatest Mass Extinction of All Time_ (Thames and Hudson, London, 2003). Google Scholar * Song, H., Wignall, P. B., Tong, J. & Yin, H. Two pulses of extinction
during the Permian-Triassic crisis. _Nat. Geosci._ 6, 52–56 (2013). Article ADS CAS Google Scholar * Wignall, P. B. _Extinction: A Very Short Introduction_ (Oxford University Press,
Oxford, 2019). Book Google Scholar * Wignall, P. B. & Twitchett, R. J. Oceanic anoxia and the end permian mass extinction. _Science_ 272, 1155–1158 (1996). Article ADS CAS PubMed
Google Scholar * Isozaki, Y. Permo-Triassic boundary superanoxia and stratified superocean: records from lost deep sea. _Science_ 276, 235–238 (1997). Article CAS PubMed Google Scholar
* Clapham, M. E. & Payne, J. L. Acidification, anoxia, and extinction: a multiple logistic regression analysis of extinction selectivity during the Middle and Late Permian. _Geology_ 39,
1059–1062 (2011). Article ADS CAS Google Scholar * Sun, Y. et al. Lethally hot temperatures during the early triassic greenhouse. _Science_ 338, 366–370 (2012). Article ADS CAS
PubMed Google Scholar * Sephton, M. A. et al. Catastrophic soil erosion during the end-Permian biotic crisis. _Geology_ 33, 941–944 (2005). Article ADS Google Scholar * Zhang, H. et al.
The terrestrial end-Permian mass extinction in South China. _Palaeogeogr. Palaeoclimatol. Palaeoecol._ 448, 108–124 (2016). Article Google Scholar * Kaiho, K. et al. Effects of soil
erosion and anoxic–euxinic ocean in the Permian–Triassic marine crisis. _Heliyon_ 2, e00137 (2016). Article PubMed PubMed Central Google Scholar * Fielding, C. R. et al. Age and pattern
of the southern high-latitude continental end-Permian extinction constrained by multiproxy analysis. _Nat. Commun._ 10, 385 (2019). Article ADS CAS PubMed PubMed Central Google Scholar
* Shen, J. et al. Mercury evidence of intense volcanic effects on land during the Permian-Triassic transition. _Geology_ 47, 1117–1121 (2019). Article ADS CAS Google Scholar * Chu, D.
et al. Ecological disturbance in tropical peatlands prior to marine Permian-Triassic mass extinction. _Geology_ 48, 288–292 (2020). ADS Google Scholar * Visscher, H. et al. Environmental
mutagenesis during the end-Permian ecological crisis. _Proc. Natl Acad. Sci. USA_ 101, 12952–12956 (2004). Article ADS CAS PubMed Google Scholar * Foster, C. B. & Afonin, S. A.
Abnormal pollen grains: an outcome of deteriorating atmospheric conditions around the Permian-Triassic boundary. _J. Geol. Soc. Lond._ 162, 653–659 (2005). Article Google Scholar *
Maruoka, T., Koeberl, C., Hancox, P. J. & Reimold, W. U. Sulfur geochemistry across a terrestrial Permian-Triassic boundary section in the Karoo Basin, South Africa. _Earth Planet. Sci.
Lett._ 206, 101–117 (2003). Article ADS CAS Google Scholar * Nowak, H., Schneebeli-Hermann, E. & Kustatscher, E. No mass extinction for land plants at the Permian–Triassic
transition. _Nat. Commun._ 10, 384 (2019). Article ADS CAS PubMed PubMed Central Google Scholar * Labandeira, C. The fossil record of insect extinction: new approaches and future
directions. _Am. Entomol._ 51, 14–29 (2005). Article Google Scholar * Wang, X. et al. Mercury anomalies across the end Permian mass extinction in South China from shallow and deep water
depositional environments. _Earth Planet. Sci. Lett._ 496, 159–167 (2018). Article ADS CAS Google Scholar * Shen, J. et al. Evidence for a prolonged Permian–Triassic extinction interval
from global marine mercury records. _Nat. Commun._ 10, 1563 (2019). Article ADS PubMed PubMed Central CAS Google Scholar * Sanei, H., Grasby, S. E. & Beauchamp, B. Latest permian
mercury anomalies. _Geology_ 40, 63–66 (2012). Article ADS CAS Google Scholar * Grasby, S. E. et al. Isotopic signatures of mercury contamination in latest Permian oceans. _Geology_ 45,
55–58 (2017). Article ADS CAS Google Scholar * Wang, X. et al. Global mercury cycle during the end-Permian mass extinction and subsequent Early Triassic recovery. _Earth Planet. Sci.
Lett._ 513, 144–155 (2019). Article ADS CAS Google Scholar * Amos, H. M., Jacob, D. J., Streets, D. G. & Sunderland, E. M. Legacy impacts of all-time anthropogenic emissions on the
global mercury cycle. _Glob. Biogeochem. Cycles_ 27, 410–421 (2013). Article ADS CAS Google Scholar * Schuster, P. F. et al. Permafrost stores a globally significant amount of mercury.
_Geophys. Res. Lett._ 45, 1463–1471 (2018). Article ADS CAS Google Scholar * Them, T. R. et al. Terrestrial sources as the primary delivery mechanism of mercury to the oceans across the
Toarcian Oceanic Anoxic Event (Early Jurassic). _Earth Planet. Sci. Lett._ 507, 62–72 (2019). Article ADS CAS Google Scholar * Grasby, S. E., Them, T. R., Chen, Z., Yin, R. &
Ardakani, O. H. Mercury as a proxy for volcanic emissions in the geologic record. _Earth-Sci. Rev._ 196, 102880 (2019). * Thibodeau, A. M. & Bergquist, B. A. Do mercury isotopes record
the signature of massive volcanism in marine sedimentary records? _Geology_ 45, 95–96 (2017). Article ADS CAS Google Scholar * Xie, S. et al. Changes in the global carbon cycle occurred
as two episodes during the Permian-Triassic crisis. _Geology_ 35, 1083–1086 (2007). Article ADS CAS Google Scholar * Song, H. J. et al. The large increase of δ13C carb-depth gradient and
the end-Permian mass extinction. _Sci. China Earth Sci._ 55, 1101–1109 (2012). Article ADS CAS Google Scholar * Wu, Y. et al. Organic carbon isotopes in terrestrial Permian-Triassic
boundary sections of North China: implications for global carbon cycle perturbations. _GSA Bull._ 132, 1106–1118 (2019). Article Google Scholar * Shen, S. Z. et al. Calibrating the
end-Permian mass extinction. _Science_ 334, 1367–1372 (2011). Article ADS CAS PubMed Google Scholar * Burgess, S. D., Bowring, S. & Shen, S. Z. High-precision timeline for Earth′s
most severe extinction. _Proc. Natl Acad. Sci. USA_ 111, 3316–3321 (2014). Article ADS CAS PubMed Google Scholar * Sarmiento, J. L. & Toggweiler, J. R. A new model for the role of
the oceans in determining atmospheric pCO2. _Nature_ 308, 621–624 (1984). Article ADS CAS Google Scholar * Walker, J. C. G. & Kasting, J. F. Effects of fuel and forest conservation
on future levels of atmospheric carbon dioxide. _Palaeogeogr. Palaeoclimatol. Palaeoecol._ 97, 151–189 (1992). Article CAS Google Scholar * Clarkson, M. O. et al. Ocean acidification and
the Permo-Triassic mass extinction. _Science_ 348, 229–232 (2015). Article ADS CAS PubMed Google Scholar * Amos, H. M. et al. Global biogeochemical implications of mercury discharges
from rivers and sediment burial. _Environ. Sci. Technol._ 48, 9514–9522 (2014). Article ADS CAS PubMed Google Scholar * Fendley, I. M. et al. Constraints on the volume and rate of
Deccan Traps flood basalt eruptions using a combination of high-resolution terrestrial mercury records and geochemical box models. _Earth Planet. Sci. Lett._ 524, 115721 (2019). Article CAS
Google Scholar * Sun, R. et al. Modelling the mercury stable isotope distribution of Earth surface reservoirs: Implications for global Hg cycling. _Geochim. Cosmochim. Acta_ 246, 156–173
(2019). Article ADS CAS Google Scholar * Mills, B. J. W. et al. Modelling the long-term carbon cycle, atmospheric CO2, and Earth surface temperature from late Neoproterozoic to present
day. _Gondwana Res._ 67, 172–186 (2019). Article ADS CAS Google Scholar * Burgess, S. D. & Bowring, S. A. High-precision geochronology confirms voluminous magmatism before, during,
and after Earth′s most severe extinction. _Sci. Adv._ 1, e1500470 (2015). Article ADS PubMed PubMed Central Google Scholar * Mills, B. J. W., Scotese, C. R., Walding, N. G., Shields, G.
A. & Lenton, T. M. Elevated CO2 degassing rates prevented the return of Snowball Earth during the Phanerozoic. _Nat. Commun._ 8, 1110 (2017). Article ADS PubMed PubMed Central CAS
Google Scholar * Svensen, H. et al. Siberian gas venting and the end-Permian environmental crisis. _Earth Planet. Sci. Lett._ 277, 490–500 (2009). Article ADS CAS Google Scholar * Cui,
Y. & Kump, L. R. Global warming and the end-Permian extinction event: proxy and modeling perspectives. _Earth-Sci. Rev._ 149, 5–22 (2015). Article ADS CAS Google Scholar * Beauchamp,
B. & Baud, A. Growth and demise of Permian biogenic chert along northwest Pangea: evidence for end-Permian collapse of thermohaline circulation. _Palaeogeogr. Palaeoclimatol.
Palaeoecol._ 184, 37–63 (2002). Article Google Scholar * Selin, N. E. et al. Global 3-D land-ocean-atmosphere model for mercury: present-day versus preindustrial cycles and anthropogenic
enrichment factors for deposition. _Glob. Biogeochem. Cycles_ 22, GB2011 (2008). ADS Google Scholar * Farquhar, G. D., Ehleringer, J. R. & Hubick, K. T. Carbon isotope discrimination
and photosynthesis. _Annu. Rev. Plant Physiol. Plant Mol. Biol._ 40, 503–537 (1989). Article CAS Google Scholar * Kump, L. Climate change and marine mass extinction. _Science_ 362,
1113–1114 (2018). Article ADS CAS PubMed Google Scholar * Meili, M. The coupling of mercury and organic matter in the biogeochemical cycle—towards a mechanistic model for the boreal
forest zone. _Water, Air, Soil Pollut._ 56, 333–347 (1991). Article ADS CAS Google Scholar * Watson, A. J., Lenton, T. M. & Mills, B. J. W. Ocean deoxygenation, the global phosphorus
cycle and the possibility of human-caused large-scale ocean anoxia. _Philos. Trans. R. Soc. A Math. Phys. Eng. Sci._ 375, 20160318 (2017). * Meyer, K. M., Kump, L. R. & Ridgwell, A.
Biogeochemical controls on photic-zone euxinia during the end-Permian mass extinction. _Geology_ 36, 747–750 (2008). Article ADS CAS Google Scholar * Rampino, M. R. & Caldeira, K.
Major perturbation of ocean chemistry and a ‘Strangelove Ocean’ after the end-Permian mass extinction. _Terra Nov._ 17, 554–559 (2005). Article ADS CAS Google Scholar * Payne, J. L.
& Kump, L. R. Evidence for recurrent Early Triassic massive volcanism from quantitative interpretation of carbon isotope fluctuations. _Earth Planet. Sci. Lett._ 256, 264–277 (2007).
Article ADS CAS Google Scholar * Broecker, W. S. & Peng, T. H. Tracers in the sea. https://doi.org/10.1016/0016-7037(83)90075-3 (1983). * Zeebe, R. E. & Wolf-Gladrow, D. Chapter
1 equilibrium. _Elsevier Oceanogr. Ser._ 65, 1–84 (2001). Article Google Scholar Download references ACKNOWLEDGEMENTS J.D.C. thanks Timothy M. Lenton for useful comments from which this
study emerged. J.D.C., R.J.N. and P.W. acknowledge support from NERC grant NE/P013724/1. J.D.C. also acknowledges the One Hundred Talent Program of China University of Geosciences (CUG)
Wuhan, China. B.J.W.M. acknowledges support from NERC grants NE/S009663/1 and NE/R010129/1 and from a University of Leeds Academic Fellowship. D.C., J.T., W.S. and Y.W. acknowledge National
Natural Science Foundation of China grants (grants 41530104, 41661134047). T.A.M. acknowledges funding from ERC consolidator grant (ERC-2018-COG- 818717 -V-ECHO). AUTHOR INFORMATION Author
notes * These authors contributed equally: Jacopo Dal Corso, Benjamin J. W. Mills. AUTHORS AND AFFILIATIONS * School of Earth and Environments, University of Leeds, Leeds, LS2 9JT, UK Jacopo
Dal Corso, Benjamin J. W. Mills, Robert J. Newton & Paul B. Wignall * State Key Laboratory of Biogeology and Environmental Geology, China University of Geosciences, Wuhan, 430074, China
Jacopo Dal Corso, Daoliang Chu, Wenchao Shu, Yuyang Wu & Jinnan Tong * Department of Earth Sciences, University of Oxford, South Parks Road, Oxford, OX1 3AN, UK Tamsin A. Mather Authors
* Jacopo Dal Corso View author publications You can also search for this author inPubMed Google Scholar * Benjamin J. W. Mills View author publications You can also search for this author
inPubMed Google Scholar * Daoliang Chu View author publications You can also search for this author inPubMed Google Scholar * Robert J. Newton View author publications You can also search
for this author inPubMed Google Scholar * Tamsin A. Mather View author publications You can also search for this author inPubMed Google Scholar * Wenchao Shu View author publications You can
also search for this author inPubMed Google Scholar * Yuyang Wu View author publications You can also search for this author inPubMed Google Scholar * Jinnan Tong View author publications
You can also search for this author inPubMed Google Scholar * Paul B. Wignall View author publications You can also search for this author inPubMed Google Scholar CONTRIBUTIONS J.D.C.
conceived the study. B.J.W.M. built the box model. J.D.C. and B.J.W.M. designed the model scenarios with in-depth inputs from T.A.M., P.B.W., D.C. and R.J.N. J.D.C., D.C., W.S., Y.W. and
P.B.W. compiled and discussed the geochemical and chronostratigraphic data. All authors discussed the results and contributed to the writing of the paper. P.B.W., R.J.N. and J.T. provided
the funding. CORRESPONDING AUTHORS Correspondence to Jacopo Dal Corso or Benjamin J. W. Mills. ETHICS DECLARATIONS COMPETING INTERESTS The authors declare no competing interests ADDITIONAL
INFORMATION PEER REVIEW INFORMATION _Nature Communications_ thanks the anonymous reviewer(s) for their contribution to the peer review of this work. Peer reviewer reports are available.
PUBLISHER’S NOTE Springer Nature remains neutral with regard to jurisdictional claims in published maps and institutional affiliations. SUPPLEMENTARY INFORMATION SUPPLEMENTARY INFORMATION
PEER REVIEW FILE RIGHTS AND PERMISSIONS OPEN ACCESS This article is licensed under a Creative Commons Attribution 4.0 International License, which permits use, sharing, adaptation,
distribution and reproduction in any medium or format, as long as you give appropriate credit to the original author(s) and the source, provide a link to the Creative Commons license, and
indicate if changes were made. The images or other third party material in this article are included in the article’s Creative Commons license, unless indicated otherwise in a credit line to
the material. If material is not included in the article’s Creative Commons license and your intended use is not permitted by statutory regulation or exceeds the permitted use, you will
need to obtain permission directly from the copyright holder. To view a copy of this license, visit http://creativecommons.org/licenses/by/4.0/. Reprints and permissions ABOUT THIS ARTICLE
CITE THIS ARTICLE Dal Corso, J., Mills, B.J.W., Chu, D. _et al._ Permo–Triassic boundary carbon and mercury cycling linked to terrestrial ecosystem collapse. _Nat Commun_ 11, 2962 (2020).
https://doi.org/10.1038/s41467-020-16725-4 Download citation * Received: 23 December 2019 * Accepted: 18 May 2020 * Published: 11 June 2020 * DOI: https://doi.org/10.1038/s41467-020-16725-4
SHARE THIS ARTICLE Anyone you share the following link with will be able to read this content: Get shareable link Sorry, a shareable link is not currently available for this article. Copy to
clipboard Provided by the Springer Nature SharedIt content-sharing initiative