Expanding drug targets for 112 chronic diseases using a machine learning-assisted genetic priority score
- Select a language for the TTS:
- UK English Female
- UK English Male
- US English Female
- US English Male
- Australian Female
- Australian Male
- Language selected: (auto detect) - EN
Play all audios:

ABSTRACT Identifying genetic drivers of chronic diseases is necessary for drug discovery. Here, we develop a machine learning-assisted genetic priority score, which we call ML-GPS, that
incorporates genetic associations with predicted disease phenotypes to enhance target discovery. First, we construct gradient boosting models to predict 112 chronic disease phecodes in the
UK Biobank and analyze associations of predicted and observed phenotypes with common, rare, and ultra-rare variants to model the allelic series. We integrate these associations with existing
evidence using gradient boosting with continuous feature encoding to construct ML-GPS, training it to predict drug indications in Open Targets and externally testing it in SIDER. We then
generate ML-GPS predictions for 2,362,636 gene-phecode pairs. We find that the use of predicted phenotypes, which identify substantially more genetic associations than observed phenotypes
across the allele frequency spectrum, significantly improves the performance of ML-GPS. ML-GPS increases coverage of drug targets, with the top 1% of all scores providing support for 15,077
gene-phecode pairs that previously had no support. ML-GPS can also identify well-known target-disease relationships, promising targets without indicated drugs, and targets for several drugs
in clinical trials, including LRRK2 inhibitors for Parkinson’s disease and olpasiran for cardiovascular disease. SIMILAR CONTENT BEING VIEWED BY OTHERS DRUGNOMEAI IS AN ENSEMBLE
MACHINE-LEARNING FRAMEWORK FOR PREDICTING DRUGGABILITY OF CANDIDATE DRUG TARGETS Article Open access 24 November 2022 DISEASE PREDICTION WITH MULTI-OMICS AND BIOMARKERS EMPOWERS CASE–CONTROL
GENETIC DISCOVERIES IN THE UK BIOBANK Article Open access 11 September 2024 DEVELOPMENT OF A HUMAN GENETICS-GUIDED PRIORITY SCORE FOR 19,365 GENES AND 399 DRUG INDICATIONS Article 03
January 2024 INTRODUCTION While chronic non-communicable diseases are major causes of global morbidity and mortality1, many lack effective treatments, in part due to limitations of
preclinical models and high clinical trial failure rates of drugs without target evidence2. Since the first genome-wide association study in 20053, thousands of genetic association studies
using large-scale biobank data have uncovered disease-associated variants and, in conjunction with clinical genetics from databases like ClinVar and OMIM, have provided valuable insight for
drug discovery and precision medicine2,4. Indeed, 63% of new drugs approved by the FDA between 2013-2022 were supported by genetic evidence5, and genetics-supported drug mechanisms are 2.6
times more likely to succeed compared to those without support6. Our recent Genetic Priority Score (GPS) framework further demonstrated the efficacy of combining clinical variants with
genetic associations, including rare coding variants and common variants, to prioritize drug targets7. We showed that the top 0.28% of the GPS conferred a 9.9-fold increased effect of having
a drug indication and an 8.8-fold increased likelihood of advancing from phase I to phase IV. However, prevalent genetic association studies are limited by their reliance on binary
case/control labels, which not only are subject to underdiagnosis and misdiagnosis but also fail to stratify individuals by disease risk and severity, contributing to reduced statistical
power. Addressing this, recent studies have used machine learning to generate continuous representations of cardiovascular, pulmonary, and psychiatric diseases8,9,10,11,12,13,14, which
subsequently identified additional disease-associated variants. Increasing the identification of these variants, particularly those representing distinct disease mechanisms, may facilitate
the development of more effective drugs. In this work, we introduce a machine learning-assisted version of the GPS (ML-GPS) applied to 112 chronic disease phecodes. Our approach employs
machine learning in two key stages: initially to improve phenotyping via continuous disease representations and subsequently to predict drug indications using genetic associations with these
continuous phenotypes. In the second stage, we use machine learning to combine 13 complementary sources of genetic evidence to assign each gene-phecode pair a probability of having an
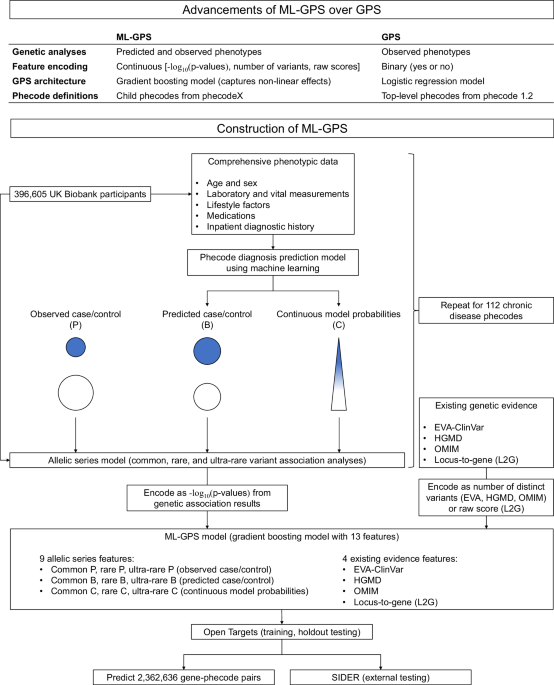
indicated drug, allowing researchers to select high-scoring genes for further screening. ML-GPS incorporates four major advances aimed at improving the accuracy and coverage of the original
GPS7. First, we developed gradient boosting models that use comprehensive phenotypic data from the UK Biobank to predict the presence of phecode diagnoses; used them to re-phenotype all
participants, assigning them probabilities ranging from zero to one to represent continuous disease representations for each phecode; identified common, rare, and ultra-rare variant
associations to model the allelic series; and incorporated them into ML-GPS. An allelic series, which we defined as a series of variants in a gene that independently exhibit graded impact on
disease, provides evidence for dose-response relationships between target functionality and phenotype2,15. Second, whereas the original GPS used binary encoding of features, ML-GPS uses a
continuous encoding that reflects either the magnitude of statistical significance of each target-disease genetic association or the number of clinical variants. Third, we constructed ML-GPS
using gradient boosting instead of logistic regression, allowing it to capture nonlinear relationships between features and drug indications. Fourth, ML-GPS uses child codes from phecodeX
compared to parent codes from phecode v1.2 for the original GPS16, improving phenotyping and increasing disease granularity. To optimize ML-GPS, we compare the performance of models
constructed using different sets of architectures and feature inputs. We demonstrate that the inclusion of machine learning-discovered genetic associations and the use of continuous encoding
not only increase the accuracy of ML-GPS predictions but also expand its coverage of drug targets. We use ML-GPS to generate predictions for 26,035 distinct genes and 112 phecodes for a
total of 2,362,636 gene-phecode pairs and corroborate drug targets prioritized by ML-GPS using both known target-disease associations and manual screening. Finally, we highlight drug targets
and disease pathways that are supported by ML-GPS and not by existing methods. RESULTS CONSTRUCTION OF MACHINE LEARNING MODELS TO PREDICT PHECODE DIAGNOSES We screened 3612 phecodes
included in phecodeX to identify 336 phecodes corresponding to non-communicable chronic disease processes across 11 phecode categories (Supplementary Data 1). To identify phecodes associated
with chronic physiologic changes, we used LightGBM to construct preliminary gradient boosting models using only age, sex, and 72 laboratory and vital measurements. Models for 112 of 336
phecodes achieved mean areas under the receiver operating characteristic curve (AUROCs) ≥ 0.70 and areas under the precision-recall curve (AUPRCs) ≥ the prevalence of the phecode
(Supplementary Fig. 1a; Supplementary Data 2). Model performance was unequally distributed across different phecode categories; models in the endocrine/metabolic, blood/immune, and
cardiovascular categories had the highest mean AUROCs, whereas models in the musculoskeletal, dermatological, and sense organ categories had the lowest mean AUROCs. For the 112 phecodes with
model performance above our thresholds, we constructed final models that incorporated 165 additional features, including lifestyle factors, medication usage, and diagnostic history (Fig.
1). LightGBM models were robust to feature selection (Supplementary Data 3), and either outperformed or were comparable to XGBoost and random forest models (Supplementary Data 4). Final
models had high discrimination, with a median AUROC of 0.85 [interquartile range (IQR) 0.08] (Fig. 2a), and high calibration, with a median Brier score of 0.01 [IQR 0.02] (Supplementary Data
2). Compared to preliminary models, these models had median increases in AUROCs and AUPRCs of 0.08 [IQR 0.06] and 0.06 [IQR 0.08], respectively. Further, for 13 phecodes partially definable
using a single laboratory or vital biomarker (e.g., hypertension:systolic blood pressure, type 2 diabetes:hemoglobin A1c, and obesity:body mass index), both preliminary and final models
outperformed the biomarker in both AUROC and AUPRC for phecode diagnosis (Supplementary Fig. 1b; Supplementary Data 5). Finally, across all phecodes, each quintile increase in predicted
phecode probability corresponded to a median odds ratio (OR) of 3.24 for observed phecode presence, whereas participants in the highest quintile had a median OR of 45.97 for observed phecode
presence compared to those in the lowest quintile (Supplementary Data 6). There was diverse feature usage across models: for 70 of the 112 phecodes, three or more feature categories (i.e.,
demographics, measurements, lifestyle factors, medication usage, and diagnostic history) were represented among the top 10 model features (Supplementary Data 7). Important model features
were generally consistent with known characteristics of each phecode, such as erythrocyte distribution width and hemoglobin for iron deficiency anemia (BI_160.1) and urate and antigout
preparation (M04A) usage for gout (MS_703.1). For eight phecodes, the top 10 model features were all based on diagnostic history; this is consistent with our prior report demonstrating that
the presence of some diagnoses can inform the presence of other diagnoses17. Many chronic diseases increase mortality risk1, and 93 of the 112 phecodes were significantly associated with
all-cause mortality in the UK Biobank (Supplementary Data 8). The maximum hazard ratio across phecodes was 7.98 (95% CI 7.37–8.64) for CV_420 (cardiac arrest). We also observed that
increased quintile of predicted probability was positively associated with all-cause mortality for 110 of the 112 phecodes [all but CM_751.4 (congenital glaucoma) and MS_722.4 (palmar
fascial fibromatosis)]. This association was present separately among cases and controls for 68 and 110 of the 112 phecodes, respectively, suggesting that predicted probabilities are
associated with increased disease severity and identify probable disease underdiagnosis. Together, these results demonstrate that predicted probabilities are associated with disease risk,
severity, progression and underdiagnosis. ANALYSIS OF GENETIC ASSOCIATIONS We modeled the allelic series of each gene-phecode pair (Fig. 1). We performed genome-wide association testing of
common variants [minor allele frequency (MAF) ≥ 0.01], exome-wide association testing of single rare coding variants (0.0001 ≤ MAF < 0.01) that were missense or loss-of-function (LOF),
and gene-level testing of ultra-rare coding variants (MAF < 0.0001) that were deleterious missense or LOF for three different phenotypes: observed phecode case/control status (P),
binarized model probabilities (B), and continuous model probabilities (C). For rare variant analyses, median inflation factors (_λ_) were 1.04 (P), 1.04 (B), and 1.03 (C). For common variant
analyses, median _λ_s were 1.03 (P), 1.06 (B), and 1.34 (C), whereas for ultra-rare variant analyses, median _λ_s were 0.76 (P), 0.89 (B), and 1.03 (C). The increased λ for C in common
variant analyses may be attributable to increased identification of causal variants under polygenic inheritance18, whereas the decreased _λ_s for P and B in ultra-rare variant analyses may
be attributable to our inclusion of only deleterious missense and LOF variants. Across all phecodes, C identified substantially more genes with significant variants/tests than B, which
identified more genes than P (Fig. 2b). Specifically, P, B, and C identified at least one gene for 64, 75, and 111 phecodes for common variant analyses; 40, 46, and 108 phecodes for rare
variant analyses; and 53, 61, and 109 phecodes for ultra-rare variant analyses, respectively (Supplementary Data 9). For common variant analyses, B and C identified a median of 30% [IQR 70%]
and 34% [IQR 77%] of genes identified by P, respectively, demonstrating the overlap between predicted and observed phenotypes. The percentage of genes identified by P that were also
identified by C was significantly associated with the AUROC of the model (β = 3.79, 95% CI 1.72–5.87, _p_ = 5.4 × 10⁻⁴) (Supplemental Table 1), suggesting that models with higher
discrimination better represent the observed phenotype. Additionally, for common, rare, and ultra-rare variant analyses, C identified only 71% [IQR 50%], 50% [IQR 100%], and 80% [IQR 50%] of
genes identified by B, respectively, despite B being a binarization of probabilities used for C. Finally, for each of P, B, and C, median absolute effect sizes per gene were higher for rare
and ultra-rare compared to common variant analyses, including in pairwise comparisons of the same genes (Supplemental Table 2). ASSOCIATION OF GENETIC FEATURES WITH DRUG INDICATIONS Genetic
analyses with predicted phenotypes increased the identification of drug indications at the phecode level, with B and C identifying one, two, or more than two genes with drug indications for
a greater number of phecodes compared to P (Supplementary Fig. 2a,b). For common variant analyses, C identified a greater number of genes with drug indications than P for 25 phecodes, and
for 16 of these phecodes, P did not identify any such genes. This was also true of 9 and 8 phecodes for rare variant analyses and 10 and 9 phecodes for common variant analyses, respectively.
Consistent with our prior report7, gene-phecode pairs with existing evidence from EVA-ClinVar, HGMD, OMIM, and L2G were significantly associated with drug indication, with ORs in Open
Targets of 6.61 (95% CI 4.50–9.70), 4.87 (95% CI 4.13–5.76), 13.20 (95% CI 7.58–22.99), and 6.68 (95% CI 5.20–8.58), respectively (Fig. 2d; Supplemental Table 3). For common variant
analyses, P, B and C had ORs of 7.56 (95% CI 5.08–11.26), 6.28 (95% CI 4.55–8.68), and 3.19 (95% CI 2.53–4.03), respectively (Fig. 2d; Supplemental Table 3). There were no significant
differences in ORs between P, B, and C for rare or ultra-rare variant analyses. For rare variant analyses, P, B, and C corresponded to ORs of 16.46 (95% CI 5.95–45.59), 15.62 (95% CI
7.16–34.06), and 8.75 (95% CI 5.17–14.80), respectively, whereas for ultra-rare variant analyses, P, B, and C corresponded to ORs of 6.87 (95% CI 1.95–24.21), 8.66 (95% CI 4.03–18.59), and
4.02 (95% CI 2.35–6.88), respectively. Further, even after subtracting genes identified by P from B and C (i.e., B-P and C-P), we found that these two features were still significantly
associated with drug indication, with ORs of 5.21 (95% CI 3.44–7.90) and 2.62 (95% CI 2.01–3.41) for common, 15.25 (95% CI 5.71–40.90) and 7.49 (95% CI 4.18–13.40) for rare, and 10.86 (95%
CI 4.49–26.26) and 3.96 (95% CI 2.24–6.99) for ultra-rare variants, respectively (Fig. 2e). Thus, B and C increase the coverage of genes with drug indications. CONSTRUCTION OF ML-GPS We
constructed machine learning models to predict whether each distinct gene-phecode pair had an indicated drug. Of 112,274 pairs in Open Targets and 58,674 pairs in SIDER, 4116 and 1883 had
indicated drugs, respectively. We included up to 13 features, including three features representing clinical evidence (EVA-ClinVar, HGMD, OMIM), one representing L2G, and nine features
incorporating additional evidence from P, B and C common, rare, and ultra-rare variant analyses. We first tested five different model architectures for all 13 features: ElasticNet logistic
regression (LR), gradient boosting (GB), GB with continuous feature encoding [GB (CE)], GB (CE) with sample weights based on the number of indicated drugs [GB (CE, number weights)], and GB
(CE) with sample weights based on the maximum phase of indicated drugs [GB (CE, phase weights)]. In both Open Targets and SIDER, the GB model significantly outperformed the LR model in AUPRC
based on permutation testing (Fig. 3a; Supplemental Table 4), and all three GB models with CE outperformed the GB model without CE. Although there was no significant difference in AUPRC
between the three GB models with CE, scores from the GB (CE, phase weights) model resulted in significantly higher ORs for main indication among all drugs and separately among phase IV drugs
compared to scores from all other models (Fig. 3b–d). As a sensitivity analysis, we also compared the LightGBM-based GB (CE phase weights) model with XGBoost and random forest models;
LightGBM outperformed the latter two models in AUPRC in both Open Targets and SIDER (Supplementary Fig. 3; Supplemental Table 4). For the GB (CE, phase weights) model architecture, we next
compared the relative contributions of different features by constructing models with L2G, clinical evidence (Clinical), L2G + Clinical, L2G + Clinical + P, or L2G + Clinical + PBC. With
each additional set of features, there were significant increases in AUPRC in both Open Targets and SIDER based on permutation testing (Fig. 4a; Supplemental Table 4), with 47.5% and 70.7%
increases between the L2G and L2G + Clinical + PBC models in these two datasets, respectively. In Open Targets, each standard deviation in score from the model incorporating evidence from C
and B (L2G + Clinical + PBC) corresponded to ORs of 1.26 (95% CI 1.24–1.28) for any drug indication and 1.41 (95% CI 1.37–1.44) for phase IV drug indications (Fig. 4b); these ORs were
significantly higher than for scores from all other models and represented 11.6% and 16.9% increases from ORs for the L2G model. Additionally, gene-phecode pairs in the 99–100 compared to
0–50 percentiles for this model had ORs of 6.49 (95% CI 5.60–7.53) and 7.38 (95% CI 6.02–9.03) for drug indication in Open Targets and SIDER, respectively (Fig. 4c,d). We performed a Shapley
Additive exPlanations (SHAP) analysis of L2G + Clinical + PBC model predictions in Open Targets to further assess the contributions of each feature to model predictions. The most important
features were B (rare variant), C (rare variant), and B (ultra-rare variant); conversely, the OMIM feature had no contribution to final predictions, likely because of redundancy with the
HGMD and EVA-ClinVar features (Supplementary Fig. 4). We also analyzed relationships between feature values and SHAP values. For both EVA-ClinVar and HGMD, genes with one clinical variant
had higher SHAP values compared to those with none, but additional clinical variants beyond the first did not further increase SHAP values (Supplementary Fig. 5). For L2G, higher scores
resulted in higher SHAP values, but in a discrete rather than continuous manner. For P, B, and C features, genes with -log10(_p_-values) above standard significance thresholds generally had
positive SHAP values; however, some genes with -log10(_p_-values) below these thresholds also had positive SHAP values, demonstrating the utility of continuous encoding of these features.
Based on these results, we use scores from the L2G + Clinical + PBC model under the GB (CE, phase weights) model architecture as ML-GPS. Although optimal thresholds for ML-GPS will depend on
the user’s goal (e.g., maximizing target coverage for high-throughput screening versus prioritizing a few high-scoring targets for manual screening), we provide precision and recall metrics
for different thresholds in Open Targets and SIDER (Supplementary Fig. 6a,b). Precision reflects the proportion of identified gene-phecode pairs with drug indications, whereas recall
reflects the proportion of pairs with drug indications that are identified. For example, a ML-GPS threshold of 0.212 (equivalent to 99th percentile on the full dataset of 2,362,626 pairs)
balances precision and recall, yielding precision = 0.116 and recall = 0.076 in Open Targets, and precision = 0.137 and recall = 0.094 in SIDER. To prioritize precision, a higher ML-GPS
threshold of 0.540 yields precision = 0.400 and recall = 0.014 in Open Targets, and precision = 0.424 and recall = 0.015 in SIDER. Finally, although we could not directly compare ML-GPS with
the original GPS due to different phecode definitions7, we compared ML-GPS with a logistic regression model including L2G + Clinical + P features, which approximates GPS. First, there were
increases in AUPRC from 0.049 (95% CI 0.045–0.054) to 0.063 (95% CI 0.058–0.069) in Open Targets and from 0.050 (95% CI 0.043–0.056) to 0.066 (95% CI 0.057–0.074) in SIDER (Supplementary
Fig. 7a); these represent increases of 28.6% and 32.0%, respectively. Second, ORs per standard deviation increase in score increased from 1.18 (95% CI 1.16–1.20) to 1.26 (95% CI 1.24–1.28)
for all drug indications and from 1.27 (95% CI 1.24–1.30) to 1.41 (95% CI 1.37–1.44) for phase IV drug indications (Supplementary Fig. 7b). Third, for the 75-85, 85-95, and 95-98 percentiles
of scores in both Open Targets and SIDER, only scores from ML-GPS had ORs greater than one for drug indication (Supplementary Fig. 7c,d), demonstrating the increased coverage of ML-GPS.
CONSTRUCTION OF ML-GPS WITH DIRECTION OF EFFECT (ML-GPS DOE) We extended ML-GPS to predict direction of effect (DOE) in addition to drug indication. ML-GPS DOE is a one-versus-rest
classifier that assigns each gene-phecode pair three different probabilities summing to one: probability of no drug indication, probability of an activator drug indication, and probability
of an inhibitor drug indication. This differs from our prior implementation of GPS DOE7, which outputs a single positive or negative score based on whether the genetic features are primarily
loss- or gain-of-function. In both datasets, there were more inhibitor compared to activator drug indications, with 3019 and 890 in Open Targets and 1288 and 364 in SIDER, respectively.
Despite weighting activator drug indications twice as heavily as inhibitor drug indications during training, we still observed higher AUPRCs and ORs for predicting inhibitor compared to
activator drug indications. Nevertheless, we similarly observed that the L2G + Clinical + PBC model significantly outperformed all other models for predicting both activator and inhibitor
drug indications (Supplemental Table 4). When predicting activator drug indications, the L2G + Clinical + PBC model achieved AUPRCs of 0.018 (95% CI 0.014–0.021) in Open Targets and 0.022
(95% CI 0.014–0.032) in SIDER, respectively (Fig. 5a). In Open Targets, each standard deviation increase in score was associated with an OR of 1.17 (95% CI 1.15–1.20) for any activator drug
indication (Fig. 5b), and gene-phecode pairs in the 99-100 compared to 0–50 percentiles had ORs of 6.93 (95% CI 5.28–9.09) in Open Targets and 7.26 (95% CI 4.86–10.86) in SIDER, respectively
(Fig. 5c,d). When predicting inhibitor drug indications, the L2G + Clinical + PBC model achieved AUPRCs of 0.052 (95% CI 0.047–0.058) in Open Targets and 0.056 (95% CI 0.046–0.065) in
SIDER, respectively (Fig. 6a). In Open Targets, each standard deviation increase in score was associated with an OR of 1.24 (95% CI 1.22–1.26) for any inhibitor drug indication (Fig. 6b),
and gene-phecode pairs in the 99-100 compared to 0–50 percentiles had ORs of 6.21 (95% CI 5.24–7.37) in Open Targets and 7.87 (95% CI 6.22–9.94) for inhibitor drug indications in SIDER,
respectively (Fig. 6c,d). Given these results, we similarly use scores from the L2G + Clinical + PBC model as ML-GPS DOE. As with ML-GPS, we provide precision and recall for different
thresholds in Open Targets and SIDER for ML-GPS DOE (Supplementary Fig. 8a–d). For example, for activator drug indications, a probability threshold of 0.084 yields precision = 0.060 and
recall = 0.044 in Open Targets, and precision = 0.058 and recall = 0.049 in SIDER. For inhibitor drug indications, a probability threshold of 0.204 yields precision = 0.250 and recall =
0.022 in Open Targets, and precision = 0.280 and recall = 0.035 in SIDER. ANALYSIS OF TARGETS AND PATHWAYS PRIORITIZED BY ML-GPS We generated ML-GPS and ML-GPS DOE predictions for all
2,362,636 gene-phecode pairs for which at least one of the 13 features was non-zero. These pairs represented 26,035 distinct genes, of which 18,247 were protein-coding. We directly compared
scores from ML-GPS with those from the L2G + Clinical + P model for 127,258 of these pairs where the gene was targeted by any drug in Open Targets or SIDER: among the 5008 pairs with an
indicated drug, ML-GPS had higher scores for 55.91% of pairs (Fig. 7a), whereas among the 122,250 pairs without an indicated drug, ML-GPS had lower scores for 58.37% of pairs (Fig. 7b).
Similarly, ML-GPS scores ≥ 99th percentile (score > 0.212) had a greater proportion and number of drug indications compared to L2G + Clinical + P scores ≥ 99th percentile (Fig. 7c). These
results demonstrate improved identification of drug indications when including C and B as features. As evidence of the increased coverage of drug targets offered by ML-GPS, our
approximation of the original GPS had non-zero scores for only 9576 of the 2,362,636 gene-phecode pairs [0.4%] (Fig. 7d), representing 5353 distinct genes, 107 phecodes, and 303 drug
indications. In contrast, the 23,626 pairs with ML-GPS scores ≥ 99th percentile (score > 0.212) represented 9916 distinct genes, all 112 phecodes, and 696 drug indications; 409 of these
indications had no support from the original GPS. The top 23,626 ML-GPS gene-phecode pairs were unequally distributed across phecodes, with EM_239.2 (hyperglyceridemia) having the most pairs
(_n_ = 1708) and CV_438.2 (aneurysm of iliac or artery of lower extremity) having the least (_n_ = 26). ML-GPS DOE predicted 2779 of the pairs as more likely to have activator drug
indications and 20,847 as more likely to have inhibitor drug indications. Although ML-GPS does not include tractability information as features, many of the prioritized targets appear
amenable to drug development: of 9916 distinct genes represented among the top 23,626 pairs, 2589 [26.1%] have either membrane or secreted products, 5014 [50.6%] have favorable tissue
specificity, 1458 [14.7%] bind ligands, 1851 [18.7%] bind small molecules, and 618 [6.2%] have predicted pockets (Supplementary Table 5). For 120,728 of all 2,362,636 gene-phecode pairs,
there was a large (>30%) increase in score for ML-GPS compared to the L2G + Clinical + P model; these pairs represent targets prioritized only with evidence from the C and B machine
learning analyses. We used direct and indirect target-disease associations from Open Targets to examine the evidence supporting these pairs beyond drug indications; these associations
include evidence from the published literature and databases not used to construct ML-GPS. A greater proportion of pairs with <10% increase in score had both direct and indirect
associations compared to pairs with > 10% increase in score, likely because these pairs have corroborating support from clinical variants, L2G, or P (Fig. 7e,f). However, in the 0.2–0.4,
0.4–0.6, and ≥ 0.6 score bins, 36.6%, 70.6%, and 100% of pairs with 10-20% increase in score and 28.6%, 74.2%, and 100% of pairs with 20-30% increase in score had direct associations,
respectively. Further, we manually examined the 50 highest-scoring pairs without drug indications or target-disease associations and found that 33 of these pairs [66%] had supporting
genetic, clinical, and/or mechanistic evidence (Supplementary Data 10). These pairs included _GBA_ for NS_324.1 (parkinsonism), _USP40_ for EM_252.3 (disorders of bilirubin excretion),
_NAA25_ for EM_200.6 (atrophy of thyroid), _MMAA_ for EM_256.3 (mixed disorder of acid-base balance), and _PVR_ for EM_239.1 (hypercholesterolemia). Many of these large score increase pairs
represent well-known target-disease relationships, including _PCSK9_ for EM_239.2 (hyperglyceridemia; score increase from 0.46 to 0.79), _ACE_ for GU_582.2 (chronic kidney disease; score
increase from 0.39 to 0.79), _GUCY1A1_ for CV_401.2 (hypertensive heart disease; score increase from 0.22 to 0.76), _NPC1L1_ for EM_239.2 (hyperglyceridemia; score increase from 0.11 to
0.65), and _ADRB1_ for GU_582.2 (chronic kidney disease; score increase from 0.19 to 0.60) (Supplementary Data 11). These are targeted by PCSK9 inhibitors, ACE inhibitors, vericiguat,
ezetimibe, and beta blockers, respectively, and ML-GPS DOE correctly predicted the effect direction of all these drugs. However, ML-GPS also identifies viable targets without drug
indications, such as _LDLR_ for EM_239.2 (hyperglyceridemia; score increase from 0.17 to 0.73), which ML-GPS DOE predicts as having an activator drug indication. _LDLR_ LOF mutations are
associated with elevated plasma triglyceride levels19,20, and _LDLR_ activators are under preclinical investigation for atherosclerosis prevention21. Another is _WNT16_ for MS_745.9
(pathological fracture; score increase from 0.32 to 0.44), which ML-GPS DOE also predicts as having an activator drug indication; several preclinical studies suggest _WNT16_ activation may
be useful for treating osteoporosis22,23. ML-GPS results could also aid drug development for conditions opposite to the disease phenotype. For example, it identifies _TMPRSS6_ for BI_160.1
(Iron deficiency anemia; score increase from 0.34 to 0.62): _TMPRSS6_ mutations cause iron deficiency anemia via elevated hepcidin24, and inhibitors of _TMPRSS6_ are under investigation for
hemochromatosis (iron overload)25. Finally, in cases where ML-GPS targets cannot be directly modulated, indirect modulation or substrate delivery may still be possible: for example, ML-GPS
identifies _NOS3_ (endothelial nitric oxide synthase) for CV_401.2 (hypertensive heart disease; score increase from 0.22 to 0.67), and organic nitrates are commonly used in hypertension and
heart disease. Examining the highest scoring ML-GPS gene-phecode pairs overall, we identified additional gene-phecode pairs without drug indications but which had supporting preclinical
evidence (Supplementary Data 12). One example is _ALOX15_ for RE_471.5 (Nasal polyps; score 0.82); _ALOX15_ is mechanistically linked with airway inflammation26, and _ALOX15_ inhibitors that
reduce nitric oxide production and lipid peroxidation have recently been synthesized27. Another is _BMPR2_ for CV_406.1 (pulmonary hypertension; score 0.74); although sotatercept, which
targets the BMPR-II pathway downstream of _BMPR2_, demonstrated success in a 2023 phase III trial for pulmonary arterial hypertension28,29, there are no drugs that target _BMPR2_ directly.
ML-GPS also provides supporting evidence for targets currently in phase II/III clinical trials, many of which are first-in-class. One example is _LRRK2_ for NS_324.1 (parkinsonism; score
0.85); phase I trials of BIIB122 for Parkinson’s disease were recently completed, and a phase III trial is ongoing30,31. Another is _LPA_ for both CV_404.1 (myocardial infarction; score
0.81) and CV_404.2 (coronary atherosclerosis; score 0.58); a phase II trial of olpasiran for cardiovascular disease recently demonstrated efficacy in reducing lipoprotein(a) and a phase III
trial is ongoing32. A third example that highlights drug repurposing is _CFB_ for SO_374.5 (macular degeneration; score 0.73); a phase II trial of iptacopan, originally indicated for
paroxysmal nocturnal hemoglobinuria, is ongoing for age-related macular degeneration33. A fourth example is _MYH7_ for CV_414.2 (dilated cardiomyopathy; score 0.69); a phase II trial of
danicamtiv is ongoing for primary dilated cardiomyopathy following demonstration of efficacy in rodent models34,35. Finally, we examined the enrichment of the 50 MSigDB hallmark gene sets
with increasing ML-GPS scores across the 112 phecodes using single-sample gene set enrichment analysis. For 50 × 112 = 5600 gene set-phecode combinations, there were higher normalized
enrichment scores (NES) with ML-GPS compared to L2G + Clinical + P model scores for 3441 combinations [61.4%], and 899 combinations were enriched only with ML-GPS scores. The gene sets with
the highest NES for ML-GPS scores were consistent with known disease mechanisms, including PANCREAS_BETA_CELLS for type 2 diabetes (top gene _GCK_), NOTCH_SIGNALING for coronary
atherosclerosis (top gene _TCF7L2_)36,37, REACTIVE_OXYGEN_SPECIES_PATHWAY for nasal polyps (top gene _GPX4_)38,39, and MYOGENESIS for hypertrophic cardiomyopathy (top gene _TNNT2_) (Fig. 7g;
Supplementary Data 13). However, ML-GPS identified disease-relevant pathways with high NES that the L2G + Clinical + P model did not; these included UNFOLDED_PROTEIN_RESPONSE for congenital
heart disease (top gene _CCL2_)40, ANGIOGENESIS for coronary atherosclerosis (top gene _LPL_)41, REACTIVE_OXYGEN_SPECIES_PATHWAY for essential hypertension (top gene _FES_)42, and
HEME_METABOLISM for disorders of iron metabolism (top gene _SLC4A1_) (Supplementary Data 14). These results further support the biological relevance and potential clinical utility of ML-GPS.
DISCUSSION In this study, we introduced ML-GPS, a machine learning-assisted version of the Genetic Priority Score framework that enhances the identification of drug targets for 112 chronic
diseases via four major advances. First, ML-GPS incorporates genetic associations with machine learning-predicted disease phenotypes, which mitigate chronic disease underdiagnosis and
stratify participants by disease probability and severity. These genetic associations identify drug targets that are missed when performing standard case-control studies. Second, we include
all genetic associations, regardless of significance, as features in ML-GPS and encode them in a continuous manner using -log10(_p_-values); this permits the model to determine optimal
significance thresholds for each feature rather than relying on pre-determined thresholds. Similarly, we represented clinical evidence using the number of distinct variants for each gene and
L2G using raw scores. Third, we constructed ML-GPS using gradient boosting, which captured non-linear relationships between features and drug indications, as evidenced by our SHAP analysis,
and enabled continuous encoding of features. Fourth, we used a newer version of phecode terminology (phecodeX versus phecode v1.2) with more robust and granular phenotype representation. We
demonstrate that these advances significantly improve the ability of ML-GPS to identify disease-associated genes that are targeted by existing drugs, that ML-GPS prioritizes thousands of
additional drug targets that are supported by external evidence and represent distinct pathways, and that ML-GPS provides support for several first-in-class drugs that are currently in
clinical trials. Our study also assesses the ability of machine learning models to predict disease presence and compares genetic associations of predicted versus observed phenotypes across a
large, diverse set of diseases. Although models primarily using laboratory and vital measurements achieved good classification performance (AUROC > 0.70) for many phecodes, there was
consistently a significant performance gain when incorporating additional features such as diagnostic history and medication usage. Consistent with this, whereas 13 phecodes in our analyses
were definable using single biomarkers, our models outperformed the biomarkers in AUROC for all these phecodes. These results may reflect the unreliability of objective measurements from a
single timepoint; for example, an elevated blood pressure from a single measurement is insufficient for diagnosing hypertension43. Additionally, many chronic diseases are characterized by
cycles of remission and relapse, such that a participant with normal measurements may still have disease. We also observed that at standard significance thresholds, predicted phenotypes
significantly increased the identification of common, rare, and ultra-rare variants; however, associations with predicted phenotypes failed to capture many variants associated with observed
phenotypes. Thus, predicted phenotypes are complementary to rather than a replacement for observed phenotypes, and we included associations with both in ML-GPS. This study has several
limitations. First, we performed genetic analyses only in the UK Biobank due to the completeness of its phenotypic data, and of the UK Biobank participants, we analyzed only those of
European ancestry to reduce computational complexity. While the resulting reduction of identified disease-associated variants is partially mitigated by the inclusion of clinical variants and
L2G in ML-GPS, which include genetic evidence from outside the UK Biobank and from more diverse participants, there remains a need for biobanks with complete phenotypic data encompassing
diverse ancestries. Second, this study does not comprehensively cover all chronic diseases. Our phecode selection process included a semi-subjective manual screening where valid phecodes may
have been erroneously removed. Further, we excluded many chronic disease phecodes, especially those in the musculoskeletal and sense organ categories, because they could not be accurately
predicted using available phenotypic data. The latter issue also emphasizes the importance of complete phenotypic data, with the majority of UK Biobank lacking imaging, audiometric, and
ophthalmic data. Third, because we use similar datasets and methods as our earlier implementation of GPS, many of the limitations still apply, including discrepancies in drug data
ascertainment between the Open Targets and SIDER datasets, potential misclassifications due to the use of ICD-10 and phecode terminology, the non-equivalence of the absence of a genetic
feature to evidence against a drug target, reliance on LoGoFunc inference for LOF and GOF predictions, and the greater prevalence of inhibitor compared to activator drug indication
predictions. However, we addressed the discrepancy between Open Targets and SIDER by placing larger sample weights on targets indicated by drugs in advanced phases, observing similar metrics
for the two datasets as a result. We also weighed activator more than inhibitor drug indications during ML-GPS DOE training to avoid biases towards the latter. In conclusion, the
development and implementation of ML-GPS advance the identification of drug targets for chronic diseases, leveraging machine learning-assisted genetic associations and continuous feature
encoding to improve prediction performance and drug target coverage. ML-GPS also corroborates the viability of using predicted disease phenotypes to identify disease pathways and drug
targets. Future directions for ML-GPS include expanding its application to additional biobank datasets, particularly those representing non-European ancestries, to address genetic diversity
and enhance generalizability. Extending our framework to encompass additional diseases, including those unable to be accurately predicted in the UK Biobank, and refining machine learning
models to construct more accurate disease probability scores will strengthen its utility in precision medicine and drug discovery. METHODS In brief, we selected chronic disease phenotypes
(represented by phecodes) from the UK Biobank, trained machine learning models to predict diagnoses of these phecodes using comprehensive phenotypic data, performed genetic association
analyses using both observed case/control status and predicted phecode probabilities, and integrated this genetic evidence with existing evidence to construct ML-GPS (Fig. 1). ETHICAL
COMPLIANCE The UK Biobank study was approved by the North West Centre for Research Ethics Committee (11/NW/0382). Participants voluntarily enrolled and gave informed electronic consent. We
accessed participant data with UK Biobank approval under application ID 16218. The design and conduct of this study complied with all relevant regulations regarding the use of human study
participants and was conducted in accordance with the criteria set by the Declaration of Helsinki. SELECTING CHRONIC DISEASE PHECODES We directly mapped UK Biobank ICD-9 inpatient diagnoses
(field 41271), ICD-9 causes of death (field 40002), ICD-10 inpatient diagnoses (field 41270), and ICD-10 causes of death (field 40001) to phecodes using ICD-9 and ICD-10 to phecodeX maps16.
For general practitioner (GP) records (field 42040), we first converted Read v2 and Read v3 codes to ICD-10 codes using default conversion tables (resource 592) and then converted them to
phecodes using the ICD-10 to phecodeX map. Of 3612 phecodes included in phecodeX, we removed phecodes from seven categories: Neonatal and Pregnancy as they are acute and/or restricted to
specific populations; Infectious and Neoplasms as they are acute and/or caused by external agents (albeit susceptibility may be influenced by host genetics); Mental as they are unlikely to
be predictable using phenotypic data available in the UK Biobank; Symptoms as they are non-specific; and Genetic as they consist of monogenic diseases. We next selected all level 1 phecodes,
as well as level 0 phecodes without level 1 child phecodes, with > 0.001 prevalence among 228,879 participants with GP records. This filtering yielded 650 phecodes (Supplementary Data
1). We subsequently manually reviewed these 650 phecodes to remove ones that were acute (lasting for fewer than three months), infectious, environmental (caused primarily by trauma, diet, or
other environmental exposures), or non-specific (e.g., is a symptom that could be associated with many different diseases or is a disease with an unclear or widely variable phenotype).
However, we retained five acute phecodes that represent chronic disease processes: four of them [myocardial infarction (CV_404.1), cardiac arrest (CV_420), stroke (CV_431.1), arterial
embolism and thrombosis (CV_438.4)] that reflect atherosclerosis, and one [arterial dissection (CV_438.4)] that reflects vasa vasorum dysfunction44. This filtering yielded 386 phecodes.
STUDY SAMPLE We performed machine learning and genetic analyses using UK Biobank data45. Of 426,844 participants of European ancestry as defined by the Pan-UK Biobank project (return
2442)46, we removed 1366 participants listed as chromosomal sex discordant with self-reported sex (fields 22001 and 31, respectively), presence of sex chromosome aneuploidy (field 22019);
outliers for heterozygosity or missing rate (field 22027), and/or presence of ten or more third-degree relatives (field 22021). We further removed 28,873 participants who did not have at
least 75% of 72 laboratory and vital measurements used to train machine learning models. This yielded 396,605 participants for whom we generated machine-learning scores and performed all
genetic analyses. These participants had a median age of 58.8 [IQR 12.8], and 182,520 (46.0%) self-reported as male. For all participants, we used phenotypic data obtained at the baseline
visit for consistency. For participants with missing laboratory and vital measurements, we imputed missing values using the IterativeImputer multivariate feature imputation function from
scikit-learn (version 1.4.1) with a default tolerance of 0.001. 44 measurements had missingness rates below 1% and all had missingness rates below 10% except for direct bilirubin (15.1%) and
lipoprotein A (20.8%) (Supplementary Data 15). Of the 396,605 participants, only 183,021 had linked GP records. Many chronic diseases are primarily diagnosed in outpatient settings, and for
70 of the 112 phecodes [62.5%] included in our final analysis, the proportion of observed cases was significantly higher among those with GP records compared to those without after
Bonferroni correction (Supplementary Data 16). Thus, we trained models only on the 183,021 participants with GP records, using both GP and inpatient records for these participants to assign
case/control status. We then used trained models to generate predictions for the remaining 213,584 participants without GP records. For consistency between those with and without GP records,
we only used inpatient diagnoses, which were available for all participants, as features for the machine learning model. There was no significant difference in the values of 123 of 189
features [65.1%] included in our models between those with primary care records compared to those without after Bonferroni correction (Supplementary Data 17). MACHINE LEARNING MODELS TO
PREDICT PHECODE DIAGNOSES We constructed machine learning models using LightGBM (version 4.0.0) but compared its performance with XGBoost (version 2.1.0) and the RandomForestClassifier
function from scikit-learn as sensitivity analyses. We trained LightGBM models to minimize log loss when predicting phecode diagnosis (encoded as zero or one) using the following parameters:
{‘boosting_type’: ‘goss’, ‘num_iterations’: 1000, ‘learning_rate’: 0.01, ‘num_leaves’: 80, ‘min_data_in_leaf’: 100, ‘early_stopping_round’: 10}. We tuned ‘boosting_type’ (options ‘gbdt,’
‘goss,’ and ‘dart’) and ‘num_leaves’ (increments of 10 from 10 to 100) to optimize AUROC using the GridSearchCV function from scikit-learn and selected the other three parameters based on
LightGBM recommendations47. As an initial filter for evaluating machine learning model performance, we constructed preliminary models using age, sex, and 72 laboratory and vital measurements
for the 386 chronic disease phecodes identified earlier. We retained 112 phecodes for which the area under the receiver operating characteristic curve (AUROC) was ≥ 0.70 and the area under
the precision-recall curve (AUPRC) exceeded the phecode’s prevalence. This step was also intended to select phecodes associated with chronic physiological changes. Since many disease
diagnoses occur several years before or after a participant’s enrollment in the UK Biobank (when measurements are recorded), diseases not associated with chronic changes would likely not be
accurately predicted by the model. For each of these 112 phecodes, we constructed final machine learning models consisting of 239 features. These features included age, sex, 72 laboratory
and vital measurements, 14 lifestyle factors, 101 three-character Anatomical Therapeutic Chemical (ATC) medication classes with ≥ 0.1% prevalence, and 50 embedded features reflecting
diagnostic history. We did not perform pre-training feature selection because LightGBM performs internal feature selection during tree construction; supporting this, models including only
important features did not have substantially different performance from models with all features (Supplementary Data 3). We included medication usage following a prior UK Biobank study
demonstrating that genome-wide association results using medication usage recapitulate results using the indicated diseases48, and we used their conversions between medication codes and ATC
codes. Medication usage may also explain variations in laboratory measurements49. For diagnostic history, we used previously published 50-dimensional embeddings of ICD-10 diagnostic codes as
distinct features to represent each participant’s full inpatient diagnostic history50. Because different ICD-10 codes representing similar conditions have similar embeddings, this approach
reduces model complexity and the impact of administrative misencoding. Specifically, for each participant, we first removed all ICD-10 codes used to define the phecode as well as duplicate
codes. We then converted each of the remaining codes to a 50-dimensional vector using the embeddings, and then averaged all vectors across each dimension. We used null values during training
and prediction for participants without any inpatient diagnostic history (_n_ = 50,604 of 396,605). GENETIC ANALYSES We performed three genetic analyses with non-overlapping variants to
model the allelic series of a gene on a given phecode: genome-wide association for variants with MAF ≥ 0.01 (common); exome-wide association for variants with MAF between 0.0001 and 0.01
(rare); and gene-level tests for variants with MAF below 0.0001 (ultra-rare). We performed each analysis with three different phenotypes among all 396,605 participants: observed phecode
case/control status (P), binarized model probabilities (B), and continuous model probabilities (C). We defined observed case/control status using both GP records and inpatient diagnoses. To
binarize model probabilities for each phecode, we selected the probability threshold yielding the maximum F1 score (Supplementary Data 18), which is the harmonic mean of precision and
recall. We beta-regressed machine learning probabilities for all participants on age, sex and 10 principal components of genotype data and transformed the resulting residuals using
rank-based inverse normal transformation. We followed standard steps to perform association testing using regenie (version 3.2.2). For all three analyses, we used genotype data to generate
ridge regression predictions (step 1 of regenie) on blocks of 2000 single nucleotide variants (SNVs). We filtered genotype data for variants with minor allele count (MAC) > 100, minor
allele frequency > 0.01, genotyping rate > 0.9, and Hardy-Weinberg exact test _p_-value < 1 × 10⁻¹⁵ using PLINK 2.0 (release 2023-11-23). For genome-wide common variant
associations, we performed the final association test (step 2 of regenie) on blocks of 500 SNVs from Haplotype Reference Consortium-imputed genotype data. We filtered this data for variants
with INFO score > 0.8, MAC > 100, MAF ≥ 0.01, genotyping rate > 0.9, and Hardy-Weinberg exact test _p_ value < 1 × 10⁻¹⁵. To determine independent loci that were genome-wide
significant, we performed linkage disequilibrium (LD)-based clumping with a primary significance threshold of 5 × 10⁻⁸, distance threshold of 250 kb, and r2 threshold of 0.01 using PLINK
2.0. To determine independent loci regardless of significance, we repeated LD-based clumping with a primary significance threshold of 0.05, distance threshold of 250 kb, and r2 threshold of
0.01. Adapting the closest gene approach for gene prioritization51,52, we then used expression quantitative trait loci (eQTL) data from the GTEx project to map each independent locus to the
closest gene demonstrating a significant expression correlation (eQTL gene). Mapping to eQTL data was also required to infer the direction of effects of common variant associations, which we
used to construct the directional version of the genetic priority score [see “Genetic priority scores (directional)”]. Across all phecodes, we mapped 61% of independent loci to an eQTL
gene, and 42% of eQTL genes were also the closest overall gene (Supplementary Data 19). For exome-wide rare single variant coding associations, we performed the final association test (step
2 of regenie) on blocks of 500 SNVs from exome sequencing data. We filtered these data to identify 233,982 missense and protein-truncating variants (nonsense, indel frameshift, canonical
splice site variants) with MAC > 5, 0.0001 \(\le\) MAF < 0.01, genotyping rate > 0.9, and Hardy-Weinberg exact test _p_-value < 1×10⁻¹⁵. We used Ensembl variant effect predictor
(VEP) tool (version 111) to identify missense and protein truncating variants. For analyses where we examined only significant variants, we defined these variants using a threshold of p <
4.3×10⁻⁷ following the approach of Sveinbjornsson et al.53 we then re-ran the final association test for these variants conditioned on the genome-wide significant independent loci
identified from the common variant analysis for the same phecode to account for rare variant association signals that may be attributed to LD with common variants54,55. For analyses where we
examined all variants irrespective of significance, we did not perform conditional analyses due to computational limitations. For gene-level tests of ultra-rare coding variants, we
considered only ultra-rare variants with MAF < 0.0001 that were either deleterious missense or protein truncating variants. There were 1,767,642 such variants mapped to 18,544 genes. We
defined deleterious missense variants as those predicted to be deleterious or protein intolerant by each of PolyPhen-2 HumVAR, PolyPhen-2 HumDIV, sorting intolerant from tolerant, likelihood
ratio test, and MutationTaster. We generated these annotations using Ensembl VEP. We then performed standard burden tests, sequence kernel association tests, optimal unified SKAT, and
aggregated Cauchy association tests for each gene using regenie and used the association result from the test with the strongest _p_-value. We used a Bonferroni-corrected _p_-value threshold
(0.05/number of genes tested, or 0.05/18,544) to define significant gene-level associations. As with rare variants, for analyses where we examined only significant associations, we re-ran
tests for genes with significant associations conditioned on the genome-wide significant independent loci identified from the common variant analysis for the same phecode. For analyses where
we examined all associations regardless of significance, we did not perform conditional analyses due to computational limitations. DRUG DATA We collected and processed drug data from the
Open Targets Platform (version 23.12) and the SIDER database (version 4.1)56,57. For Open Targets, gene target, drug indication, and drug mechanism of action data were available for each
drug. For SIDER, we separately identified gene targets using the mechanism of action data from Drugbank (release 5.1.10) and ChEMBL (release 33). We removed drugs with ATC code J
(Anti-infectives for systemic use) from both databases as their targets are primarily non-human genes. From Open Targets, we identified 4930 drugs, 1538 genes and 29,239 drug indications,
whereas from SIDER, we identified 886 drugs, 762 genes, and 11,702 drug indications. We then aggregated drug data in Open Targets and SIDER by gene and phecode (gene-phecode pairs) and
retained the highest clinical trial phase of all drugs targeting each gene-phecode pair for follow-up analyses. In Open Targets and SIDER, 73 and 77 of the 112 included phecodes had at least
one drug indication, respectively. To create training and external testing datasets, we repeated all unique genes for each of the phecodes with at least one indication in Open Targets and
SIDER, respectively, resulting in final datasets with 1538 × 73 = 112,274 and 762 × 77 = 58,674 unique gene-phecode pairs. EXISTING GENETIC EVIDENCE We collected and filtered existing
genetic evidence from four sources similar to our prior approach7: EVA-ClinVar (sourced from Open Targets Platform version 23.12)58, OMIM (accessed December 18, 2023)58, HGMD Professional
(version 2023.3)59, and Locus-to-gene (L2G; sourced from Open Targets Platform version 23.12)60. For each source, we mapped different disease ontologies (e.g., MONDO, OMIM, UMLS) first to
ICD-10 codes using Disease/Phenotype annotations provided by Open Targets as well as the UMLS Metathesaurus (release 2023AB). We then mapped ICD-10 codes to phecodes using the ICD-10 to
phecodeX map61. Additionally, we directly mapped HPO codes, including those present in HGMD, to phecodes using the StrongEvidenceSpecific HPO to phecodeX map62. From EVA-ClinVar, we
identified 10,564 variants from 584 genes for 68 phecodes. From OMIM, we identified 1182 variants from 250 genes for 59 phecodes. From HGMD, we identified 54,169 variants for 3624 genes for
59 phecodes. From L2G, we identified 5324 genes for 68 phecodes; after filtering variants using the recommended score threshold of 0.5, we identified 1704 genes for 59 phecodes. GENETIC
PRIORITY SCORES We constructed ElasticNet logistic regression and LightGBM binary classification models to predict whether each gene-phecode pair has an indicated drug and used continuous
prediction probabilities from these models as genetic priority scores. These scores are non-directional as they do not predict whether a drug with an activator or inhibitor mechanism is
required. We trained models using the larger Open Targets dataset (112,274 pairs) and externally tested them in the smaller SIDER dataset (58,674 pairs). Models included up to 13 features:
four of these features represented existing genetic evidence (EVA-ClinVar, HGMD, OMIM, L2G). The other nine features represented genes identified from the common, rare, and ultra-rare
variant analyses for P, B, and C phenotypes. Feature weights and importances were not pre-defined and were determined automatically by each model. Both ElasticNet and LightGBM can handle the
multicollinearity present in our datasets: ElasticNet due to regularization63, and LightGBM because it will only use one of multiple highly correlated features. We implemented ElasticNet
using the SGDClassifier function from scikit-learn with the following parameters: {loss = ‘log_loss’, penalty = ‘elasticnet’, alpha = 5e-5, l1_ratio = 0.3}. We implemented LightGBM with the
following parameters: {‘boosting_type’: ‘goss’, ‘num_iterations’: 500, ‘learning_rate’: 0.01, ‘num_leaves’: 30, ‘min_data_in_leaf’: 50, ‘early_stopping_round’: 10}. We selected parameters
for both models again using GridSearchCV from scikit-learn but using AUPRC instead of AUROC as the optimization metric due to the rarity of drug indications. As a baseline, we used binary
encoding, where we assigned all features a value of zero or one (i.e., absence or presence of evidence); for L2G, we included only genes with a score > 0.5; and for the P, B, and C
features, we only included genes with a significant variant or test. We compared this with continuous encoding as follows: for EVA-ClinVar, HGMD, and OMIM, we assigned each gene the number
of distinct variants for that gene; for L2G, we assigned each gene the highest L2G score of all variants for that gene; and for the P, B, and C features, we assigned each gene the highest
-log10(_p_-value) from the genetic association results of all variants or tests for the gene. To prioritize gene-phecode pairs with greater pharmaceutical evidence, we tested sample
weighting based on either the number of distinct drugs or the maximum clinical trial phase. In both cases, we assigned all samples a base weight of 1. For number-based weighting, we assigned
gene-phecode pairs targeted by two, three, four, or five or more drugs weights of 1.5, 2.0, 2.5, and 3.0, respectively. For phase-based weighting, we assigned gene-phecode pairs targeted by
drugs in phase II, III, or IV weights of 1/0.63, 1/(0.63 × 0.31), and 1/(0.63 × 0.31 × 0.58), respectively, based on the success rates of drugs in these phases between 2006 and 201564. We
trained ElasticNet models using a five-fold cross-validation approach, where in each of five folds, we trained an ElasticNet model on 80% of the Open Targets dataset and used the resulting
coefficients to generate predictions for the remaining 20% of the Open Targets dataset (holdout testing) as well as the SIDER dataset (external testing). For ElasticNet models, we included
phecode categories and the ratio of observed/expected LOF variants (gnomAD v4.0) as covariates during model training, but did not use coefficients for these covariates when generating
predictions, consistent with the original implementation of GPS. ElasticNet regression coefficients are available in Supplementary Table 6. We trained LightGBM models using a nested
cross-validation approach with five outer folds and five inner folds due to the requirement of separate training, validation, and holdout sets. For each outer fold, we used 80% of the Open
Targets dataset for training and validation and 20% of the Open Targets dataset for holdout testing; we further split the former 80% into five inner folds, using 80% for training and 20% for
validation. We used each inner fold model to generate predictions for the outer fold holdout dataset, the SIDER dataset, as well as all other gene-phecode pairs where at least one of the
features was not zero. For both ElasticNet and LightGBM models, to avoid data leakage, we removed gene-phecode pairs from the SIDER dataset that were also present in either the training or
validation datasets in each iteration of model training. GENETIC PRIORITY SCORES WITH DIRECTION OF EFFECT We generated directional genetic priority scores by constructing LightGBM
multi-class one-versus-all classifiers. For each phecode, these classifiers predicted whether each gene was targeted by no drug, a drug with an activator mechanism (activator drug
indication), or a drug with an inhibitor mechanism (inhibitor drug indication), with the probabilities for each class summing to one. Using mechanism of action data from ChEMBL (release
33)7, we classified gene-phecode pairs targeted by drugs with allosteric antagonist, antagonist, antisense inhibitor, blocker, degrader, inhibitor, inverse agonist, negative allosteric
modulator, negative modulator, and releasing agent mechanisms as having inhibitor mechanisms and those targeted by drugs with activator, agonist, opener, partial agonist, positive allosteric
modulator, and positive modulator mechanisms as having activator mechanisms. In our dataset, we did not observe conflicting labels where a gene was targeted by both an activator and
inhibitor drug for a given phecode. For the EVA-ClinVar, HGMD, OMIM, and rare variant features, we separated each feature into three sub-features based on the effects of variants for each
gene: LOF, GOF, or neutral. To determine variant effect, we used Ensembl VEP (version 111) to predict whether variants were missense or LOF. We then used LoGoFunc (release 2023-01-23) to
predict whether missense variants were GOF, LOF, or neutral65. We similarly separated each of the L2G and common variant features into two sub-features: one including variants where
genome-wide association and eQTL effect estimates had opposite signs, and another including variants with matching sign estimates. Finally, we kept ultra-rare variant features unchanged as
we primarily tested LOF variants. Because there were substantially more inhibitor compared to activator drug indications in both Open Targets and SIDER, we weighed gene-phecode pairs with
activator drug indications twice as much as those with inhibitor drug indications during model training to decrease biases towards inhibitor drug indications. DATA AND STATISTICAL ANALYSES
We performed all analyses in Python (version 3.11). We cleaned downloaded data using pandas (version 2.1.3). We performed all statistical tests using scipy (version 1.12.0), including
Fisher’s exact tests to test for differences in proportions, Wilcoxon rank-sum tests to test for differences in feature values, and both Wilcoxon rank-sum and signed-rank tests to test for
differences in variant effect sizes. All tests were two-sided. We generated confidence intervals for machine learning performance metrics using bias-corrected and accelerated bootstraps with
1000 resamples. We compared machine learning models using permutation tests with 1000 permutations, with each permutation entailing random shuffling of predictions for each gene-phecode
pair from two different models66. We performed Cox regressions to calculate hazard ratios for all-cause mortality using lifelines (version 0.27.8), adjusting for age and self-reported sex.
We performed linear and logistic regressions using statsmodels (version 0.14.1); for logistic regressions to calculate odds ratios for drug indications, we adjusted for phecode categories
and the ratio of observed/expected LOF variants (gnomAD v4.0). We performed single-sample gene set enrichment analysis using GSEApy (version 1.1.1)67. REPORTING SUMMARY Further information
on research design is available in the Nature Portfolio Reporting Summary linked to this article. DATA AVAILABILITY All ML-GPS features and predictions as well as summary statistics for
genetic association analyses have been deposited in Zenodo (https://doi.org/10.5281/zenodo.10939110). A subset of this data is also available in the Supplementary Information, Supplementary
Data, and Source Data files. UK Biobank data are available upon application to the Access Management System. Gene-phecode pairs in the top 10% of ML-GPS scores can be accessed interactively
via a web application (https://rstudio-connect.hpc.mssm.edu/mlgps/). Source data are provided with this paper. Other resources used to construct ML-GPS can be accessed as follows: Drug, gene
target, drug indication, and drug mechanism of action data from Open Targets (version 23.12), https://platform.opentargets.org/downloads/. Drug indication data from SIDER (version 4.1),
http://sideeffects.embl.de/download/. Gene target and drug mechanism of action data from Drugbank (release 5.1.10), https://go.drugbank.com/releases/latest/. Gene target and drug mechanism
of action data from ChEMBL (release 33), https://ftp.ebi.ac.uk/pub/databases/chembl/ChEMBLdb/releases/chembl_33/. Variant effect predictions from Ensembl VEP (release 111),
http://ftp.ensembl.org/pub/release-111/gtf/homo_sapiens/. Clinical variants from OMIM (accessed November 1, 2023), https://www.omim.org/downloads. Clinical variants from HGMD Professional
(version 2023.3), https://www.hgmd.cf.ac.uk/ac/index.php. Quantitative trait locus data from GTEx Analysis V8, https://www.gtexportal.org/home/downloads/adult-gtex/qtl/. phecodeX definitions
and ICD-10 mappings (accessed November 1, 2023), https://phewascatalog.org/phecode_x. Ratio of observed/expected LOF variants from gnomAD v4 (accessed November 1, 2023),
https://storage.googleapis.com/gcp-public-data--gnomad/release/4.0/constraint/. Terminology conversions from UMLS Metathesaurus (release 2023AB),
https://www.nlm.nih.gov/research/umls/licensedcontent/umlsknowledgesources.html HPO to phecodeX map (accessed November 1, 2023), https://github.com/emcarthur/phecode-HPO-map/ Source data are
provided with this paper. CODE AVAILABILITY Analytic code to train phecode diagnosis prediction models, clean datasets used for ML-GPS, and train ML-GPS are available at Zenodo
(https://doi.org/10.5281/zenodo.10939110) in Jupyter Notebook format. REFERENCES * Vos, T. et al. Global burden of 369 diseases and injuries in 204 countries and territories, 1990–2019: a
systematic analysis for the Global Burden of Disease Study 2019. _Lancet_ 396, 1204–1222 (2020). Article Google Scholar * Plenge, R. M., Scolnick, E. M. & Altshuler, D. Validating
therapeutic targets through human genetics. _Nat. Rev. Drug Discov._ 12, 581–594 (2013). Article CAS PubMed Google Scholar * Loos, R. J. F. 15 years of genome-wide association studies
and no signs of slowing down. _Nat. Commun._ 11, 5900 (2020). Article ADS CAS PubMed PubMed Central Google Scholar * Finan, C. et al. The druggable genome and support for target
identification and validation in drug development. _Sci. Transl. Med._ 9, eaag1166 (2017). Article PubMed PubMed Central Google Scholar * Rusina, P. V. et al. Genetic support for
FDA-approved drugs over the past decade. _Nat. Rev. Drug Discov._ 22, 864–864 (2023). Article CAS PubMed Google Scholar * Minikel, E. V., Painter, J. L., Dong, C. C. & Nelson, M. R.
Refining the impact of genetic evidence on clinical success. _Nature_ 629, 624–629 (2024). Article ADS CAS PubMed PubMed Central Google Scholar * Duffy, Á. et al. Development of a
human genetics-guided priority score for 19,365 genes and 399 drug indications. _Nat. Genet._ 56, 51–59 (2024). Article CAS PubMed Google Scholar * Gomes, B. et al. Genetic architecture
of cardiac dynamic flow volumes. _Nat. Genet._ 56, 245–257 (2024). Article CAS PubMed Google Scholar * Pirruccello, J. P. et al. Genetic analysis of right heart structure and function in
40,000 people. _Nat. Genet._ 54, 792–803 (2022). Article CAS PubMed PubMed Central Google Scholar * Dahl, A. et al. Phenotype integration improves power and preserves specificity in
biobank-based genetic studies of major depressive disorder. _Nat. Genet._ 55, 2082–2093 (2023). Article CAS PubMed PubMed Central Google Scholar * An, U. et al. Deep learning-based
phenotype imputation on population-scale biobank data increases genetic discoveries. _Nat. Genet._ 55, 2269–2276 (2023). Article CAS PubMed PubMed Central Google Scholar * Cosentino, J.
et al. Inference of chronic obstructive pulmonary disease with deep learning on raw spirograms identifies new genetic loci and improves risk models. _Nat. Genet._ 55, 787–795 (2023).
Article CAS PubMed Google Scholar * Burstein, D. et al. Genome-wide analysis of a model-derived binge eating disorder phenotype identifies risk loci and implicates iron metabolism. _Nat.
Genet._ 55, 1462–1470 (2023). Article CAS PubMed PubMed Central Google Scholar * Petrazzini, B. O. et al. Exome sequence analysis identifies rare coding variants associated with a
machine learning-based marker for coronary artery disease. _Nat. Genet._ 56, 1412–1419 (2024). Article CAS PubMed Google Scholar * McCaw, Z. R. et al. An allelic-series rare-variant
association test for candidate-gene discovery. _Am. J. Hum. Genet._ 110, 1330–1342 (2023). Article CAS PubMed PubMed Central Google Scholar * Shuey, M. M. et al. Next-generation
phenotyping: introducing phecodeX for enhanced discovery research in medical phenomics. _Bioinformatics_ 39, btad655 (2023). Article CAS PubMed PubMed Central Google Scholar * Jordan,
D. M., Vy, H. M. T. & Do, R. A deep learning transformer model predicts high rates of undiagnosed rare disease in large electronic health systems. 2023.12.21.23300393 Preprint at
https://doi.org/10.1101/2023.12.21.23300393 (2023). * Yang, J. et al. Genomic inflation factors under polygenic inheritance. _Eur. J. Hum. Genet._ 19, 807–812 (2011). Article PubMed PubMed
Central Google Scholar * Sithu, S. D. et al. Atherogenesis and metabolic dysregulation in LDL receptor–knockout rats. _JCI Insight_ 2, (2017). * Chang, J.-H. et al. Identification and
characterization of LDL receptor gene mutations in hyperlipidemic Chinese. _J. Lipid Res._ 44, 1850–1858 (2003). Article CAS PubMed Google Scholar * Bjune, K., Wierød, L. & Naderi,
S. Triciribine increases LDLR expression and LDL uptake through stabilization of LDLR mRNA. _Sci. Rep._ 8, 16174 (2018). Article ADS PubMed PubMed Central Google Scholar * Tong, W. et
al. Wnt16 attenuates osteoarthritis progression through a PCP/JNK-mTORC1-PTHrP cascade. _Ann. Rheum. Dis._ 78, 551–561 (2019). Article CAS PubMed Google Scholar * Movérare-Skrtic, S. et
al. Osteoblast-derived WNT16 represses osteoclastogenesis and prevents cortical bone fragility fractures. _Nat. Med._ 20, 1279–1288 (2014). Article PubMed PubMed Central Google Scholar *
Finberg, K. E. et al. Mutations in TMPRSS6 cause iron-refractory iron deficiency anemia (IRIDA). _Nat. Genet._ 40, 569–571 (2008). Article CAS PubMed PubMed Central Google Scholar *
Guo, S. et al. Reducing TMPRSS6 ameliorates hemochromatosis and β-thalassemia in mice. _J. Clin. Invest._ 123, 1531–1541 (2013). Article CAS PubMed PubMed Central Google Scholar * Xu,
X., Li, J., Zhang, Y. & Zhang, L. Arachidonic Acid 15-Lipoxygenase: Effects of Its Expression, Metabolites, and Genetic and Epigenetic Variations on Airway Inflammation. _Allergy Asthma
Immunol. Res._ 13, 684–696 (2021). Article CAS PubMed PubMed Central Google Scholar * Guo, H. et al. Novel 15-Lipoxygenase-1 Inhibitor Protects Macrophages from
Lipopolysaccharide-Induced Cytotoxicity. _J. Med. Chem._ 62, 4624–4637 (2019). Article CAS PubMed PubMed Central Google Scholar * Humbert, M. et al. Sotatercept for the Treatment of
Pulmonary Arterial Hypertension. _N. Engl. J. Med._ 384, 1204–1215 (2021). Article CAS PubMed Google Scholar * Hoeper, M. M. et al. Phase 3 Trial of Sotatercept for Treatment of
Pulmonary Arterial Hypertension. _N. Engl. J. Med._ 388, 1478–1490 (2023). Article CAS PubMed Google Scholar * Jennings, D. et al. LRRK2 Inhibition by BIIB122 in Healthy Participants and
Patients with Parkinson’s Disease. _Mov. Disord._ 38, 386–398 (2023). Article CAS PubMed Google Scholar * Biogen. A Phase 3, Multicenter, Randomized, Double-Blind, Placebo-Controlled
Study to Determine the Efficacy and Safety of BIIB122/DNL151 in Participants With Parkinson’s Disease and Pathogenic LRRK2 Variants. https://clinicaltrials.gov/study/NCT05418673 (2023). *
O’Donoghue, M. L. et al. Small Interfering RNA to Reduce Lipoprotein(a) in Cardiovascular Disease. _N. Engl. J. Med._ 387, 1855–1864 (2022). Article PubMed Google Scholar * Novartis
Pharmaceuticals. _A Randomized, Participant and Investigator Masked, Placebo-Controlled, Multicenter, Proof-of-Concept Study to Assess the Safety and Efficacy of LNP023 (Iptacopan) in
Patients With Early and Intermediate Age-Related Macular Degeneration_. https://clinicaltrials.gov/study/NCT05230537 (2024). * Kooiker, K. B. et al. Danicamtiv Increases Myosin Recruitment
and Alters Cross-Bridge Cycling in Cardiac Muscle. _Circ. Res._ 133, 430–443 (2023). Article CAS PubMed PubMed Central Google Scholar * Bristol-Myers Squibb. _An Open-Label, Exploratory
Study of the Safety and Preliminary Efficacy of Danicamtiv in Stable Ambulatory Participants With Primary Dilated Cardiomyopathy Due to Either MYH7 or TTN Variants or Other Causalities_.
https://clinicaltrials.gov/study/NCT04572893 (2023). * Liu, Z.-J. et al. Notch activation induces endothelial cell senescence and pro-inflammatory response: Implication of Notch signaling in
atherosclerosis. _Atherosclerosis_ 225, 296–303 (2012). Article CAS PubMed PubMed Central Google Scholar * Rizzo, P. & Ferrari, R. The Notch pathway: a new therapeutic target in
atherosclerosis? _Eur. Heart J. Suppl._ 17, A74–A76 (2015). Article CAS Google Scholar * Uneri, C., Oztürk, O., Polat, S., Yüksel, M. & Haklar, G. Determination of reactive oxygen
species in nasal polyps. _Rhinology_ 43, 185–189 (2005). PubMed Google Scholar * Bozkus, F. et al. Evaluation of total oxidative stress parameters in patients with nasal polyps. _Acta
Otorhinolaryngol. Ital. Organo Uff. Della Soc. Ital. Otorinolaringol. E Chir. Cerv. -facc._ 33, 248–253 (2013). CAS Google Scholar * Shi, H. et al. Gestational stress induces the unfolded
protein response, resulting in heart defects. _Dev. Camb. Engl._ 143, 2561–2572 (2016). CAS Google Scholar * Camaré, C., Pucelle, M., Nègre-Salvayre, A. & Salvayre, R. Angiogenesis in
the atherosclerotic plaque. _Redox Biol._ 12, 18–34 (2017). Article PubMed PubMed Central Google Scholar * Rodrigo, R., González, J. & Paoletto, F. The role of oxidative stress in
the pathophysiology of hypertension. _Hypertens. Res._ 34, 431–440 (2011). Article CAS PubMed Google Scholar * Burkard, T. et al. Reliability of single office blood pressure
measurements. _Heart Br. Card. Soc._ 104, 1173–1179 (2018). Google Scholar * Bax, M. et al. Arterial dissections: Common features and new perspectives. _Front. Cardiovasc. Med._ 9, 1055862
(2022). Article CAS PubMed PubMed Central Google Scholar * Sudlow, C. et al. UK Biobank: An Open Access Resource for Identifying the Causes of a Wide Range of Complex Diseases of Middle
and Old Age. _PLoS Med._ 12, e1001779 (2015). Article PubMed PubMed Central Google Scholar * Karczewski, K. J. et al. Pan-UK Biobank GWAS improves discovery, analysis of genetic
architecture, and resolution into ancestry-enriched effects. 2024.03.13.24303864 Preprint at https://doi.org/10.1101/2024.03.13.24303864 (2024). * Ke, G. et al. LightGBM: A Highly Efficient
Gradient Boosting Decision Tree. in _Advances in Neural Information Processing Systems_ vol. 30 (Curran Associates, Inc., 2017). * Wu, Y. et al. Genome-wide association study of
medication-use and associated disease in the UK Biobank. _Nat. Commun._ 10, 1891 (2019). Article ADS PubMed PubMed Central Google Scholar * Young, D. S. Effects of Drugs on Clinical
Laboratory Tests. _Ann. Clin. Biochem._ 34, 579–581 (1997). Article PubMed Google Scholar * Kane, M. J. et al. A compressed large language model embedding dataset of ICD 10 CM
descriptions. _BMC Bioinforma._ 24, 482 (2023). Article Google Scholar * Weeks, E. M. et al. Leveraging polygenic enrichments of gene features to predict genes underlying complex traits
and diseases. _Nat. Genet._ 55, 1267–1276 (2023). Article CAS PubMed PubMed Central Google Scholar * Zhou, W. et al. Global Biobank Meta-analysis Initiative: Powering genetic discovery
across human disease. _Cell Genom._ 2, 100192 (2022). Article CAS PubMed PubMed Central Google Scholar * Sveinbjornsson, G. et al. Weighting sequence variants based on their annotation
increases power of whole-genome association studies. _Nat. Genet._ 48, 314–317 (2016). Article CAS PubMed Google Scholar * Hawkes, G. et al. Whole-genome sequencing in 333,100
individuals reveals rare non-coding single variant and aggregate associations with height. _Nat. Commun._ 15, 8549 (2024). * Ribeiro, D. M. & Delaneau, O. Non-coding rare variant
associations with blood traits on 166 740 UK Biobank genomes. 2023.12.01.569422 Preprint at https://doi.org/10.1101/2023.12.01.569422 (2023). * Koscielny, G. et al. Open Targets: a platform
for therapeutic target identification and validation. _Nucleic Acids Res._ 45, D985–D994 (2017). Article CAS PubMed Google Scholar * Kuhn, M., Letunic, I., Jensen, L. J. & Bork, P.
The SIDER database of drugs and side effects. _Nucleic Acids Res._ 44, D1075–D1079 (2016). Article CAS PubMed Google Scholar * Landrum, M. J. et al. ClinVar: improving access to variant
interpretations and supporting evidence. _Nucleic Acids Res._ 46, D1062–D1067 (2018). Article CAS PubMed Google Scholar * Hamosh, A., Scott, A. F., Amberger, J. S., Bocchini, C. A. &
McKusick, V. A. Online Mendelian Inheritance in Man (OMIM), a knowledgebase of human genes and genetic disorders. _Nucleic Acids Res._ 33, D514–D517 (2005). Article CAS PubMed Google
Scholar * Mountjoy, E. et al. An open approach to systematically prioritize causal variants and genes at all published human GWAS trait-associated loci. _Nat. Genet._ 53, 1527–1533 (2021).
Article CAS PubMed PubMed Central Google Scholar * PheWAS - Phenome Wide Association Studies. https://phewascatalog.org/phecode_x. * McArthur, E., Bastarache, L. & Capra, J. A.
Linking rare and common disease vocabularies by mapping between the human phenotype ontology and phecodes. _JAMIA Open_ 6, ooad007 (2023). Article PubMed PubMed Central Google Scholar *
Zou, H. & Hastie, T. Regularization and Variable Selection Via the Elastic Net. _J. R. Stat. Soc. Ser. B Stat. Methodol._ 67, 301–320 (2005). Article MathSciNet Google Scholar *
Mullard, A. Parsing clinical success rates. _Nat. Rev. Drug Discov._ 15, 447–447 (2016). PubMed Google Scholar * Stein, D. et al. Genome-wide prediction of pathogenic gain- and
loss-of-function variants from ensemble learning of a diverse feature set. _Genome Med._ 15, 103 (2023). Article CAS PubMed PubMed Central Google Scholar * Braun, T. M. & Alonzo, T.
A. A modified sign test for comparing paired ROC curves. _Biostatistics_ 9, 364–372 (2008). Article PubMed Google Scholar * Fang, Z., Liu, X. & Peltz, G. GSEApy: a comprehensive
package for performing gene set enrichment analysis in Python. _Bioinformatics_ 39, btac757 (2023). Article CAS PubMed Google Scholar Download references ACKNOWLEDGEMENTS RC and JP are
supported by the National Institute of General Medical Sciences of the NIH (T32-GM007280). RD is supported by the National Institute of General Medical Sciences of the NIH (R35-GM124836). YI
is supported by the Leducq Foundation (21CVD01) and by the Charles Bronfman Institute for Personalized Medicine, Icahn School of Medicine at Mount Sinai. DS is supported by the Helmsley
Foundation Award (2209-05535). AS is supported by the NIH (R01-CA277794 and R01-HD107528). The content is solely the responsibility of the authors and does not necessarily represent the
official views of the National Institutes of Health. The funders had no role in study design, data collection and analysis, decision to publish, or preparation of the manuscript. AUTHOR
INFORMATION AUTHORS AND AFFILIATIONS * The Charles Bronfman Institute for Personalized Medicine, Icahn School of Medicine at Mount Sinai, New York, NY, USA Robert Chen, Áine Duffy, Ben O.
Petrazzini, Ha My Vy, David Stein, Joshua K. Park, Yuval Itan, Daniel M. Jordan, Ghislain Rocheleau & Ron Do * Department of Genetics and Genomic Sciences, Icahn School of Medicine at
Mount Sinai, New York, NY, USA Robert Chen, Áine Duffy, Ben O. Petrazzini, Ha My Vy, David Stein, Joshua K. Park, Yuval Itan, Daniel M. Jordan, Ghislain Rocheleau & Ron Do * Medical
Scientist Training Program, Icahn School of Medicine at Mount Sinai, New York, NY, USA Robert Chen & Joshua K. Park * Center for Genomic Data Analytics, Icahn School of Medicine at Mount
Sinai, New York, NY, USA Ben O. Petrazzini, Ha My Vy, Daniel M. Jordan, Ghislain Rocheleau & Ron Do * Institute of Medical Genetics, School of Medicine, Cardiff University, Cardiff,
CF14 4XN, UK Matthew Mort & David N. Cooper * Department of Pharmacological Sciences, Icahn School of Medicine at Mount Sinai, New York, NY, USA Avner Schlessinger * Mindich Child Health
and Development Institute, Icahn School of Medicine at Mount Sinai, New York, NY, USA Yuval Itan Authors * Robert Chen View author publications You can also search for this author inPubMed
Google Scholar * Áine Duffy View author publications You can also search for this author inPubMed Google Scholar * Ben O. Petrazzini View author publications You can also search for this
author inPubMed Google Scholar * Ha My Vy View author publications You can also search for this author inPubMed Google Scholar * David Stein View author publications You can also search for
this author inPubMed Google Scholar * Matthew Mort View author publications You can also search for this author inPubMed Google Scholar * Joshua K. Park View author publications You can also
search for this author inPubMed Google Scholar * Avner Schlessinger View author publications You can also search for this author inPubMed Google Scholar * Yuval Itan View author
publications You can also search for this author inPubMed Google Scholar * David N. Cooper View author publications You can also search for this author inPubMed Google Scholar * Daniel M.
Jordan View author publications You can also search for this author inPubMed Google Scholar * Ghislain Rocheleau View author publications You can also search for this author inPubMed Google
Scholar * Ron Do View author publications You can also search for this author inPubMed Google Scholar CONTRIBUTIONS R.C., A.D. and R.D. conceived and designed the study. R.C. performed
statistical analyses. R.C., A.D., B.O.P., H.M.V., D.S., M.M., J.K.P, A.S., Y.I., D.N.C., D.M.J., G.R. and R.D. provided administrative, technical and material support. R.C. and R.D. drafted
the manuscript. R.D. supervised the study. All authors aided in the acquisition and interpretation of data and/or critical revision of the manuscript. R.C. and R.D. had access to and
verified all of the data in the study. CORRESPONDING AUTHOR Correspondence to Ron Do. ETHICS DECLARATIONS COMPETING INTERESTS RD reported being a scientific co-founder, consultant and equity
holder for Pensieve Health (pending) and being a consultant for Variant Bio, all not related to this work. DNC and MM acknowledge receipt of funding from Qiagen Ltd through a License
agreement with Cardiff University, which is relevant to the use of HGMD Professional in this work. All other authors have no competing interests. PEER REVIEW PEER REVIEW INFORMATION _Nature
Communications_ thanks Jiangning Song, and the other, anonymous, reviewer for their contribution to the peer review of this work. A peer review file is available. ADDITIONAL INFORMATION
PUBLISHER’S NOTE Springer Nature remains neutral with regard to jurisdictional claims in published maps and institutional affiliations. SUPPLEMENTARY INFORMATION SUPPLEMENTARY INFORMATION
PEER REVIEW FILE DESCRIPTION OF ADDITIONAL SUPPLEMENTARY FILES SUPPLEMENTARY DATA 1 SUPPLEMENTARY DATA 2 SUPPLEMENTARY DATA 3 SUPPLEMENTARY DATA 4 SUPPLEMENTARY DATA 5 SUPPLEMENTARY DATA 6
SUPPLEMENTARY DATA 7 SUPPLEMENTARY DATA 8 SUPPLEMENTARY DATA 9 SUPPLEMENTARY DATA 10 SUPPLEMENTARY DATA 11 SUPPLEMENTARY DATA 12 SUPPLEMENTARY DATA 13 SUPPLEMENTARY DATA 14 SUPPLEMENTARY
DATA 15 SUPPLEMENTARY DATA 16 SUPPLEMENTARY DATA 17 SUPPLEMENTARY DATA 18 SUPPLEMENTARY DATA 19 REPORTING SUMMARY SOURCE DATA SOURCE DATA RIGHTS AND PERMISSIONS OPEN ACCESS This article is
licensed under a Creative Commons Attribution-NonCommercial-NoDerivatives 4.0 International License, which permits any non-commercial use, sharing, distribution and reproduction in any
medium or format, as long as you give appropriate credit to the original author(s) and the source, provide a link to the Creative Commons licence, and indicate if you modified the licensed
material. You do not have permission under this licence to share adapted material derived from this article or parts of it. The images or other third party material in this article are
included in the article’s Creative Commons licence, unless indicated otherwise in a credit line to the material. If material is not included in the article’s Creative Commons licence and
your intended use is not permitted by statutory regulation or exceeds the permitted use, you will need to obtain permission directly from the copyright holder. To view a copy of this
licence, visit http://creativecommons.org/licenses/by-nc-nd/4.0/. Reprints and permissions ABOUT THIS ARTICLE CITE THIS ARTICLE Chen, R., Duffy, Á., Petrazzini, B.O. _et al._ Expanding drug
targets for 112 chronic diseases using a machine learning-assisted genetic priority score. _Nat Commun_ 15, 8891 (2024). https://doi.org/10.1038/s41467-024-53333-y Download citation *
Received: 15 April 2024 * Accepted: 09 October 2024 * Published: 15 October 2024 * DOI: https://doi.org/10.1038/s41467-024-53333-y SHARE THIS ARTICLE Anyone you share the following link with
will be able to read this content: Get shareable link Sorry, a shareable link is not currently available for this article. Copy to clipboard Provided by the Springer Nature SharedIt
content-sharing initiative