The cascade influence of grain trade shocks on countries in the context of the russia-ukraine conflict
- Select a language for the TTS:
- UK English Female
- UK English Male
- US English Female
- US English Male
- Australian Female
- Australian Male
- Language selected: (auto detect) - EN
Play all audios:

ABSTRACT The Russia-Ukraine conflict has severely impacted global food security. This may increase the risk of supply chain disruption in low-income countries that rely heavily on grain
imports. This study used production and trade data for wheat, barley and maize from 1995 to 2021 to construct longitudinal trade networks. On this basis, a cascading failure network model of
shock propagation was used to identify the direct or indirect dependence of other countries on grain exported from Russia and Ukraine and the impact caused by trade shocks. The results
revealed that the interruption of grain exports from Russia and Ukraine has resulted in an increasing impact on the global grain trade year by year and that the wheat trade is the most
vulnerable to shock propagation, but it is also the most resilient. Russia and Ukraine interrupt exports of grain, causing more than 50% reduction in direct imports to 30 countries,
including Eritrea, Seychelles, Kazakhstan and Mongolia. A shock propagation model that considers indirect dependence yields divergent results, with lower middle income (LM) countries in
North Africa, Southeast Asia and West Asia facing supply shocks from reduced imports because they are unable to fully exploit the trade channels to balance grain supply and demand. Under the
COVID-19 pandemic, this indirect dependence on imports is more prominent. It is worth noting that Eastern and Southern European countries often act as intermediaries to spread shocks during
cascading failures. In the process of shock propagation, the main suppliers of grain include the United States, Canada, France, Argentina and Brazil. After the outbreak of COVID-19, the
import demand faced by Australia increased significantly. We also examined how nodal characteristics relate to shock propagation dynamics and country vulnerability, finding that high import
diversity, low import dependence and regional characteristics are effective in buffering countries from supply shocks. This study contributes to our understanding of the external supply
risks for grain arising from the Russia-Ukraine conflict in a pandemic context, highlights the issue of accessibility in food security and provides trade policy recommendations to mitigate
national vulnerability to food insecurity, thereby creating a resilient food trade system. SIMILAR CONTENT BEING VIEWED BY OTHERS SHOCK PROPAGATION FROM THE RUSSIA–UKRAINE CONFLICT ON
INTERNATIONAL MULTILAYER FOOD PRODUCTION NETWORK DETERMINES GLOBAL FOOD AVAILABILITY Article 15 June 2023 INTERNATIONAL COOPERATION WAS KEY TO STABILIZE WHEAT PRICES AFTER THE RUSSIAN
INVASION OF UKRAINE Article Open access 03 September 2024 HOW DOES THE SELF-SUFFICIENCY RATE AFFECT INTERNATIONAL PRICE VOLATILITY TRANSMISSIONS IN THE WHEAT SECTOR? EVIDENCE FROM
WHEAT-EXPORTING COUNTRIES Article Open access 09 July 2020 INTRODUCTION The production and trade of grain cover almost all countries in the world, forming an intertwined network of
interdependence (Seekell et al. 2018; Zhang et al. 2021). As a primary food staple, grain is the most important source of calories for human consumption (Ben Hassen and El Bilali 2022). This
study focuses on the trade of wheat, barley and maize. According to trade data from the Food and Agriculture Organisation (FAO), the number of countries involved in the trade of these three
grains is among the top ten for agricultural products, as is the total value of trade. These three grains provide more than 35% of the calories in the human diet, more than 30% of the
calories in the food trade, and approximately 19% of the trade of protein for human consumption (D’Odorico et al. 2014). This indicates that international trade in wheat, barley and maize
has become an important and effective means to ensure national food security (Lesk et al. 2016; Martin-Shields and Stojetz 2019). Russia and Ukraine are the major exporters of grain
globally. In 2021, the total export quantity of wheat, barley and maize of the two countries was approximately 92.546 million tonnes, accounting for 28%, 26% and 15% of the global share,
respectively. The countries that were export trading partners for each grain type covered an average of 55%, 24% and 27% of the global population (Nasir et al. 2022). In 2023, the total
production of wheat, barley and maize in Russia and Ukraine could increase by 64% up to 267 million tonnes (FAO 2022d, 2022e). In particular, LM countries located in West Asia, Southeast
Asia and North Africa are the main grain sales areas of the two countries, with these areas importing an average of 44%, 36% and 23% of wheat, barley and maize, respectively, from Russia and
Ukraine (Ben Hassen and El Bilali 2022). Therefore, the continued export of grain from Russia and Ukraine plays a key role in securing the stability of the global grain supply chain.
However, the outbreak of the Russia-Ukraine conflict occurred on February 24, 2022. Russia imposed export control measures on some grain. Ukraine’s grain production and export path were also
hampered (FAO 2022b, 2022c). This situation contributed to an increased global food supply crunch, which posed a challenge to the realisation of SDG 1 (no poverty), SDG 2 (zero hunger) and
SDG 12 (responsible consumption and production) in the Sustainable Development Goals (SDGs) (United Nations 2019). The disruptive impact of geopolitical conflicts on international grain
markets and trade continues to spill over, and shocks will be transmitted along trade links (FAO 2022b, 2022e). In this context, understanding how conflict-related disruptions in global
grain markets may affect supply is critical to understanding the overall impact on global food security. Against the background of the COVID-19 epidemic, and a conflict between two major
participants in the international grain industry, this conflict is causing widespread concern about food security (Benton et al. 2022; Nasir et al. 2022). While Russian and Ukrainian exports
are hampered, alternative suppliers may impose additional protectionist measures, while importing countries will scramble to stockpile for fear of reduced future supplies. A series of
knock-on effects could trigger a significant increase in grain prices (Soffiantini 2020; Field 2016). The FAO estimates that the price of grain will increase by 8% to 22% higher than the
price in early 2022. According to World Bank estimates, every percentage point increase in grain prices will push 10 million people into severe poverty, and the impact of conflict could
increase the number of people in poverty globally by more than 100 million. Medium- (6 months-2 years) to long- (>2 years) term conflicts have the potential to push millions of people
into hunger and poverty, limiting the possibilities of humanitarian aid for malnutrition and thus increasing the number of malnourished people (Kemmerling et al. 2022). The World Food
Programme (WFP) estimates that the number of people suffering from severe hunger has increased by 47 million to 323 million and the number of undernourished people has increased by 5.5
million to 13.1 million globally compared to the preconflict period. Taken together, the combined effects of sanctions and conflict are having a global shockwave, which could create a
disproportionate grain crisis for low-income and middle-income countries that are heavily dependent on imports. Theoretically, the integrated character of the global market should make the
grain supply system more resilient and facilitate risk diversification. This is because shocks to domestic grain supply can be compensated for by import purchases from more distant regions
(Puma et al. 2015; D’Amour et al. 2016). However, if shocks are high intensity, such global imports can lead to severe vulnerabilities in the global grain trading system, and interconnected
markets can facilitate the transmission of shocks as well as their potential diffusion. Exporting countries often apply restrictions to trade policies to stabilise their domestic supply at
the expense of world market supply (Glauber et al. 2022; Food Security Portal 2022; COVID-19 Food Trade Policy Tracker 2022). The state of the supply demand imbalance is directly reflected
in the redistribution of global grain trade flows, and countries are directly or indirectly exposed to the crisis of hunger and malnutrition through the global market (García-Dorado et al.
2019). However, the complexity of the international trading system makes it difficult to assess the resulting dependence of countries. Therefore, there is a need for a cascade failure
network model that can capture exogenous shocks (Motter and Lai 2003; Dobson et al. 2005; Lee et al. 2004). With the aid of the effective tool of complex network analysis, this study used
the process of the diffusion of shocks along trade links to investigate the dual role of trade in mitigating and propagating local disruptions to grain exports, which will reveal hidden
indirect dependencies between countries and quantify the larger grain supply gap. This study proposed a concise and effective model that assumes small variations in the observed annual trade
networks, which we believed to be realistic. Under such assumptions, countries involved in the global grain trade maintain their preferences for their trading partners. On this basis, we
analysed the linkage effects between multiple regions at the global level through a threshold network model with cumulative load (Bramoullé et al. 2016; Burkholz et al. 2018; Burkholz and
Schweitzer 2019) to predict how different levels of export declines in Russia and Ukraine may affect other countries directly or indirectly through cascading failures in grain supply
deficits. Specifically, when an external shock occurs, there is a negative shock from import reduction in importing countries, who consider shifting their demand through existing trade links
to fill the supply gap from other exporting countries. These exporting countries experience a positive shock from increased exports, and the positive shock leads to a decline in domestic
supply space. If the domestic supply space of an exporting country cannot support the further expansion of exports, that is, the balanced domestic supply is reduced to the node failure
threshold, the country runs a supply deficit and becomes a trade failure. In the next moment, countries importing from failing trade countries face supply shocks of reduced imports, which
triggers a cascade failure under shock propagation. Thus far, we have used the state of trade failure triggered by the domestic supply deficit of the exporting country as a cascading
propagation mechanism for the network. The cascade propagation mechanism captures chain processes that cannot be observed with existing trade data, allowing the study of chain reactions
triggered by shocks originating in distant countries and obtaining the exposure of individual countries at the end of the cascade from local shocks. In contrast to previous studies, first,
in the context of the Russia-Ukraine conflict, we modelled how trade shocks resulting from the disruption of Russian and Ukrainian exports could affect other countries in a direct or
indirect way, which is to our knowledge the first study of its kind since the outbreak of the Russia-Ukraine conflict. By constructing grain trade networks to model the cascading effects of
shocks from all countries (in turn), we capture not only the effects of first-order shocks on Russia and Ukraine’s direct export partners but also all the indirect effects of higher-order
cascading failures due to shifts in import demand. Second, our model took into account the fact that a country’s level of economic development affects its consumption and inventory levels
and thus its ability to withstand external shocks. In addition, we considered that changes in grain supply and demand due to shocks can generate fluctuations in market prices and that
countries at different levels of economic development have different trading behaviours in response to price dynamics. Third, we distinguished between external shocks in different trade
directions (decrease in imports and increase in exports). On this basis, it is possible to know the differentiated trade risks suffered by countries located at different levels of the global
grain trade system. Fourth, we used longitudinal network data from 1995 to 2021 to simulate cascading failures under trade shocks, including 2020 and 2021 under the COVID-19 epidemic.
Through comparative analysis, we can observe the impact of the COVID-19 epidemic on the global grain supply crisis to a certain extent. Continuous time series analysis based on big data is
expected to provide the prerequisite for accurate prediction. Fifth, we established the relevance of a country’s network status and network topology to propagation dynamics and explored the
factors influencing country vulnerability from adverse events. We demonstrated that centrality indicators and regional attributes significantly predict the intensity of shocks faced by
specific countries. This study aims to fill the gap in research on the cascading responses resulting from the propagation of trade flow shocks triggered by the Russia-Ukraine conflict in
global grain trade networks. To address these gaps, this study used global wheat, barley and maize trade and production data for the period 1995–2021 and constructed corresponding global
trade networks to explore the vulnerability of the global grain system from a complex systems perspective. Here, this study understood vulnerability as the risk that trade shocks expose to
any agent (the country’s direct and indirect trading partners) or to the system as a whole (the topology of the trade networks). The impact of the Russia-Ukraine conflict on the global
wheat, barley and maize supply was examined by addressing the following five questions: (1) How many countries consider Russia and Ukraine major wheat importers, and to what extent does
direct dependence arise? (2) What is the impact of cascade failures under shocks on the dynamic evolution of the trade network structure? (3) How many countries act as suppliers to fill
supply gaps in shock propagation, and what is the intensity of the positive shocks created? (4) How many countries are facing demand imbalance in the process of cascade failure, and how
severe is the supply reduction? (5) To what extent do the network characteristics of countries at risk of food insecurity predict their level of exposure to supply shocks? This study aims to
understand the systemic risks to global grain supply from trade shocks triggered by the Russia-Ukraine conflict in a pandemic context. We not only established the dynamics of shock
propagation from the disruption of grain exports from Russia and Ukraine, thereby capturing the impact of shocks on direct and indirect trading partners but also distinguished the direction
of trade flows to examine differential shocks to countries. On this basis, evidence is provided for the degree of vulnerability by country attributes and node characteristics. A thorough and
in-depth analysis of the global food insecurity caused by the ongoing Russia-Ukraine conflict could provide trade policy recommendations to ensure the availability of grain for national
diets, creating a global food trade system with high elasticity, high stability and strong resilience. This study is structured as follows: Section “Literature review” presents some previous
studies using numerical modelling methods to simulate trade shocks; Section “Data and methods” describes the definition of trade networks, the methods for cascading failure model
simulations and regression analysis under trade shocks; Section “Results” reports the results of the analysis of trade networks, the results of the cascading failure network model
simulations for shock propagation (the results are presented for the periods up to 1995, for the pre-COVID-19 epidemic and for the post-COVID-19 epidemic) and the results of the regression
analysis; Section “Discussion of the results” discusses the conclusions drawn from the simulation and regression analysis; and finally, Section “Conclusion and policy recommendations”
summarises the potential solutions and policy suggestions from this study on food insecurity. LITERATURE REVIEW In the economics literature, a cutting-edge approach to understanding the
impact of external disturbances is to focus on the complexity of the system (Schweitzer et al. 2009; Buldyrev et al. 2010; Porfirio et al. 2018; Dueñas et al. 2021). The propagation or
contagion of crises in networks has been developed in the context of complex systems and is primarily based on random graph theory (Bollobás, Riordan 2011; Callaway et al. 2000). Through
this approach, a number of studies on financial networks have addressed the risks associated with defaults and how the contagion of a crisis is largely dependent on the pattern of
connections between network nodes (Allen and Gale 2000; Gai and Kapadia 2010). The structure of network interdependencies and feedback may also produce amplified responses to shocks, for
example, in a regional input‒output production network (Contreras and Fagiolo 2014; Acemoglu et al. 2012). Against the background of the grain supply system, a key source of global
complexity is the international grain trade because it has numerous interactions and interdependencies, which makes it difficult to assess the impact of grain shocks on countries (Burkholz
and Schweitzer 2019). However, it is essential to understand the characteristics and interdependence of networks because it enables us to have an in-depth understanding of the sensitivity of
global interconnections to system-wide failures and policies that can reduce the possibility and severity of such failures (Helbing 2013). Recent studies have highlighted the adverse
effects of natural conditions and human factors generating grain trade shocks, that is, the creation of spatially uncorrelated remote coupling between agricultural production and trade
behaviour, which can lead to food insecurity in the form of supply shortages on a global scale (Puma et al. 2015; Marchand et al. 2016; Gutiérrez-Moya et al. 2021). Weather-related shocks
are particularly important as crops are very sensitive to weather extremes (including high (Battisti and Naylor 2009) and low (Engvild 2003) temperatures, droughts (Li et al. 2009) and
floods (Rosenzweig et al. 2002). The impact on output caused by bad weather is no exception in remote areas. Periodic adverse weather conditions not only make grain prices higher but also
aggravate countercyclical trade policies in some cases (Gutiérrez-Moya et al. 2021), resulting in a shortage of grain, coupled with governance obstacles that cannot be dealt with in a short
time. Output shocks cause political instability all over the world, showing the fragility of international trade. The social movements in North Africa and East Asia (the “Arab Spring”)
confirm this claim, as the heat wave that affected Russian production changed the geopolitical reality in these regions (D’Amour et al. 2016). Unfortunately, such changes in climatic
conditions, with rising temperatures, extreme rainfall and droughts, tend to occur with increasing frequency (Gutiérrez-Moya et al. 2021). Fraser et al. (2013) used a number of hydrological
models, taking into account different cereals, to identify regions that are more vulnerable to climate stress. They found that in the wheat trade, the regions more vulnerable to drought and
with reduced adaptive capacity were the US southeast, the South American southeast, the Mediterranean northeast and Central Asia. D’Odorico et al. (2014) argued that because agriculture is
so dependent on climatic conditions, climate change will cause supply shocks. Uncertainty in crop yields and price volatility will be a common occurrence, and rising demand is unlikely to be
fully met. Nelson et al. (2010) quantised the extent to which changing temperature and precipitation patterns affect global or country-specific crop yields, confirming that the negative
impacts of climate change on food security can be offset by broad-based economic growth (especially increased agricultural productivity) and robust international trade in agricultural
products. Lobell et al. (2011) found that global warming on a global scale is reducing average global yields because the positive effects of fertilisation are less than the damaging effects
of adverse climatic conditions. Porter et al. (2014) emphasised that as extreme weather becomes more frequent, CO2 concentration, average temperature and extreme weather values will make
crop yield more variable. Violence, government control measures and trade shocks may form a vicious circle. Violent conflicts between countries and changes in export bans or subsidy policies
have had adverse and long-term effects on normal farming activities and grain circulation (Kemmerling et al. 2022). In the medium or long term, high-intensity trade shocks have become the
decisive factor in prolonging the policy period or aggravating violent conflicts, causing a vicious circle of adverse events and supply shortages (Hendrix and Brinkman 2013). In addition,
epidemics (including the global COVID-19 epidemic) that affect normal agricultural and trade activities and thus disrupt grain distribution networks are also potentially disruptive to the
global grain system (Rajpoot et al. 2021; Soares et al. 2022). Part of the research on the propagation of human-induced agricultural trade shocks focuses on the use of linear stability or
reactivity analysis methods to measure the immediate disruption of first-round impacts. Gutiérrez-Moya et al. (2021) used a combination of more than 200 major producing countries that
experienced production shocks to simulate crises of different intensities. They found that with the increase in years, when production shortages occurred, the number of people affected
decreased, but the affected population in countries with a low GDP changed greatly. Seekell et al. (2018) and Kummu et al. (2020) measured the elasticity of a country’s grain trade from the
dimensions of production and import channel diversity and set up a supply risk assessment model with three aspects: foreign dependence, import concentration and foreign trade risk. Zhang et
al. (2021) constructed an external supply risk assessment model for cereals based on the cereal trade network using the COVID-19 risk index (RICI) for importing countries. Current research
on the propagation of shocks from higher-order dependence in agricultural trade networks partly focuses on quantifying supply shortages at static points in time; another part uses unweighted
trade networks to analyse the damage caused by failures or shocks to the topology. Marchand et al. (2016) thought that the shortage of grain supply caused by the impact on production could
be solved by local adjustments or trade links. From the perspective of quality balance, this impact may be partially transmitted to other countries by reducing exports or increasing imports
in the affected areas, causing a nonlinear response (such as the threshold effect). Burkholz and Schweitzer (2019) believed that affected countries reduce or ban exports frequently, thereby
amplifying the initial shock. They found that the rice trade was most vulnerable to export chain restrictions, with many Asian and African countries being most vulnerable to waterfall
disasters. Puma et al. (2015) found that during the 2008–2011 grain crisis, the governments of exporters responded to soaring domestic grain prices by banning grain exports. Due to the
interruption of wheat production in Europe and rice production in Asia, the absolute decline of global wheat and rice exports further increased, and the loss of network connections was even
greater, thus making trade-dependent countries unsafe. D’Amour et al. (2016) used trade data for wheat, rice and maize to analyse remotely linked supply shocks resulting from export bans in
major producing regions. They found that the Middle East is most sensitive to supply shocks to wheat, Central America to maize and West Africa to rice. Gephart et al. (2016) modelled the
propagation of shocks in seafood trade networks and found that the risk of shocks increases with the total trade volume of imports and the number of import partners, with Central and West
Africa being the most vulnerable. Although a few studies have analysed linked trade shocks arising from export restrictions originating in one or more countries (Burkholz and Schweitzer
2019; Puma et al. 2015; Dupas et al. 2022; Fair et al. 2017), these studies rarely considered the fact that when a country faces a supply deficit from reduced imports, it uses the
interlocking relationships in the trade network to compensate for its own demand, causing other countries in the network to reach the threshold at which the node can no longer accommodate
the shock, triggering a cascading failure of the network. Second, in the propagation of trade shocks, there are two kinds of agents depending on the country’s response to the shocks:
suppliers who can afford to continue to expand their exports and make a profit and importers who are unable to dissipate the shock sufficiently and cause imports to fall. However, existing
studies have tended to focus on a single national response (Burkholz and Schweitzer 2019; Gutiérrez-Moya et al. 2021). Third, as a country’s level of economic development affects its
consumption and inventory levels, differences arise in the country’s ability to withstand external shocks. A country’s level of economic development can also affect its response to price
fluctuations. Therefore, the impact of a country’s level of economic development on the diffusion of trade shocks should be included in the model, but the existing research rarely takes this
into account (Gephart et al. 2016; Fair et al. 2017). Finally, previous studies mainly use monthly data (Nasir et al. 2022; Vora et al. 2019) and short-term trade data of one to two years
(D’Amour et al. 2016; Grassia et al. 2022; Zhang et al. 2021), ignoring continuous time information, which makes it impossible to capture changes in development trends, direction and
intensity. Time series analysis based on big data is helpful in generating preconditions for accurate prediction. Drawing on a network science approach, this study identified the role played
by Russia and Ukraine in linking grain flows between different regions and further derived cascading failures of supply deficits in global grain trade networks triggered by export bans.
This may be the first exploration of country-level cascading responses to trade flow shocks since the outbreak of the Russia-Ukraine conflict, thereby capturing the dynamic structural
evolution of grain trade networks in response to shocks and the contagion pathways of failure to better understand systemic risk. DATA AND METHODS DATA AND NETWORK STRUCTURE In this study,
we used actual international grain trade data to construct three weighted and directional global trade networks of wheat, barley and maize. We selected trade data for three grains — wheat,
barley and maize —for the following reasons: First, Russia and Ukraine are the most important contributors to global production of wheat, barley and maize in the international trade market
for grain. Combined, the two countries, on average and respectively, accounted for 19%, 14% and 4% of global output of these grain between 2016 and 2021 (Ben Hassen and El Bilali 2022;
Benton et al. 2022); second, many importing countries are more vulnerable than others and depend on Russia and Ukraine’s grain supplies. For instance, countries in the Middle East and North
Africa region rely on imports for more than 50% of their domestic grain needs, with a large part of the wheat, barley, and maize from Russia and Ukraine (FAO 2022c, 2022d, 2022e). Based on
this, we simulated the cascade failure due to the diffusion of trade flow shocks in the network. The nodes in this network represent countries involved in global trade in wheat, barley and
maize, the edges represent bilateral trade flows and the weight of the edges is the amount of exports (in metric tonnes) from country i to country j. In our analysis, we considered bilateral
trade data for 27 years from 1995–2021, with a different number of countries for each year and without excluding any major country. This is the most recent time interval for obtaining the
required data at the time of analysis. Specifically, our global wheat, barley and maize trade networks can be expressed by the formula \(Network = Net_t(N_t^P,E_t^W)\), where \(N_t^P\)
denotes the set of countries with the number of nodes _N_ and attribute _P_ in the trade network in period _t_, \(E_t^W\) denotes the set of trade links with the number of directed edges _E_
and weight _W_ in period _t_, _t_ = _1995..., 2021_, whose weight _W_ is determined by the amount of trade from exporting country i to importing country j in metric tonnes, where _i,
j∈{1_.....\(N_t^P\)_}_. We used product-level bilateral wheat, barley and maize trade data from the Food and Agriculture Organization’s (FAO) trade matrices. Wheat, barley and maize
production data for each country were obtained from the Food and Agriculture Organization’s online database (FAOSTAT). In addition, data on the economic and demographic attributes of
countries, including gross domestic product (GDP), gross domestic product per capita (GDPPC), percentage of population living below the national poverty line (Poverty ratio) and population
size (Population), were obtained from the World Bank database (WDOB). Data on trade agreements signed by countries were taken from the World Trade Organisation’s Regional Trade Agreements
database and Mario Larch’s Regional Trade Agreements database. Countries with production data for each year account for more than 90% of total world GDP per capita and their total volume of
trade accounts for more than 85% of the total world trade, so the cascade failure simulation under trade flow shocks using these data has a high degree of confidence. SHOCK SIMULATION To
explore how the shock from the Russia-Ukraine conflict caused a trade cascade failure in other exporting countries \(i \in N_t^P\), we constructed a network dynamics model of shock
propagation. The simulation process was based on the annual wheat, barley and maize trade data described above; specifically, our model analyzed this dynamic process for the global trade
network on discrete time scales _t_=_1,2,3.,T_, where _t_ is less than one year and _t_ = 0 refers to the data at the end of each year. The export trade quantity \(E_i(t = 0)\), import trade
quantity \(I_i(t = 0)\), and production quantity \(P_i(t = 0)\) for general country _i_ change annually as initial conditions. In a year, the production quantity \(P_i\) is assumed to be
fixed, while the import and export trade quantity can vary in time steps, denoted as \(E_i(t)\) and \(I_i(t)\). Before introducing the model, it is necessary to first determine the gross
domestic supply of generic country _i_ in a given year (before the shock), denoted as \(IS_i(t)\). Formally, $$IS_i(t) = P_i + I_i(t) - E_i(t)$$ (1) where \(P_i\), \(I_i(t)\) and \(E_i(t)\)
denote the quantity of production, import and export of country _i_ in a given year, with metric tons as the unit. It can be seen that the change of import and export trade quantity in
country _i_ will cause a change in the gross domestic supply \(IS_i(t)\) at time step _t_. This value is reflected in the FAOSTAT database’s Food Balance Sheet (FBS) (FAO 2022a) as the sum
of domestic supply and stock changes, which can reflect the total supply that a country can provide to the country during the year. In the global wheat, barley and maize trade networks, the
export quantity \(E_i(t)\) and import quantity \(I_i(t)\) of the generic country _i_ are calculated as follows: $$E_i(t) = \mathop {\sum}\limits_{j = 1}^{N(t - 1)} {W_{ij}}$$ (2) $$I_i(t) =
\mathop {\sum}\limits_{j = 1}^{N(t - 1)} {W_{ji}}$$ (3) where _N(t−1)_ is the number of nodes in the trade network after the exit of the countries with trade failure at the previous time
step. By using Eq. (1), we can calculate the initial domestic supply value for each country at time step _t_ = 0. At _t_ = 1, the trade flow shocks diffusion process originates in the
cessation of exports from Russia and Ukraine, and country _i_, which imports directly from both countries, generates a vacancy in the import trade quantity: $$ID_i(t = 1) = \mathop
{\sum}\limits_{s = 1}^{{{\mathrm{n}}}} {W_{si}}$$ (4) where _s_ denotes the failed countries and _n_ denotes the number of failed countries. Furthermore, country _i_ converts the vacancy
into import demand compensated through other import trade links and the shock begins to propagate through the network, causing a redistribution process of import trade flows along trade
links, that is, a shock to the gross domestic supply of country _i’s_ other import source countries _h_, \(W_{hi}(t) = W_{hi}(t = 0) + shock_i\). Thus, at the next time step _t+1_, the gross
domestic supply of country _h_ is given by $$IS_h(t + 1) = \max \{ P_h(t = 0) + I_h(t) - E_h(t) - shock_i,0\}$$ (5) It can be seen that after the initial shock _t = 1_, trade flow shocks
from import compensation accumulate at another exporting country _h_. These exporting countries may also be affected as importers at the previous time step and receive import compensation
from the nonfailing country at the next time step. This may lead to one of the following scenarios: either _h_ absorbs the shock through an increase in exports and in the next time step its
gross domestic supply \(IS_h(t + 1)\) changes (by reducing inventories, increasing imports and exports, etc.), or _h_ becomes a trade failure if its gross domestic supply \(IS_h(t + 1)\)
falls to zero. The trade failure in _h_ will affect all countries that trade with _h_, reducing the flow of trade in the network. At _t +2_, countries importing from _h_ face an import trade
gap \(ID_i(t + 2)\), and import demand spreads further along the trade link to other exporting countries. The demand for imports resulting from the cessation of exports propagates through
the trade network over time step _t_, involving an increasing number of countries. To complete Eq. (5), we must specify how import demand \(shock_i\) is distributed among the other import
trading partners _h_ of country _i_. According to Eq. (3), imports are defined by the weight \(W_{hi}\) of the trade linkage; when imports of _i_ decrease, they need to be compensated by an
increase in imports from the other exporting country _h_. The import demand will then propagate in a way that is proportional to trade quantity supplied to country _i_ by neighboring
countries and proportional to the GDP per capita of neighboring countries. Therefore, if \(ID_i(t) \,>\, 0\), the distribution of import demand satisfies the following equation:
$$W_{hi}(t) = W_{hi}(t - 1) + shock_i \cdot F_{hi}(t)$$ (6) where $$F_{hi}(t) = \left\{ {\begin{array}{*{20}{l}} {\frac{{W_{hi}}}{{I_i(t)}} \cdot \frac{{GDPPC_h}}{{\mathop {\sum}\nolimits_j
{GDPPC_j} }}} & {if\,k_i^{in}(t) \,\ne\, 1} \\ 1 & {otherwise} \end{array}} \right.$$ (7) In Eq. (7), the range of country _j_ is those import trading partners of country _i_ that
satisfy \(W_{ji} \,>\, 0\), \(GDPPC_j\) is the GDP per capita of country _j_, and \(k_i^{in}(t)\) is the in-degree of country _i_ at time step _t_ (i.e., the number of edges received by
country _i_). Thus, \(F_{hi}(t)\) denotes the fraction of import demand \(shock_i\) in country _i_ that is absorbed by country _h_. Its composition is divided into two components. On the one
hand, we assume that importing country _i_ does not change its country-specific preferences in a short period of time (Kinne 2013; Puma et al. 2015; Suweis et al. 2015), that is, the
increase in import demand is distributed across partners in proportion to the trade quantity supplied to country _i_. On the other hand, given that countries have different consumer demand
and inventory capacity, in the context of a supply crisis, international grain prices face upward pressure, when the more populous and poor countries are disproportionately affected by
external import demand (Puma et al. 2015), while the richer the country the more interested it is in selling grain on the international market at higher prices and thus expanding its
exports. That is, trading partner country _h_ reacted differently to the pressure to increase exports to country _i_, and have different capacities to withstand external shocks (Berazneva
and Lee 2013). Thus, the positive shocks to import demand is proportional to the GDP per capita of the import trading partner countries _h_. By adding this propagation condition, we
simulated some of the dynamics that may occur as a result of the effects of price fluctuations. Given an initial shock \(shock_i\), the combined Eqs. (4)-(7) determine the dynamics of the
cascade. Since the network is a loop, a country may suffer more than one impact during the shock of trade flows. If no country in the network becomes a trade failure because the gross
domestic supply falls to zero, then the final step of the cascade _t = T_ is reached. This time is always less than one year (Burkholz and Schweitzer 2019). The model facilitated the
assessment of global food insecurity risks resulting from the reconfiguration of trade flows in networks triggered by the reduction or disruption of exports from specific countries. This
study modelled changes in trade data aggregated at the year level in response to lower or disrupted grain exports from Russia and Ukraine. By modelling the cascading responses of countries
to trade shocks on time scales of less than one year, the state of this complex system determined the final simulation results presented in years. NATIONAL SHOCK ASSESSMENT In order to
assess the localised food insecurity risks to specific countries as a result of trade shocks arising from the Russia-Ukraine conflict, we need to further focus on the importing countries
that are most exposed to the spread of shocks and measure their vulnerability to negative shocks to grain supply, as well as explore whether and to what extent the country’s network location
predicts its exposure to the level of external supply shocks. According to D’Amour et al. (2016) and Fraser et al. (2013), the vulnerability of countries can be reflected in two dimensions:
(i) the translation of international trade shocks into shocks to domestic supply and (ii) the number of poor people affected. In a cascading failure model under shock propagation, we
obtained trade failure countries in the wheat, barley and maize trade networks that face supply deficits due to large import compensation, and simulated the resulting supply shocks to the
importing countries with which they trade. Specifically, we can calculate the negative shock as a percentage of domestic supply space (domestic demand), denoted _SR__I_, when the unmet
import demand of a country i leads to a decline in the volume of imports: $$\mathop {\sum}\limits_{t \le T} {SR_i(t)} = \frac{{\mathop {\sum}\nolimits_{j \in c_{{{{\mathrm{Failure}}}}},t \le
T} {W_{ji}(t)} }}{{P_i + I_i - E_i}}$$ (8) where the numerator denotes the volume of imports that cannot be met by country _i_ at time step _t_ due to the failure of trading partner _j_,
which belongs to the country that turns into a trading failure at time step _t_; the denominator represents country _i_’s domestic supply of grain, that is, domestic demand. \(\mathop {\sum
}\nolimits_{{{{\mathrm{t}}}} \le {{{\mathrm{T}}}}} SR_i\left( t \right)\) is the sum of the supply shocks to country _i_ for all time steps that the shock propagates through. Thus, when an
international trade shock is transmitted to within country _i_, the number of poor people affected by that supply shocks can be obtained as: $$Poverty_i = PR_i \cdot Population_i$$ (9)
$$PA_i = SR_i \cdot Poverty_i$$ (10) Where _PR__i_ indicates the percentage of the population in country _i_ living below the national poverty line in that year and _Population__i_ indicates
the population of country _i_ in that year. As a result, we measured the vulnerability of importing countries at risk of food insecurity. In addition, a series of regressions were carried
out to better understand the relationship between a country’s position in the grain trade networks and the attributes of the country on its exposure to supply shocks. First, we investigated
the network topology characteristics associated with the supply shocks of reduced imports to which the country is exposed during the simulation. In this case, each observation was identified
by a country, that is, those countries whose import needs were not being met due to the transformation of their trading partners into a failure status. This led to the construction of Eq.
11: $$\begin{array}{l}NS_{it}/SR_{it} = \beta _0 + \beta _1In{{{\hbox{ - }}}}ratio_{it} + \beta _2Out\, {\hbox{-}}\, ratio_{it} + \beta _3Betweenness_{it}\\ \qquad\qquad\qquad + \,\beta
_4F_{it} + \beta _5N_{it} + \beta _6Europe_i + \beta _7Africa_i + \beta _8Asia_i + \beta _9Oceania_i\\ \qquad\qquad\qquad + \,\beta _{10}Year + \varepsilon _{it}\end{array}$$ (11) In this
model, the explained variables _NS__it_ and _SR__it_ denote the total supply shocks (in metric tonnes) of reduced imports and its ratio to domestic demand, respectively, to country _i_ at
all time steps of the shock propagation in year _t_ of the simulation. Since the distribution of the explained variables is heavily right-skewed and has extreme value problems, but the
variables have a large number of zero values and cannot be directly log-transformed, we followed Cao and Chen (2022) in applying the inverse hyperbolic sine transformation to the explained
variables. The explanatory variables \(In \,{\hbox{-}}\, {{{\mathrm{ratio}}}}_{{{{\mathrm{it}}}}}\), \(Out\,{\hbox{-}}\, {{{\mathrm{ratio}}}}_{{{{\mathrm{it}}}}}\) and _Betweenness__it_
represent the ratio of in-degree (number of import trade relationships) to in-strength (volume of imports), out-degree (number of export trade relationships) to out-strength (volume of
exports) and betweenness centrality (the number of times a country acts as an “intermediary”) for country _i_ in year _t_, respectively. Also, we used the ratio of closeness centrality to
strength centrality (\(Inclose \,{\hbox{-}}\, {{{\mathrm{ratio}}}}_{{{{\mathrm{it}}}}}\), \(Outclose \,{\hbox{-}}\, {{{\mathrm{ratio}}}}_{{{{\mathrm{it}}}}}\)) as an alternative indicator
for robustness testing. In addition, because betweenness centrality measures the role of the state as a “bridge”, some scholars have also used structural holes as a proxy variable for it in
related studies (Liu 2009; Shi et al. 2019). With reference to such practices, we conducted robustness tests using structural holes (Brokerageit) as a proxy for betweenness centrality
(\(Betweenness_{it}\)). \(N_{it}\) denotes the country’s network characteristics, including eigenvector centrality (Pagerankit) and transitivity (Clusteringit); \(F_{it}\) denotes country
attributes, including level of economic development (Log GDP), population size (Log people), import concentration (Import C2) calculated by the share of each country’s top two suppliers in
its total imports, and the number of trade agreements (RTA) a country has. Finally, we also controlled the geographical location in which the country is located. Considering the presence of
a large number of zeros in the explained variables with significant truncated tails and the assumption that zero and positive values follow the same data generating process, that is, the
same factors explain the results of zero and positive values, following Ahern et al. (2015), we used a panel Tobit model for regression analysis. At the same time, we also used a fixed
effects model as a robustness check, with regression around clustering of standard errors at the individual level. To further investigate the vulnerability of countries in response to
external trade shocks, we ranked countries according to the size of the supply shocks they faced in the simulation, with the smallest supply shock taking the value of 1 and taking the
logarithm of this, thus obtaining a continuous variable on the ranking of countries’ vulnerability. We regressed them using the same explanatory variables as in Eq. 11 to obtain Eq. 12:
$$\begin{array}{l}Ranking_{it} = \beta _0 + \beta _1In{{{\hbox{ - }}}}ratio_{it} + \beta _2Out \,{\hbox{-}}\, ratio_{it} + \beta _3Betweenness_{it}\\ \qquad\qquad\qquad + \,\beta _4F_{it} +
\beta _5N_{it} + \beta _6Europe_i + \beta _7Africa_i + \beta _8Asia_i + \beta _9Oceania_i\\ \qquad\qquad\qquad + \,\beta _{10}Year + \varepsilon _{it}\end{array}$$ (12) In this model, the
explained variable \(Ranking_{it}\) indicates the ranking of the supply shocks to country _i_ in year _t_ due to a reduction in imports, with larger numbers associated with greater
vulnerability. The explained variable can be considered as a continuous measure, so we used a fixed effects model with clustering of standard errors around the individual level. The
variables remain consistent with Eq. 11, except that the explained variable differ from Eq. 11. Table S7 presents the variable definitions. RESULTS RUSSIA AND UKRAINE ARE IMPORTANT
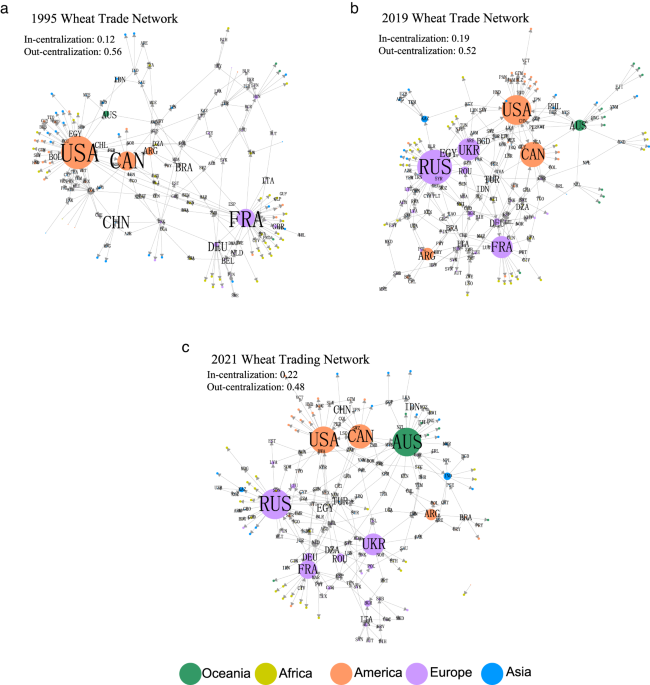
MULTIREGIONAL SUPPLIERS The backbone networks of the wheat, barley and maize trade were obtained and visualised by extracting the individual countries and their top-ranked import/export
relationships (Zhou et al. 2016; Liu et al. 2021). As shown in Figs. 1–3, among the backbone networks of the three grains, the trade status of Russia and Ukraine has been significantly
improved. Affected by the COVID-19 epidemic, the concentration of import trade has increased, reflecting that countries have increased the scale of imports for stability in the domestic
grain supply. In contrast, the trend towards multipolarity in export trade has strengthened further, with the hierarchical export structure of the maize trade network significantly stronger
than that of the wheat and barley trade networks. In particular, the size of Australia’s wheat and barley export trade has risen rapidly, while other major exporters, including Russia and
Ukraine, have seen their export trade rise in volume and decline in share. Specifically, as shown in Fig. 1, the wheat trade network pattern has gradually evolved from an unbalanced pattern
with the United States as the absolute centre flanked by Canada and France to a balanced pattern with Russia as the largest centre and Canada, the United States, France and Ukraine all
related in a multicore cluster. During the COVID-19 epidemic, middle-income and low-income countries in Asia and Africa, such as China, Indonesia, Vietnam, Nigeria and Algeria, substantially
increased the quantity of wheat imports and became net importers of wheat. As shown in Fig. 4a, in 2016, the Russia exceeded the US in wheat export trade quantity for the first time. In
2018, Russia newly led the international wheat market as the top exporter in quantity of wheat. In 2021, the US was overtaken at the centre by Russia. In terms of the quantity of wheat
exports, Russia and Ukraine became the world’s first and fifth largest wheat exporters, accounting for 13.70% and 9.75% of global wheat exports, respectively. Russia and Ukraine are playing
an important role in the increasingly extensive wheat supply chain, as major suppliers of wheat to 77 countries in the African and Asian regions, with more diversified export destinations
(Figs. S1a and S2a). As shown in Fig. 2, the barley trade network pattern has gradually evolved from a decentralised and less nucleated pattern with France and Germany as absolute centres
and Canada and the United States as relative centres to a multicore agglomeration led by France and Australia and countries such as Ukraine, Russia and Argentina as regional centres. During
the COVID-19 epidemic, countries in West Asia, Southeast Asia and North Africa, such as China, Turkey, Tunisia, Vietnam and the Philippines, increased their barley imports in large
quantities. As shown in Fig. 4b, in 2008 and 2018, barley exports from Ukraine and Russia reached all-time highs, while in 2021, Russia and Ukraine became the fourth and third largest barley
exporters globally, accounting for 9.12% and 12.32%, respectively, of global barley exports. The extent of barley exports from Russia and Ukraine is relatively small compared to the wheat
trade. The export destinations of both countries are concentrated in the Asian region, with 28 countries, followed by the European region, with 15 countries (Figs. S1b and S2b). As shown in
Fig. 3, the maize trade network has evolved from a hierarchical and less nuclear pattern with the US as the absolute centre to a more nuclear and relatively balanced pattern led by the US,
complemented by Argentina, Ukraine and Brazil. During the COVID-19 epidemic, China, Egypt, Thailand, Korea, Mexico and other countries located in East Asia, Southeast Asia and Latin America
increased their maize imports in large quantities. As shown in Fig. 4c, the US maintained its leading position in maize exports. During development, Brazil, Argentina and Ukraine have
enabled the maize trade network to evolve into a relatively balanced, multilateral core of leaders, mitigating high levels of export concentrations. The outbreak of the COVID-19 epidemic
prompted a rapid increase in US maize exports and a return to dominance in the competitive market. In 2021, Ukraine ranked third in the world in maize exports with 24.55 million tonnes,
accounting for 12.32% of the export share. Ukraine has a relatively wide range of maize export destinations, mainly concentrated in Europe and Asia with 52 countries, collectively (Figs. S1c
and S2c). LOWER MIDDLE–INCOME COUNTRIES RELY HEAVILY ON DIRECT IMPORTS FROM RUSSIA AND UKRAINE Figures 5–7 show the top twenty export trading partners of Russia and Ukraine in 1995, before
the outbreak of COVID-19 and after the outbreak of COVID-19, respectively. The final destinations of Russian and Ukrainian wheat and barley exports are located in West Asia, North Africa,
Southeast Asia and East Asia (see Figs. 5, 6), with upper middle–income countries in West Asia as well as Europe and East Asia mainly receiving maize exports from both countries (see Fig.
7). Affected by the COVID-19 epidemic, the trade quantity of wheat imported from Russia and Ukraine in West Asia, East Asia, Southeast Asia and North Africa decreased by an average of
10.05%. However, barley and maize imported from Russia and Ukraine in these areas have increased. In particular, in Southeast Asia, the trade quantity of maize imports from both countries
expanded 53 times, and the trade quantity of barley and maize imports from both countries increased by an average of 69.00% and 9.62% in East Asia and North Africa, respectively. Conversely,
the European region, which is on average more affluent, imported an average of 58.95% less grain from both countries. This suggests that the outbreak of the COVID-19 epidemic has increased
the dependence of LM countries located in the Asian and African regions on grain exports from both countries. Specifically, countries in West Asia and North Africa, such as Egypt, Turkey,
Indonesia and Yemen, import the largest amount of wheat from both countries. In 2021, Eritrea, Kazakhstan, Mongolia and Armenia imported more than 99% of their total wheat imports from both
countries, and more than 30% of the wheat imports of the 37 net importing countries in West Asia, East Africa and North Africa came from Russia and Ukraine, yet their national income per
capita (GNI per capita) averaged only US$3892.70. Lebanon, Yemen and Sri Lanka, which receive 78.51%, 44.25% and 8.03% of their wheat imports from Russia, are in danger of famine due to
adverse natural or man-made factors such as drought and conflict (Lang and McKee 2022; The Economist Group 2022), in the sense that a disruption of wheat supplies from Russia or Ukraine
would further increase the risk of food insecurity in these countries. China, Turkey, Saudi Arabia and Libya import the most barley from both countries. In 2021, countries such as Egypt,
Kazakhstan, Tajikistan and Armenia relied on Russia and Ukraine for more than 99% of their barley imports, and 13 net importing countries that imported more than 80% of their barley from
Russia and Ukraine had an average GNI per capita of only US$4700. Lebanon and Sri Lanka accounted for 81.92% and 92.64%, respectively, of imported barley from both countries. China, Spain,
the Netherlands, South Korea and Egypt import the most maize from both countries. In 2021, Georgia, Mongolia, Armenia and Azerbaijan received over 95% of their maize imports from Russia and
Ukraine, but fewer net importers were overly dependent on maize exports from the two countries, with seven countries representing lower middle–income areas in West Asia, Eastern Europe and
North Africa with GNI per capita averaged at US$5658.57. Lebanon and Sri Lanka accounted for 39.37% and 10.64%, respectively, of imported maize from the two countries. TRADE SHOCKS BREAKDOWN
NETWORK TOPOLOGY To assess the impact of Russian and Ukrainian restrictions on the export of wheat, barley and maize on global trade networks, we simulated the cascading failure process
under shock propagation. The entire process of shock propagation reflects a higher-order indirect dependence between countries. During simulation, the failure of nodes can undermine the
integrity and connectivity of the trade network. Figure 8 shows that the failure triggered by trade shocks will end at some point. At this point, the connectivity of the network decreases,
and certain regional communities may be broken up into blocs, with the extent of this disruption increasing significantly in the post-2011, 2013 and 2009 wheat, barley and maize trade
networks, respectively, until the gap in topological indicators between the original network and the posttrade shock network reaches its highest point in 2021, 2017 and 2016. As a result of
the COVID-19 epidemic, the decline in connectivity in the barley and maize trade networks was reduced, and the decline in connectivity in the wheat trade network increased, indicating
increased resilience in the wheat trade system. This is consistent with the trend in the number of failed countries and the fact that national suppliers with a large share of exports bear
more of the import demand (Fig. S3). For global trade networks with scale-free properties (Tables S1–S3), these major national suppliers are important for maintaining the resilience of the
network. We used several indicators to measure the connectivity and integrity of the network (Fair et al. 2017; Gao et al. 2016; Gutiérrez-Moya et al. 2021). The number of network edges,
trade volume and global efficiency of the wheat trade network all show a steady and then rapid decline (see Fig. 8a, c, h). In the barley and maize trade networks, all three indicators show
a flat upwards trend, and the reciprocity of the three trade networks is less affected by posttrade shocks (see Fig. 8b). Scale-free properties make the global wheat, barley and maize trade
network vulnerable to specific attacks, because of the high degree of heterogeneity. Removing the core exporting countries leads to a rapid increase in network diameter, as evidenced by the
fact that the clustering coefficients and the share of giant connected branches for each of the three trade networks experience a rapid decline after 2009 (see Fig. 8f, g). Similarly, the
negative assortativity coefficients all experience a small decline after trade shocks (see Fig. 8d), and the average path length between countries gradually increases (see Fig. 8e), with a
significant difference from the original network. Compared to 2019, the postshock barley and maize trade networks show a trend towards a narrower difference in each network indicator than
the original trade network, while the wheat trade network performs the opposite, with an increase in average path length, a decrease in clustering and a decrease in maximum connected piece
size. This suggests that the speed of shock propagation in the wheat trade will become slower and that the low level of aggregation makes shock dispersion less likely (Fair et al. 2017). In
other words, there is an increase in network resilience and resilience to risk, a result that remains consistent with Gutiérrez-Moya et al. (2021). IMPORT DEMAND DEPENDENCE FACED BY
EXPORTING COUNTRIES Figures 9–11 show the countries that faced import demand along the chain during the cascade failure of the wheat, barley and maize trade networks and the positive shocks
they suffered, which we measured in terms of trade quantity (in metric tonnes). Here, we present results for 1995, before the outbreak of COVID-19 (average of 2018 and 2019), and after the
outbreak of COVID-19 (average of 2020 and 2021). In Supplementary Figs. 4–6, we show the exposure to shocks in other years. Within the wheat trade network, the core exporting countries, such
as the US, France, Argentina and Australia, located in North America and Central and Western Europe compensated for the reduction in supply caused by a large number of trade shocks (see
Fig. 9). After the outbreak of the COVID-19 epidemic, the transferred import demand rose by 24.19% overall; Oceania faced a 95.97% rise in import demand, and North America faced a 19.66%
fall in import demand, with most European and American countries set to bear the most import demand as global centres of wheat production and export. Within the barley trade network, the
core exporting countries in Western and Southern Europe and South America, such as Argentina, Romania, France and Germany, compensated for the reduced supply caused by the large trade shocks
(see Fig. 10). After the outbreak of the COVID-19 epidemic, the transferred import demand decreased by 7.46% overall, with Western Europe and South America facing 52.41% and 62.94% drops in
import demand, and Southern Europe and Oceania facing 97.70% and 96.24% rises in import demand. Australia and Canada faced the largest increase in import demand compared to the pre-COVID-19
period in the cascade failure process. Within the maize trade network, the core exporting countries in South America, North America and Southern Europe, such as the US, Brazil, Argentina
and France, compensated for the reduction in supply caused by a large number of trade shocks (see Fig. 11). Maize is more closely traded within the African region than wheat and barley, with
South Africa becoming the main export centre for maize. After the outbreak of the COVID-19 epidemic, the transferred import demand decreased by 21.37% overall; South America and Southern
European countries faced 50.88% and 34.98% drops in import demand, and North America faced 98.36% rises in import demand, and the United States faced greater pressure to export maize. From a
modelling perspective, according to the dynamics of shock propagation model Eqs. (6) and (7), the redistributed trade flows from importing countries are transmitted to other exporting
countries along existing trade links, and the distribution of this trade flow is positively proportional to the GDP per capita of the exporting country and positively proportional to its
importance relative to the importing country (measured as a share of imports). This mechanism has a strong impact on relatively affluent regional exporters, such as Eastern and Southern
European countries such as Moldova, Romania and Bulgaria. They can easily become trade failures due to supply deficits, playing the role of “intermediaries” who continue to propagate shocks.
In other words, countries with large export quantities and widely distributed trading partners are preferred as import channels, while subcore exporting countries with concentrated export
destinations do not rank among the world’s top importers and producers and are relatively affluent countries that face significant pressure to increase their exports. A closer look shows
that Russia and Ukraine have a high overlap with the major export regions of the subcore exporting countries. In general, a country’s position in the network and the quantity of wheat,
barley and maize exports determine a country’s ability to withstand import demand shocks from trading partners and to influence third countries. Therefore, once these core exporting
countries restrict their exports because of cumulative shocks, it will further expand the number and severity of countries with an insecure wheat, barley and maize supply. CONFLICT CAUSES A
WORLDWIDE DECLINE IN GRAIN SUPPLIES To assess the supply gap for importing countries with reduced imports under the impact of the Russia-Ukraine conflict, we calculated at each time step the
countries whose shifting import demand causes other exporters to fail and the negative shocks suffered from reduced imports. Here, we used the reduction in imports in metric tonnes to
measure the extent of negative shocks to obtain an indicator of a country’s overall exposure to the diffusion of grain trade shocks. We present results for 1995, before the COVID-19 outbreak
(average of 2018 and 2019), and after the COVID-19 outbreak (average of 2020 and 2021). In Supplementary Figs. 7–9, we show the exposure to shocks in other years. In the first step of the
simulation, the trade shock affects the direct trading partners of the two countries directly, but after that, the shock also affects countries that do not import wheat, barley and maize
directly from Russia and Ukraine. For example, after the COVID-19 outbreak, the shock to the wheat trade network was transmitted to countries in South and Central America such as Chile,
Colombia and Cuba; the shock to the barley trade network was transmitted to countries in the European region such as the UK, Greece and Portugal. These countries that do not import grain
directly from Russia and Ukraine also bear a larger part of the shock. Figure 12 shows that the most significant supply shortages in the wheat trade network are concentrated in West Asia,
North Africa and Southeast Asia, such as Egypt, Turkey, Sudan, Lebanon and Indonesia. Reduced imports in West Asia originate in reduced exports from Southern and Eastern European countries
such as Moldova, Lithuania and Romania; reduced imports in North Africa originate in Southern European countries such as Romania and Bulgaria, and Southeast Asia relies heavily on Argentina,
Canada and Australia. The supply shortage faced by East and Southeast Asia will expand by 86.30% and 79.80%, respectively, as a result of the epidemic. Countries in Africa and Asia facing
supply shortages bear 40.75% and 53.15% of the supply shocks, with countries in West Asia and North Africa bearing the brunt of the risk of supply shortages, with 43.56% and 33.10% of the
demand gap not compensated respectively. Figure 13 shows that the most significant supply shortages in the barley trade network are concentrated in West Asia and North Africa, such as Saudi
Arabia, Turkey, Libya, Tunisia and Israel, with reduced imports in West Asia originating in South American and Southern European countries such as Argentina and Romania and shortages in
North African countries coming from Romania and Bulgaria. Countries in North Africa and Central Europe face expanded supply shortages of 71.58% and 43.59%, respectively, as a result of the
epidemic. Africa and Asia bear 33.48% and 66.14% of the supply shocks, with countries in Western Asia, North Africa and Southern Europe bearing the brunt of the risk of supply shortages,
with 66.14%, 33.48% and 13.82% of the demand gap not compensated respectively. Figure 14 shows that the most serious supply shortages in the maize trade are concentrated in Iran as well as
in Europe and East Asia, such as Lithuania, Italy, Denmark, China and South Korea, with supply shortage shocks in Europe due to reduced imports from regional exporting countries, such as
Bulgaria, Hungary and Latvia, and in East Asia from multiregional exporting countries, such as Bulgaria, Myanmar and Paraguay. As a result of the epidemic, North Africa and Western Europe
will face a significant increase in supply shortages, as they are unable to disperse the trade shocks of reduced imports from failed exporters, with the European region bearing 93.79% of the
supply shocks. Southern and Eastern Europe bear the brunt of the risk of supply shortages, with 46.08% and 25.18% of the demand gap not compensated, respectively. We further analysed the
specific countries most at risk of food insecurity as a result of the ongoing conflict. Table 1 reports the 10 countries with the highest supply shocks (in metric tonnes) in terms of
burdened import reductions during the simulation. Similar to the situation in Figs. 12–14, the number of countries affected in all three grain trade networks increased over time, with the
largest increase in the wheat trade network at 39 times. Although poor countries with large populations may not necessarily bear the largest drop in imports, they are more likely to bear the
most severe impact considering their vulnerability when shocks are transmitted to the interior of the country. Countries in North Africa and West Asia, such as Egypt, Libya, Turkey, Lebanon
and Israel, were negatively affected by reduced supplies of wheat, barley and maize at the same time. The simulations show that, on average, Egypt, Turkey, Brazil and Nigeria bear the most
negative wheat shocks in terms of volume, while countries such as Lebanon, Libya, Israel and Latvia bear shocks equivalent to more than 45% of domestic wheat supply in terms of the
proportion of domestic demand covered. Countries such as Indonesia, Egypt, Nigeria, Sudan and Lebanon are the most vulnerable when shocks are transmitted, as the domestic population of those
in poverty are affected. This suggests that countries with high import declines do not necessarily experience a high intensity of domestic shocks, and accordingly, the countries most
affected by domestic poverty are those that are already characterized as small and poor. Countries in West Asia and North Africa, such as Saudi Arabia, Turkey, Libya and Lebanon bear the
most negative barley shocks in terms of volume, with Libya, Israel, Lebanon and Jordan bearing the equivalent of more than 30% of domestic barley supply. In terms of the number of poor
people affected, the scope and extent of the impact is less than that of the wheat trade, with Egypt, Libya, Jordan, Lebanon and Tunisia being the most vulnerable. The vulnerability of the
countries affected by the maize trade network is relatively small and clustered in the European region. On average, Italy, the Netherlands, Iran and Latvia bear the most supply shocks to
maize in terms of volume, and Latvia and Estonia bear shocks equivalent to more than 20% of domestic maize supply. The countries in Europe at a high economic level bear a lower share of
supply shocks to domestic demand, averaging just over 2% of their domestic demand. In terms of the number of impoverished people affected, Latvia, Iran and Libya are the most vulnerable, but
their values are relatively low. These countries, whose economies are characterised by low levels of affluence and food security, are on the periphery of the world trading system. As a
result, they are heavily dependent on grain imports and will seek to transfer grain trade shocks to their trading partners. Although these countries have a large trade quantity in imported
grain, they do not have a high number of import trade links and are relatively homogenous in their import sources, so they are unable to take full advantage of international trade. The
shifted import demand of these importing countries will rapidly compress the domestic supply space of their direct trading partners, leading to supply deficits in those trading partners and
consequent failure, spilling over to other countries in the region. A similar pattern was observed across countries exposed to supply shocks, whereby the location of the node in the network
and the volume of grain trade determined the country’s ability to pass on and receive shocks to trading partners or third countries. Therefore, to help these peripheral countries facing the
most severe supply shocks, from an international perspective, an international emergency fund or specialist aid organisation could be established. For the country itself, the best solution
is to anticipate the potential reduction in imports based on available trade information and to pool grain reserves accordingly, which is where this study makes practical sense. SCENARIO
ANALYSIS To explore a broad range of future uncertainties and corresponding realities, and to shed light on the level of food insecurity that countries may face, we conducted a series of
sensitivity analyses based on different scenarios. The results of the analyses obtained are consistent with the reference scenario S0, whereby the large grain supplying countries located in
the Americas and Europe regions face the highest import demand and countries in the Africa and Asia regions are exposed to severe supply shortages. Since the outbreak of the Russia-Ukraine
conflict, Ukrainian ports have experienced closures (circulation has now been restored to some extent, but not fully liberalised), making it logistically difficult to move goods in and out
of the Black Sea region (Benton 2022; WFP 2022; Lang and McKee 2022) and the introduction of export licensing requirements for some grain (Human Rights Watch 2022). The conflict in Ukraine
has negatively affected normal agricultural activity within the country (Perdana et al. 2022). For Russia, there is uncertainty about the impact of the international sanctions imposed on its
own grain exports (FAO 2022b, 2022c, 2022e). As a result, Russia’s grain exports are less restricted and in a sense in a proactive position under the Russia-Ukraine conflict (FAO 2022b,
2022e; Goldgeier and Itzkowitz Shifrinson 2020; Kupriyanov 2022). On this basis, we referred to You et al. (2021), Burkholz and Schweitzer (2019) and Marchand et al. (2016) for setting up
shock scenarios using proportional shocks, defining different scenarios by varying the magnitude of Russia’s grain export reduction in equal proportions. Using the previous analysis of both
Russia and Ukraine stop exporting grain (100% reduction in exports) as a reference scenario (S0), four other scenarios were analysed, in which the trade in grain exports from Russia is
reduced by 20%, 40%, 60% and 80% and the trade in grain exports from Ukraine is always zero (S-20,-100, S-40,-100, S-60,-100, S-80,-100). We estimated the cascade failures and country
exposure under the diffusion of trade shocks using the same methodology as in the previous section. The estimation results are shown in Fig. 15 and Table 2. From the best scenario
(S-20,-100) to the worst scenario (S-80,-100), the gap in the number of failed countries in the wheat, barley and maize trade networks began to become progressively more pronounced after
2009, 2002 and 2016, respectively. The average annual redistributed import demand faced by exporting countries for wheat, barley and maize increased from 24,887,600 tonnes to 41,575,100
tonnes, 459,500 tonnes to 6,600,000 tonnes and 542,700 tonnes to 1,256,500 tonnes, respectively, and the average annual supply shortfall due to reduced imports of wheat, barley and maize
increased from 3,867,700 tonnes to 8,263,400 tonnes, 542,700 tonnes to 1,256,500 tonnes and 903,100 tonnes to 1,113,100 tonnes respectively. In all scenario analyses, the Americas and Europe
regions experience the largest increase in exports, compared to Africa and Asia, which face supply shortages due to reduced imports (Table S4). Table 2 shows that within the wheat trade
network, North African and West Asian countries such as Egypt, Turkey, Indonesia and Nigeria experienced the most supply shortages. In the worst case scenario (S-80,-100), on average 17.23%
and 16.93% of imports are not met annually in both regions, triggering severe shortages in wheat supply that threaten the caloric availability and nutritional intake of 69.40% of the
population. Within the barley trade network, West Asian and North African countries such as Turkey, Libya, Tunisia and Israel experienced the most severe supply shortages (Table S5). In the
worst case scenario (S-80,-100), on average 16.91% and 14.03% of the imports of the two regions are not met each year and the population of these countries facing supply shortages due to
reduced barley imports represents 51.15% of the world population. Within the maize trade network, European and East Asian countries such as Italy, China, the Netherlands and Korea
experienced the most severe supply shortages (Table S6). In the worst case scenario (S-80,-100), on average 7.66% and 6.50% of the imports of the two regions are not met each year, and the
population of these countries facing supply shortages due to reduced maize imports represents 7.88% of the world population. Therefore, international agencies and major grain-producing
countries should take the initiative to provide grain aid to food-insecure countries, including measures such as providing grain, building local capacity (Hendrix and Brinkman 2013) and
restoring agricultural production, to effectively prevent grain crises and avoid these worst-case scenarios. REGRESSION ANALYSIS We also carried out a series of regression analyses on panel
data generated from the simulation results of the wheat, barley and maize trade networks. The impact of country attributes such as network topology, population, level of economic development
and world region on their vulnerability to shocks is examined. We first tested the mechanism by which country attributes affect their exposure to a supply shock (in metric tonnes) and the
share of that shock in domestic demand, regressing Eq. 11. The regression results for the wheat trade network are shown in Table 3, while those for the barley and maize trade networks are
shown in Tables S8 and S10. Columns (1)-(4) in Table 3 are regression results for the fixed effects model, and Columns (5)-(8) are regression results for the Tobit model. A closer look at
the regression results reveals that the sign and significance of the coefficients obtained for each variable remain largely consistent across different regression strategies for each of the
three grain trades. It is noteworthy that the coefficients of the In-ratio on the supply shocks burdened by a country and the proportion of those shocks felt in domestic demand are both
significantly negatively correlated at the 0.01 level in both the wheat and barley trade networks, with the sign and significance of the coefficients remaining unchanged when the
Inclose-ratio is used for robustness analysis. The In-ratio variable plays no significant role in the maize trade. Thus, all else being equal, a country with a small number of import trading
partners or a large distance from them but with a large volume of import trade can result in an overconcentration of imports. When the country diversifies its own imports, the shock is
overly concentrated on a few trading partners, which increases the damage and export pressure on each trading partner, causing that trading partner to fail and leading to stronger supply
shocks of its own to experience. This is consistent with our simulation results. However, as Russia and Ukraine have less influence in the maize trade network compared to the other two grain
markets and are mostly developed European countries that face maize supply shocks, these wealthier countries have relatively diversified import channels. Therefore, the diversification of
the country’s import channels is an effective measure to protect itself from negative impacts. The coefficient of the Out-ratio on a country’s exposure to the supply shocks and the
proportion of that shocks in domestic demand is not significant. The coefficient of Betweenness on the supply shocks faced by the country and the proportion of those shocks in domestic
demand is negative but not significant. However, different results are obtained when we used the variable brokerage instead of the variable betweenness; that is, in either model, the
coefficient of brokerage on a country’s exposure to a supply shock and the proportion of that shock in domestic demand are both significantly positively correlated at the 0.01 level, with
the significance being most pronounced in the wheat and barley trade but weakening in the maize trade. Other things being equal, when a country is often on the shortest path of other
countries’ trade links, it indicates that they are closer to the geometric centre of the network, and therefore, their extensive trade reach means that they have more space to spread or pass
on the supply shocks. However, when countries are positioned as “gaps” between unconnected individuals, that is, open triad configurations, the small number of interconnections that exist
in these sparse clusters leaves the country with a single channel for dispersing shocks, and a trade shock is more likely to have a disproportionately negative impact on such individual
countries. Therefore, countries should appropriately increase the intensity of the trade clusters in which they are located to benefit from the diffusion of shocks. The coefficient of
PageRank on a country’s exposure to a supply shocks in wheat, barley and maize and the proportion of those shocks in domestic demand is significantly positively correlated at the 0.05 level.
This means that the higher the centrality of a country’s eigenvector, the more it tends to trade with other hub trading partners with high degree centrality. However, these hub trading
partners are more likely to face trade shocks transmitted from other countries and become failures due to the “preference dependency” effect. As a result, trade with these hub countries is
more likely to be forced to receive supply shocks in the form of declining exports from the hub trading partners. There is no significant correlation between the country’s local transitivity
and the supply shocks and the proportion of those shocks in domestic demand. The coefficient of the country’s import concentration (share from the two most important import trading
partners, C2) on its exposure to supply shocks to wheat, barley and maize and the proportion of those shocks in domestic demand is significantly negatively correlated at the 0.01 level,
indicating that the intensity of supply shocks can be effectively reduced when a country chooses a small number of trading partners as its own major grain suppliers. There is no significant
correlation between a country’s GDP and its exposure to wheat supply shocks. The coefficient of the country’s population on its exposure to wheat supply shocks is significantly positive. In
the barley and maize trade, a country’s economic and demographic attributes play no role in the supply shocks it faces. This illustrates the greater likelihood of the Russia–Ukraine conflict
plunging the global wheat market into crisis. Countries with large populations are more deeply involved in international trade, as they often need to import more wheat to meet domestic
demand. The estimated coefficients of the number of trade agreements a country has signed was not significant for wheat and barley trade but has a significant positive contribution to their
exposure to maize supply shocks. In regard to the geographical location of countries, the results of the regressions yield that in the wheat and barley trade, countries in Asia and Africa
are more vulnerable to supply shocks. In the maize trade, European countries have the most significant positive correlation when facing maize supply shocks, with a weakening positive
correlation for African countries, in line with our simulation results. To further investigate the vulnerability of countries to supply shocks, we replaced the explained variable with the
ranking of the supply shocks to which the country was exposed during the year. We regressed Eq. 12. The results for the wheat trade are shown in Table 4, and the results for the barley trade
and the maize trade are shown in Tables S9 and S11. The regression results for the three types of grain trade show a difference in the RTA variable: there is a significant positive
correlation between the number of trade agreements a country has signed and its vulnerability to supply shocks. In the wheat trade regressions, the geographical location of the countries
shows some differences: in addition to countries located in Asia and Africa, countries located in Europe and Oceania also have significantly positive coefficients on vulnerability at the 0.1
and 0.05 levels respectively. However, the positive effect is weaker than for countries in Asia and Africa, as seen by the size of the coefficient. If we keep only those countries in the
top 50% of the sample with supply shocks, only countries located in Asia and Africa have a significantly positive coefficient on vulnerability. DISCUSSION OF THE RESULTS The negative impact
of the Russia–Ukraine conflict on food security, the stability of people’s lives and nutritional balance will be long-term, which could create a vicious circle of geopolitical conflicts and
hunger problems (Kemmerling et al. 2022; Martin-Shields and Stojetz 2019; Nature 2022). In the shadow of the Russia–Ukraine conflict, we explored the dual role of international grain trade
as a channel for dispersing external grain supply shocks and sharing domestic shocks with other countries, thereby triggering risk propagation. The simulation process was used to reveal all
the indirect effects of cascading failures of supply deficits in higher-order networks. To this end, we simulated shock propagation in the wheat, barley and maize trade networks for the
period 1995–2021. The simulations showed that supply shocks to wheat and barley from the Russia–Ukraine conflict are stronger and more widespread, in contrast to maize trade shocks that have
a stronger negative impact on rich countries in the European region. On average, as trade shocks spread through the network, countries with high economic levels are better able to withstand
external shocks from reduced imports, and LM countries located in Africa, the Middle East, Southeast Asia and Latin America are more likely to absorb shocks that cause supply shortages from
reduced grain imports. Thus, even though participation in the international grain trade can provide some protection against the negative impact of external shocks on the continued supply of
domestic grain, the role of this protection varies significantly according to geographical differences. Our findings are as follows: First, LM countries located in West Asia, East Africa
and North Africa are the most vulnerable to the threat of direct grain import shortages, with African and Asian countries such as Eritrea, Seychelles, Kazakhstan and Mongolia sourcing 99% of
their grain imports from Russia and Ukraine. Second, when a shock propagates through a trading network it causes a disruption to the overall topology of the network, and the corresponding
change in network resilience affects the ability to recover from the shock. We found that the topological connectivity of all three grain trade networks decreased after experiencing
cascading failures. Although the degree of damage caused by failures in the wheat trade network is the strongest among the three grain networks, considering the trend of the change in the
index, the connection density and distance of the wheat trade network decrease, which slows the diffusion of shocks in this network structure and increases network invulnerability and
elasticity. This suggests that the worst shocks do not imply reduced future resilience, which requires consideration of the scale of agricultural grain trade and countries’ trade policies.
Third, we considered the positive shocks caused by shifted import demand during the propagation of shocks. It is worth noting that the main suppliers of grain are similar: the USA, Canada,
France, Argentina and Brazil are the main global exporters that will face the largest proportion of import demand from trade shocks, with Australia facing a larger increase in import demand
following the outbreak of COVID-19. Eastern and Southern European countries often play an “intermediary” role in the process of shock propagation. They export grain but do not rank among the
world’s top producers and importers and tend to be at the secondary tier of the export hierarchy in trade networks, maintaining the balance of trade between large exporters and importers
within the same region. When import demand from importing countries shifts from large exporting countries to these intermediary countries, the domestic supply space of the intermediary
countries is compressed and transformed into a state of failure, becoming a key node for the propagation of shocks. Fourth, we quantified the cascading failure mechanisms generated by
countrys’ grain supply deficit under the initial shock triggered by the Russia–Ukraine conflict. We identified wheat trade as the most vulnerable to trade shocks from cascading failures. Due
to growing population numbers, countries in North Africa, West Asia and Eastern Europe, where grain imports continue to increase, are vulnerable to supply shortages from trade shocks in
wheat and barley, while countries in Europe and East Asia are vulnerable to supply shortages from trade shocks in maize. Considering the impact of the COVID-19 epidemic, supply shortages in
Southeast Asia, North Africa and Western Europe have increased. Due to the sparse trade links of countries at the periphery of the world trading system, LM countries located in North Africa
and Southeast Asia are not able to take full advantage of trade channels to alleviate the pressure of declining domestic grain supplies and end up suffering a large degree of supply shock
from reduced grain imports. Fifth, we also analysed and discussed how the nodal characteristics of countries in the grain trade network affect their average level of shock and vulnerability.
We found that the nodal characteristics of countries in the wheat and barley trade networks play a more pronounced role in supply shocks than in the maize trade. A single and concentrated
import channel would increase a country’s vulnerability to wheat and barley supply shocks. Being in a sparse network configuration that is not closely interconnected leads to countries that
cannot adequately diffuse the import demand gap they face, thus increasing their vulnerability to supply shocks. CONCLUSION AND POLICY RECOMMENDATIONS It is important to be able to display
and quantify these results. We pointed out that under the impact of the geopolitical conflict between Russia and Ukraine, the global grain trade supply system will become increasingly
vulnerable, with Australia and the major grain-producing and supplying countries in North America and Europe facing a “positive shock” in terms of import demand during the modelling process.
In other words, if they can ensure the normal operation of domestic supply, as the supply side, they may use the price mechanism to obtain huge benefits and significantly increase the cost
of import purchases, causing a “multiplier effect”. Countries with a strong dependence on imports remain exposed to negative supply risks that could easily cause political instability around
the world (Soffiantini 2020). As the source of the spread of shocks, exporting countries are key to ensuring a regular supply of grain and play an important role in maintaining the
stability of the global political landscape as well as the economic and trade system. Our findings bring some insights for global or regional export-centric countries. First, regional trade
agreements combined with regional grain emergency reserves can be a promising tool for stabilising grain supplies at low cost. The core exporting countries consolidate grain resources within
the same region through the development of additional trade agreement rules, thus reducing the pressure on subcore exporting countries within the same region. This reduces the likelihood of
trade failures in subcore exporting countries due to domestic supply deficits. Second, it makes full use of the bilateral economic, cultural and political relations between countries to
establish a solid closed triad of trade clusters. The regression analysis shows that there are multiple channels to dissipate trade shocks when countries have a nonstructural position in the
network (a non-structural hole configuration) with information redundancy. Accordingly, exporting countries can use their trade advantage to exploit the full potential for cooperation and
coordination in their trade clusters and to facilitate cooperative relationships between trading partners. Therefore, the information redundancy and market function redundancy of the network
topology are used to maintain strategic grain reserves. Third, the core exporting countries in the region should lead their trading partners to form strategic partnerships that are
cross-regional, diversified and high-frequency and constantly expand their trade borders. This measure has two benefits: first, it increases the paths and distances required for the
propagation of shocks, increasing the resilience of the grain trade network and enabling it to return to its original network efficiency and connectivity within a relatively short period of
time after a shock. Second, long trade distances cause shocks to be continuously absorbed during propagation, reducing the level of harm by the time they reach the interior of the cluster.
Fourth, countries with high export centrality should expand their agricultural production areas and invest more in research support for agricultural science and technology teams, thus
increasing domestic grain supply space. High centrality means that a country is at the core of the trading system’s exports. According to the “preference attachment” effect of the network
hub nodes, these highly centralised countries are more likely to receive shifts in import demand from importing countries within the same region. They are also in a better position to pass
on shocks to a wide range of partners when a supply deficit triggers a trade failure. Therefore, core exporting countries should upgrade their own grain production capacity. For importing
countries, decisions made now must aim not only to mitigate the immediate harm of conflict but also to build more resistant and resilient economic systems in the long term. The results of
the simulations and regression analysis provide some insights for countries to reduce the intensity of external shocks. First, countries should increase the agglomeration of the trade
clusters in which they are located, as there are multiple channels for countries to dissipate a shock when it reaches a cluster. Because of the strong interconnections within clusters,
shocks are unlikely to have a disproportionate impact on individual trading partners within them. Specifically, accession to bilateral or multilateral trade agreements can be used to
increase the density of trading partners and build a solid channel for the diffusion of shocks. Second, countries should avoid the overconcentration of grain import channels, increase the
number of import trading partners and diversify import channels to spread the shock. Specifically, countries can avoid disruptions in grain flows at one point in the global trading system by
encouraging the diversification of trade channels and supply chains and distribution networks towards more regional, or even localised, centres of production and consumption; such
decentralisation and systemic redundancy would be an effective shock avoidance measure. Third, countries should reduce their dependence on those countries that are hubs of trade exports (to
reduce their dependence on the main producing regions). Exclusive trading with these hub countries can lead to a decline in imports due to the loss of corresponding import channels following
trade failures in the hub country. As a result, countries are vulnerable to negative implications. Reducing the trade share of volatile exporters would be an effective measure. Fourth,
countries should rationalise the distribution of import trade volume among trading partners. While increasing the number of import trading partners, the country should select a small number
of trading partners as main suppliers and others as buffer channels. Such measures can put the country at the import centre of the network and thus grant the ability to connect different
parts of the network. At this point, shocks can spread further and gain more space to fill supply gaps. Fifth, countries should avoid large-scale monoculture by investing in alternative
crops and changing grain processing to take advantage of other nutrients. In addition, countries should invest in real-time monitoring and analysis of grain and input price volatility, as
well as country-specific assessments of the threats to food security caused by price shocks and trade restrictions. A prolonged and sustained Russia–Ukraine conflict would inevitably create
systemic risks to the global grain supply system. For a country, addressing grain accessibility and diversifying grain supplies will be key to helping it absorb shocks and remain resilient
in the face of conflict. Our study may be the first quantitative study of the network cascade response triggered by the trade flow shocks of the Russia–Ukraine conflict, using global grain
trade networks as a research tool. Our study showed that the international grain trade can help countries withstand external supply shocks when they maximise the diversification of national
grain suppliers due to the resilience of networks. Countries can minimise disruptions and ensure that international markets continue to function properly and that trade flows efficiently by
changing local network configurations in trade networks. Understanding how and to what extent the Russia–Ukraine conflict has caused shock damage to global grain trade networks is therefore
essential to stabilise global demand and guarantee food security. In addition, the ability of countries to anticipate potential import reductions based on available trade information and to
pool grain reserves accordingly is a low-cost solution to ensure that all grain trade network participants are protected from negative trade shocks, which is where the practical implications
of this study come in. This study has the following limitations. First, the analysis we conducted is grounded in a complex network science perspective, with research focusing on modelling
observed changes in international grain trade networks (annual trade data) in response to an external shock, such as a decrease in the quantity of exports from a particular country.
Therefore, the model was based on physical flows and mass conservation equations and does not take into account the effects of other exogenous factors, such as substitution effects,
agricultural price dynamics and other economic information. In our model, shortfalls in demand for wheat, barley and maize are considered to be independent, but in reality, shortfalls in one
grain type may be partially compensated for by other grain types. Second, price fluctuations affect the dynamics and outcome of cascading failures, as both supply and demand depend on
prices. The disruption of exports from a given country makes supply less than demand, which can trigger an increase in international grain prices. For exporting countries, alternative
suppliers are interested in expanding production or increasing exports; for importing countries, higher grain prices make domestic consumers interested in reducing exports to keep grain
prices low. Decisions made by agents with different utilities form a complex system of observable trade networks. Finally, we identified the propagation of trade shocks between countries
based on observed trade networks and country-level production data, rather than examining network-generating mechanisms and the future propagation of trade shocks triggered by the
Russia–Ukraine conflict. The computable general equilibrium (CGE) model, as a research method in applied economics, has seen rapid development and widespread use in assessing the various
economic impacts on social systems in response to external shocks. Therefore, as a prospect for future research, the coupling role between network models and economics models is the focus of
exploration. The use of network science methods to analyse the internal mechanisms of realistic economic factors acting on shock propagation and to form a refinement of the dynamic process
of shock propagation is our future direction of development to obtain the results of the integrated effects between the underlying mechanisms in complex systems. DATA AVAILABILITY The
datasets analysed during the current study are available in the Dataverse repository: https://doi.org/10.7910/DVN/KJB3OZ. These datasets include specific datasets generated in this study and
resources from the public domain. Resources in the public domain include the following sources: https://www.fao.org/faostat/en/#data/TM; https://www.fao.org/faostat/en/#data/SCL;
https://data.worldbank.org/indicator; https://rtais.wto.org/UI/PublicMaintainRTAHome.aspx. REFERENCES * Acemoglu D, Carvalho VM, Ozdaglar A et al. (2012) The network origins of aggregate
fluctuations. Econometrica 80(5):1977–2016. https://doi.org/10.3982/ECTA9623 Article MathSciNet MATH Google Scholar * Ahern KR, Daminelli D, Fracassi C (2015) Lost in translation? The
effect of cultural values on mergers around the world. J financ econ 117(1):165–189. https://doi.org/10.2139/ssrn.1545514 Article Google Scholar * Allen F, Gale D (2000) Financial
contagion. J Polit Econ 108(1):1–33. https://doi.org/10.1086/262109 Article Google Scholar * Battisti DS, Naylor RL (2009) Historical warnings of future food insecurity with unprecedented
seasonal heat. Science 323(5911):240–244. https://doi.org/10.1126/science.1164363 Article CAS PubMed Google Scholar * Ben Hassen T, El Bilali H (2022) Impacts of the Russia-Ukraine
conflict on global food security: towards more sustainable and resilient grain systems? Foods 11(15):2301. https://doi.org/10.3390/foods11152301 Article CAS PubMed PubMed Central Google
Scholar * Benton T, Froggatt A, Wellesley L et al. (2022) _The Ukraine war and threats to food and energy security: Cascading risks from rising prices and supply disruptions_. Chatham House
London, UK * Berazneva J, Lee DR (2013) Explaining the African food riots of 2007–2008: An empirical analysis. Food Policy 39(4):28–39. https://doi.org/10.1016/j.foodpol.2012.12.007 Article
Google Scholar * Bollobás B, Riordan O (2011) Sparse graphs: metrics and random models. Random Struct Algor 39(1):1–38. https://doi.org/10.1002/rsa.20334 Article MathSciNet MATH Google
Scholar * Bramoullé Y, Galeotti A, Rogers B et al. (2016) Networks, Shocks, and Systemic Risk. Eur Econ Rev 148(10):104213. https://doi.org/10.2139/ssrn.2560015 Article Google Scholar *
Buldyrev SV, Parshani R, Paul G et al. (2010) Catastrophic cascade of failures in interdependent networks. Nature 464(7291):1025–1028. https://doi.org/10.1038/nature08932 Article ADS CAS
PubMed Google Scholar * Burkholz R, Herrmann HJ, Schweitzer F (2018) Explicit size distributions of failure cascades redefine systemic risk on finite networks. Sci Rep 8(1):6878.
https://doi.org/10.1038/s41598-018-25211-3 Article ADS CAS PubMed PubMed Central Google Scholar * Burkholz R, Schweitzer F (2019) International crop trade networks: The impact of
shocks and cascades. Environ Res Lett 14(11):114013. https://doi.org/10.1088/1748-9326/ab4864 Article ADS Google Scholar * Callaway DS, Newman ME, Strogatz SH et al. (2000) Network
robustness and fragility: Percolation on random graphs. Phys Rev Lett 85(25):5468. https://doi.org/10.1103/PhysRevLett.85.5468 Article ADS CAS PubMed Google Scholar * Cao Y, Chen S
(2022) Rebel on the canal: Disrupted trade access and social conflict in china, 1650–1911. Am Econ Rev 112(5):1555–1590. https://doi.org/10.1257/aer.20201283 Article Google Scholar *
Contreras MGA, Fagiolo G (2014) Propagation of economic shocks in input-output networks: A cross-country analysis. Phys Rev E 90(6):062812. https://doi.org/10.1103/PhysRevE.90.062812 Article
ADS CAS Google Scholar * COVID-19 Food Trade Policy Tracker. https://www.ifpri.org/project/covid-19-food-trade-policy-tracker. Accessed 26 December 2022 * D’Amour CB, Wenz L, Kalkuhl M
et al. (2016) Teleconnected food supply shocks. Environ Res Lett 11(3):035007. https://doi.org/10.1088/1748-9326/11/3/035007 Article ADS Google Scholar * Dobson I, Carreras BA, Newman DE
(2005) A loading-dependent model of probabilistic cascading failure. Probab Eng Inform Sc 19(1):15–32. https://doi.org/10.1017/S0269964805050023 Article MathSciNet MATH Google Scholar *
D’Odorico P, Carr JA, Laio F et al. (2014) Feeding humanity through global food trade. Earths Future 2(9):458–469. https://doi.org/10.1002/2014EF000250 Article ADS Google Scholar * Dueñas
M, Campi M, Olmos LE (2021) Changes in mobility and socioeconomic conditions during the COVID-19 outbreak. Humanit Soc Sci Commun 8(1). https://doi.org/10.1057/s41599-021-00775-0 * Dupas
MC, Halloy J, Chatzimpiros P (2022) Power law scaling and country-level centralization of global agricultural production and trade. Environ Res Lett 17(3):034022.
https://doi.org/10.1088/1748-9326/ac54ca Article ADS Google Scholar * Engvild KC (2003) A review of the risks of sudden global cooling and its effects on agriculture. Agr Forest Meteorol
115(3-4):127–137. https://doi.org/10.1016/S0168-1923(02)00253-8 Article ADS Google Scholar * Fair KR, Bauch CT, Anand M (2017) Dynamics of the global wheat trade network and resilience to
shocks. Sci Rep 7(1):7177. https://doi.org/10.1038/s41598-017-07202-y Article ADS CAS PubMed PubMed Central Google Scholar * Field S (2016) The financialization of food and the
2008-2011 food price spikes. Environ Plan A 48(11):2272–2290. https://doi.org/10.1177/0308518X16658476 Article Google Scholar * Food and Agriculture Organization (2022a) Food Balance
Sheets. http://www.fao.org * Food and Agriculture Organization (2022b) Assessing investment needs in Ukraine’s agricultural reconstruction and recovery.
https://www.fao.org/3/cb9450en/cb9450en.pdf. Accessed 25 Jul 2022 * Food and Agriculture Organization (2022c) Response to the Ukraine Crisis: Social Protection for food security and
Nutrition. https://www.fao.org/3/cb9448en/cb9448en.pdf. Accessed 25 Jul 2022 * Food and Agriculture Organization (2022d) Technical briefing to FAO members on the impact of COVID-19 and the
war in Ukraine on the outlook for food security and nutrition. https://www.fao.org/director-general/speeches/detail/en/c/1480598/ Accessed 25 Jul 2022 * Food and Agriculture Organization
(2022e) The importance of Ukraine and the Russian Federation for global agricultural markets and the risks associated with the current conflict.
https://www.fao.org/newsroom/briefing-notes-detail/Info-Note-Ukraine-Russian-Federation/en. Accessed 25 Jul 2022 * Food Security Portal. Food and Fertilizer Export Restrictions Tracker.
Available online: https://www.foodecurityportal.org/tools/COVID-19-food-trade-policy-tracker. Accessed 25 Jul 2022 * Fraser ED, Simelton E, Termansen M et al. (2013) “Vulnerability
hotspots”: Integrating socio-economic and hydrological models to identify where cereal production may decline in the future due to climate change induced drought. Agric For Meteorol
170(15):195–205. https://doi.org/10.1016/j.agrformet.2012.04.008 Article ADS Google Scholar * Gai P, Kapadia S (2010) Contagion in financial networks. Proc Math Phys Eng Sci
466(2120):2401–2423. https://doi.org/10.1098/rspa.2009.0410 Article MathSciNet MATH Google Scholar * Gao J, Barzel B, Barabási AL (2016) Universal resilience patterns in complex
networks. Nature 530(7590):307–312. https://doi.org/10.1038/nature16948 Article ADS CAS PubMed Google Scholar * García-Dorado SC, Cornselsen L, Smith R et al. (2019) Economic
globalization, nutrition and health: a review of quantitative evidence. Glob Health 15(1):1–19. https://doi.org/10.1186/s12992-019-0456-z Article Google Scholar * Gephart JA, Rovenskaya E,
Dieckmann U et al. (2016) Vulnerability to shocks in the global seagrain trade network. Environ Res Lett 11(3):035008. https://doi.org/10.1088/1748-9326/11/3/035008 Article ADS CAS
Google Scholar * Glauber J, Laborde D, Mamun A (2022) From bad to worse: How Russia-Ukraine conflict-related export restrictions exacerbate global food insecurity. IFPRI blog series: high
grain/fertiliser prices and war in Ukraine * Goldgeier J, Itzkowitz Shifrinson JR (2020) Evaluating NATO enlargement: scholarly debates, policy implications, and roads not taken. Int J Press
Polit 57(3):291–321. https://doi.org/10.1057/s41311-020-00243-7 Article Google Scholar * Grassia M, Mangioni G, Schiavo S et al. (2022) Insights into countries’ exposure and vulnerability
to food trade shocks from network-based simulations. Sci Rep 12(1):4644. https://doi.org/10.1038/s41598-022-08419-2 Article ADS CAS PubMed PubMed Central Google Scholar *
Gutiérrez-Moya E, Adenso-Díaz B, Lozano S (2021) Analysis and vulnerability of the international wheat trade network. Food Secur 13(11):113–128. https://doi.org/10.1007/s12571-020-01117-9
Article PubMed Google Scholar * Helbing D (2013) Globally networked risks and how to respond. Nature 497(7447):51–59 Article ADS CAS PubMed Google Scholar * Hendrix C, Brinkman HJ
(2013) food insecurity and Conflict Dynamics: Causal Linkages and Complex Feedbacks. Stabil Int J Secur Dev 2(2):1–18 Google Scholar * Human Rights Watch. Russia-Ukraine conflict. Available
online: https://www.hrw.org/tag/russia-ukraine-war?promo=tag. Accessed 6 June 2022 * Kemmerling B, Schetter C, Wirkus L (2022) The logics of war and food (in) security. Glob Food Sec
33(3):100634. https://doi.org/10.1016/j.gfs.2022.100634 Article Google Scholar * Kinne BJ (2013) Network dynamics and the evolution of international cooperation. Am Polit Sci Rev
107(4):766–785. https://doi.org/10.1017/S0003055413000440 Article Google Scholar * Kummu M, Kinnunen P, Lehikoinen E et al. (2020) Interplay of trade and food system resilience: Gains on
supply diversity over time at the cost of trade independency. Glob Food Sec 24(3):100360. https://doi.org/10.1016/j.gfs.2020.100360 Article Google Scholar * Kupriyanov AV (2022) Cold war
as a special type of conflict: A strategic sketch. Russ Glob Aff 20(4):78–92. https://eng.globalaffairs.ru/articles/strategic-sketch/ Article Google Scholar * Lang T, McKee M (2022) The
reinvasion of Ukraine threatens global food supplies. Bmj-Brit Med J 376(3):0676. https://doi.org/10.1136/bmj.o676 Article Google Scholar * Lee DS, Goh KI, Kahng B et al. (2004) Sandpile
avalanche dynamics on scale-free networks. Physica A 338(1):84–91. https://doi.org/10.1016/j.physa.2004.02.028 Article ADS Google Scholar * Lesk C, Rowhani P, Ramankutty N (2016)
Influence of extreme weather disasters on global crop production. Nature 529(7584):84–87. https://doi.org/10.1038/nature16467 Article ADS CAS PubMed Google Scholar * Li Y, Ye W, Wang M
et al. (2009) Climate change and drought: a risk assessment of crop-yield impacts. Clim Res 39(1):31–46. https://doi.org/10.3354/CR00797 Article MathSciNet CAS Google Scholar * Liu J
(2009) _Lectures on whole network approach: a practical guide to UCINET_. Shanghai People’s Publishing House and Gezhi Press, Shang Hai, SH * Liu L, Shen MY, Tan C (2021) Scale free is not
rare in international trade networks. Sci Rep 11(1):13359. https://doi.org/10.1038/s41598-021-92764-1 Article ADS CAS PubMed PubMed Central Google Scholar * Lobell DB, Schlenker W,
Costa-Roberts J (2011) Climate trends and global crop production since 1980. Science 333(6042):616–620. https://doi.org/10.1126/science.1204531 Article ADS CAS PubMed Google Scholar *
Marchand P, Carr JA, Dell’Angelo J et al. (2016) Reserves and trade jointly determine exposure to food supply shocks. Environ Res Lett 11(9):095009.
https://doi.org/10.1088/1748-9326/11/9/095009 Article ADS Google Scholar * Martin-Shields CP, Stojetz W (2019) Food security and conflict: Empirical challenges and future opportunities
for research and policy making on food security and conflict. World Dev 119(7):150–164. https://doi.org/10.1016/j.worlddev.2018.07.011 Article Google Scholar * Motter AE, Lai YC (2003)
Cascade-based attacks on complex networks. Phys Rev E 66(6):065102. https://doi.org/10.1103/PhysRevE.66.065102 Article ADS CAS Google Scholar * Nasir MA, Nugroho AD, Lakner Z (2022)
Impact of the Russian-Ukrainian conflict on global food crops. Foods 11(19):2979. https://doi.org/10.3390/foods11192979 Article PubMed PubMed Central Google Scholar * Nature (2022) The
war in Ukraine is exposing gaps in the world’s food-systems research. http://www.nature.com/articles/d41586-022-00994-8. Accessed 25 Jul 2022 * Nelson GC et al. (2010) food security,
Farming, and Climate Change to 2050: Scenarios, Results, Policy Options (Washington, DC:International grain Policy Research Institute) * Perdana T, Chaerani D, Hermiatin F et al. (2022)
Improving the capacity of local food network through local food hubs’ development. Open Agric 7(1):311–322. https://doi.org/10.1515/opag-2022-0088 Article Google Scholar * Porfirio LL,
Newth D, Finnigan J et al. (2018) Economic shifts in agricultural production and trade due to climate change. Palgrave Commun 4:1–9. https://doi.org/10.1057/s41599-018-0164-y Article Google
Scholar * Porter JR, Xie L, Challinor AJ, Cochrane K et al. (2014) _Food security and food production systems_. Cambridge University Press, United Kingdom and New York, NY, USA, p 485-533
* Puma MJ, Bose S, Chon SY et al. (2015) Assessing the evolving fragility of the global food system. Environ Res Lett 10(2):024007. https://doi.org/10.1088/1748-9326/10/2/024007 Article ADS
Google Scholar * Rajpoot K, Singla S, Singh A (2021) Impact of COVID-19 lockdown on prices of potato and onion in metropolitan cities of India. J Agribus Dev Emerg Econ 12(3):386–399.
https://doi.org/10.1108/jadee-04-2021-0099 Article Google Scholar * Rosenzweig C, Tubiello FN, Goldberg R et al. (2002) Increased crop damage in the US from excess precipitation under
climate change. Glob Environ Change 12(3):197–202. https://doi.org/10.1016/S0959-3780(02)00008-0 Article Google Scholar * Schweitzer F, Fagiolo G, Sornette D, Vega-Redondo F et al. (2009)
Economic networks: the new challenges. Science 325(5939):422–425. https://doi.org/10.1126/science.1173644 Article ADS MathSciNet CAS PubMed MATH Google Scholar * Seekell DA, D’Odorico
P, MacDonald GK (2018) Food, trade, and the environment. Environ Res Lett 13(10):100201. https://doi.org/10.1088/1748-9326/aae065 Article ADS Google Scholar * Shi JY, Yang JH, Li YX,
Zhang QW (2019) A slight move in one part may affect the situation as a whole: supply network location, operational risk and corporate performance. China Ind Econ 9(1):136–154.
https://doi.org/10.19581/j.cnki.ciejournal.2019.09.008 Article Google Scholar * Soares JB, da Costa MR, Monteiro-Neto C (2022) Impacts of COVID-19 on the value chain of a small-scale
fishery system in a tropical metropolitan city. Mar Policy 140:105068. https://doi.org/10.1016/j.marpol.2022.105068 Article Google Scholar * Soffiantini G (2020) Food insecurity and
political instability during the Arab spring. Glob Food Sec 26(9):1–8. https://doi.org/10.1016/j.gfs.2020.100400 Article Google Scholar * Suweis S, Carr JA, Maritan A et al. (2015)
Resilience and reactivity of global food security. Proc Natl Acad Sci U.S.A 112(22):6902–6907. https://doi.org/10.1073/pnas.1507366112 Article ADS CAS PubMed PubMed Central Google
Scholar * The Economist Group. Global food security Index (GFSI). https://impact.economist.com/sustainability/project/grain-security-index/Downloads. Accessed 2 Jul 2022 * Transforming Our
World: The 2030 Agenda for Sustainable Development (United Nations, 2019) * Vora N, Fath BD, Khanna V (2019) A systems approach to assess trade dependencies in US food-energy-water nexus.
Environ Sci Technol 53(18):10941–10950. https://doi.org/10.1021/acs.est.8b07288 Article ADS CAS PubMed Google Scholar * WFP (2022) War in Ukraine drives global food crisis. WFP Rome,
Italy. https://www.wfp.org/publications/war-ukraine-drives-global-food-crisis-0. Accessed 25 Jul 2022 * You S, Liu T, Zhang M et al. (2021) African swine fever outbreaks in China led to
gross domestic product and economic losses. Nature Food 2(10):802–808. https://doi.org/10.1038/s43016-021-00362-1 Article PubMed Google Scholar * Zhang C, Yang Y, Feng Z et al. (2021)
Risk of global external cereals supply under the background of the COVID-19 pandemic: Based on the perspective of trade network. Foods 10(6):1168. https://doi.org/10.3390/foods10061168
Article CAS PubMed PubMed Central Google Scholar * Zhou M, Wu G, Xu H (2016) Structure and formation of top networks in international trade, 2001–2010. Soc Networks 44(7):9–21.
https://doi.org/10.1016/j.socnet.2015.07.006 Article Google Scholar Download references ACKNOWLEDGEMENTS The research was funded by National Social Science Foundation of China (No.
15ZDB155 and No. 20&ZD072) and was supported by the National Natural Science Foundation of China for Young Scholars (Grant No. 72004186). AUTHOR INFORMATION AUTHORS AND AFFILIATIONS *
School of Economics and Management, Wuhan University, Wuhan, 430079, China Linqing Liu, Weiran Wang, Xiaofei Yan, Mengyun Shen & Haizhi Chen Authors * Linqing Liu View author
publications You can also search for this author inPubMed Google Scholar * Weiran Wang View author publications You can also search for this author inPubMed Google Scholar * Xiaofei Yan View
author publications You can also search for this author inPubMed Google Scholar * Mengyun Shen View author publications You can also search for this author inPubMed Google Scholar * Haizhi
Chen View author publications You can also search for this author inPubMed Google Scholar CONTRIBUTIONS LL: Conceptualisation, Writing - review & editing, Supervision, Funding
acquisition. WW: Methodology, Software, Formal analysis, Data analysis, Data collation, Writing - original draft, Writing - review & editing, Visualisation, Manuscript Revision. XY: Data
collation, Visualisation. MS: Project assistant, Language Check. HC: Project assistant, Language Check, Manuscript Revision. CORRESPONDING AUTHOR Correspondence to Weiran Wang. ETHICS
DECLARATIONS COMPETING INTERESTS The authors declare no competing interests. ETHICAL APPROVAL This article does not contain any studies with human participants performed by any of the
authors. INFORMED CONSENT This article does not contain any studies with human participants performed by any of the authors. ADDITIONAL INFORMATION PUBLISHER’S NOTE Springer Nature remains
neutral with regard to jurisdictional claims in published maps and institutional affiliations. SUPPLEMENTARY INFORMATION 41599_2023_1944_MOESM1_ESM.DOCX Supplementary Information - The
cascade influence of grain trade shocks on countries in the context of the Russia-Ukraine conflict RIGHTS AND PERMISSIONS OPEN ACCESS This article is licensed under a Creative Commons
Attribution 4.0 International License, which permits use, sharing, adaptation, distribution and reproduction in any medium or format, as long as you give appropriate credit to the original
author(s) and the source, provide a link to the Creative Commons license, and indicate if changes were made. The images or other third party material in this article are included in the
article’s Creative Commons license, unless indicated otherwise in a credit line to the material. If material is not included in the article’s Creative Commons license and your intended use
is not permitted by statutory regulation or exceeds the permitted use, you will need to obtain permission directly from the copyright holder. To view a copy of this license, visit
http://creativecommons.org/licenses/by/4.0/. Reprints and permissions ABOUT THIS ARTICLE CITE THIS ARTICLE Liu, L., Wang, W., Yan, X. _et al._ The cascade influence of grain trade shocks on
countries in the context of the Russia-Ukraine conflict. _Humanit Soc Sci Commun_ 10, 449 (2023). https://doi.org/10.1057/s41599-023-01944-z Download citation * Received: 08 August 2022 *
Accepted: 18 July 2023 * Published: 29 July 2023 * DOI: https://doi.org/10.1057/s41599-023-01944-z SHARE THIS ARTICLE Anyone you share the following link with will be able to read this
content: Get shareable link Sorry, a shareable link is not currently available for this article. Copy to clipboard Provided by the Springer Nature SharedIt content-sharing initiative