Tropical cyclones enhance photosynthesis in moisture-stressed regions of india
- Select a language for the TTS:
- UK English Female
- UK English Male
- US English Female
- US English Male
- Australian Female
- Australian Male
- Language selected: (auto detect) - EN
Play all audios:

ABSTRACT We unravel the response of terrestrial ecosystems in India to Tropical Cyclones (TCs) originating in the North Indian Ocean (NIO). We find that about 34.6% of TCs drove greening and
65.4% caused browning response of vegetation during 2000–2020. TC-induced greening is more likely for TCs originated in pre-monsoon (100%) or monsoon (62.5%) than post-monsoon with large
browning response (94%). Rainfall by TCs increases soil moisture (SM) and reduces climatic water deficit (CWD) for a moisture-stressed region, and its effective utilisation by vegetation
triggers the greening response. Granger Causality reveals that TC-induced rain and greening response exhibit a maximum temporal lag of 40 days. The favourable vegetation response to TCs is a
new insight as it sheds light on the complex Atmosphere-Land-Ocean (ALO) interactions on a regional scale. The findings can aid to improve climate models for better policy decisions aimed
at climate adaptation and sustainability on both regional and global scales. SIMILAR CONTENT BEING VIEWED BY OTHERS VEGETATION FORCING MODULATES GLOBAL LAND MONSOON AND WATER RESOURCES IN A
CO2-ENRICHED CLIMATE Article Open access 14 October 2020 INCREASINGLY NEGATIVE TROPICAL WATER–INTERANNUAL CO2 GROWTH RATE COUPLING Article Open access 31 May 2023 TROPICAL CYCLONES
CUMULATIVELY CONTROL REGIONAL CARBON FLUXES IN EVERGLADES MANGROVE WETLANDS (FLORIDA, USA) Article Open access 06 July 2021 INTRODUCTION Tropical cyclones (TCs) are among the most
destructive weather systems in the world. With powerful air-sea interactions over the warm tropical oceans, TCs are one of the most potent atmospheric phenomena on the Earth1. TCs with
extreme winds, torrential rainfall, storm surge and coastal inundation cause devastating environmental and socioeconomic effects2,3. The intensity of TCs has increased and climate
projections indicate an increase in TC intensity up to 11% by the end of 21st century owing to global warming1,2,3,4. India hosts more than one TC that originates from the north Indian Ocean
(NIO) every year. NIO, with the Bay of Bengal (BoB) and the Arabian Sea (AS), experiences about 7% of the annual TCs worldwide and has hosted 80% of the world’s deadliest TCs in terms of
loss of life5. TCs generally bring a substantial amount of moisture on land from the oceans. In the current climate change context, the frequency as well as intensity of TCs are likely to
increase2,6. There is a likelihood of increased precipitation (P) and high wind speed associated with TCs under future climate scenarios7. The amount of rainfall brought by a TC on land
depends largely on its size, landfall rain area and translation speed8,9. The peak TC daily rainfall is typically comparable to the monsoon peak in that area and is not season-dependent9.
However, the TC rain is significantly influenced by the local topography, storm track and vertical shear of each event10. As TCs move inland and lose moisture supply from the sea surface,
the amount of rainfall linked to them decreases11. For many days in regions inland from the coast, a cyclonic system may bring moderate to heavy rainfall, but it may combine with other
low-pressure systems to intensify the rainfall even over an isolated area depending on season and topography12. In India, there has been an increase in rainfall brought by post-monsoon TCs.
It is evident that post-monsoon TCs contribute substantially more to the annual P than pre-monsoon TCs. This is because the post-monsoon TCs generally travel a great distance inland,
covering central and northern India and bringing plentiful rain9,13. Additionally, TCs are found to impact terrestrial landscapes, causing extreme events such as moist-heat stress14,
flooding15, and wind and extreme rainfall16. Moreover, the landfalling TCs from BoB exhibit a very strong P and soil moisture (SM) feedback, and impact the surface energy balance17. Although
there is no consensus among the climate models, most simulations for the coming decades suggest changes in P in the subtropical regions1,18,19. Understanding the nature and causes of
TC-induced P and its impact on terrestrial landscapes is of paramount importance20. Henceforth, it is crucial to assess the impact of TCs on the natural environment, particularly the
terrestrial vegetation. Traditionally, like other extreme events, TCs are observed as a natural disaster that has adverse impacts on terrestrial ecosystems21,22. It causes flooding of the
croplands and disturbs the forests by defoliating them23,24,25. The conventional damage-based approach has limitations as it fails to capture other aspects of TC-driven changes in the
terrestrial ecosystems. Water availability is key to the functioning of terrestrial ecosystems across the globe, particularly for Southeast Asia in the current climate change context26,27.
Furthermore, the carbon-water cycle coupling has strengthened in the rising moisture stress scenario for India28,29. Since TCs alter the regional water availability, we hypothesise that it
would potentially impact terrestrial ecosystems there. Therefore, for the first time, the impact of landfalling TCs of NIO on the terrestrial ecosystems in India during recent decades
(2000–2020) is explored. For this, we utilise the actual TC tracks, satellite-based moisture estimates (precipitation and soil moisture), moisture stress (climatic water deficit, CWD), and
photosynthetic activity and productivity (Solar-Induced Fluorescence, SiF), land cover types and climatic oscillations data, a suite of statistical tools, including Granger Causality. Here,
we investigate the possible results, mechanisms and implications of TC-driven changes in the terrestrial ecosystems. The adverse impacts of TCs on vegetation are well documented. Henceforth,
this study unravels the positive influence of TCs on photosynthesis and the following science questions are addressed: (i) Can tropical cyclones trigger terrestrial greening response? (ii)
If yes, what are the mechanisms involved? (iii) How does the response vary for the NIO basins (BoB and AS), seasons, TC categories and vegetation types (croplands and forests)? and (iv) What
are the implications of the TC-driven changes in vegetation? This is the first study that addresses all these research questions for NIO, and is the importance of the study. The findings
would shed new insights into the complex Atmosphere-Land-Ocean (ALO) interactions that would have wider implications on regional and global scales. RESULTS TROPICAL CYCLONES BRING RAINFALL
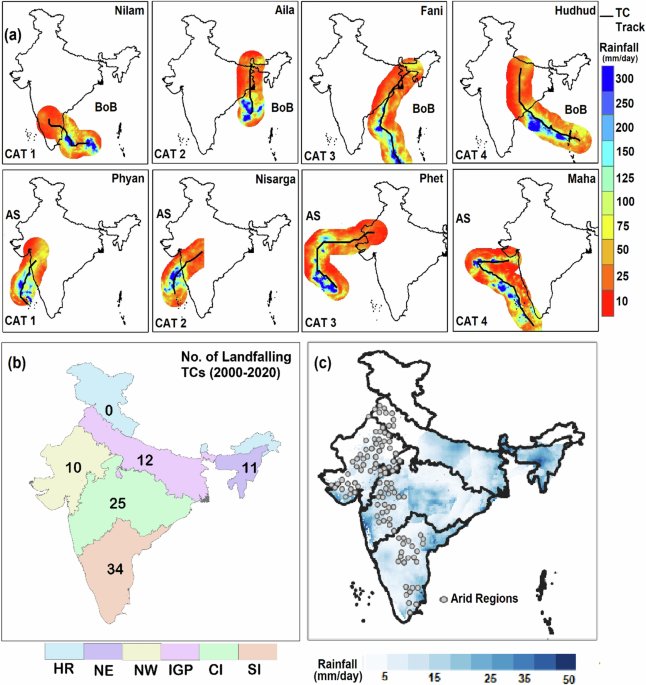
BAY OF BENGAL BASIN In India, TCs that originate from both BoB and AS bring ample rain to various regions of the country as depicted in Fig. 1a and listed in Table S1. Different intensities
or categories of TCs bring variable amounts of rainfall in different regions (Fig. S1). For instance, in 2012, the Category 1 TC Nilam brought rain (76.72 mm) to large areas of South India
(SI). Aila (2009), a Category 2 TC, rained (48.91 mm) in the areas of Central India (CI), Indo–Gangetic Plain (IGP) and North East (NE). The Category 3 TC Fani (2019) and Category 4 Hudhud
(2014) brought rain (66.11 mm and 55.17 mm) in most regions of India, except Hilly region (HR) and Northwest (NW). In contrast, TCs such as Lila, Nilam, Nivar and Fanoos rained in the
eastern SI. However, some TCs, such as Pyarr, Daye, Komen, and Hudhud, brought rain to very large areas in CI and IGP. The TCs Phailin, Fani, Amphan and Aila originated from BoB also rained
heavily in IGP and NE (Fig. S2). A total of 40 landfalling TCs occurred over BoB during the last two decades (2000–2020). Most (70%, 28 out of 40) TCs occurred during post-monsoon and then
in pre-monsoon (22.5%, 9 out of 40) seasons in BoB. A small number of TCs (7.5%, 3 out of 40) also occurred during monsoon season (Fig. 2a). Except for HR and NW, most regions experience TC
landfalling, in which SI (72.5%) and CI (42.5%) share the most, and IGP (30%) and NE (27.5%) host the rest (Fig. 2b). In general, post-monsoon TCs rained more than pre-monsoon and monsoon
TCs. For instance, Bazz (2005) and Burevi (2020) brought heavy (108–147 mm) rainfall during 5–6 days in some areas of SI. Some other post-monsoon TCs, such as Phailin (2013) and Nivar
(2020), also brought 79–97 mm of rain in 7 days in the eastern areas of CI, IGP and some areas of SI. The monsoon TC Komen (2015) brought the highest (85.05 mm) rainfall within 8 days in the
eastern SI, CI and IGP, but other monsoon TCs produced only a little rain. In pre-monsoon, the highest rainfall was found with Ronau (2016), about 85 mm in the eastern SI, CI, IGP and NE
during 6 days. Other recent pre-monsoon TCs like Amphan (2020) also rained heavily (68.28 mm) during 6 days in the eastern IGP and NE, (Fig. S2). Some TCs rained substantially in the short
span of their lifetime. For instance, the pre-monsoon TC Mora (2017) brought 82.31 mm of rainfall in some areas of SI for 4 days. The pre-monsoon TC Akash (2007) and post-monsoon Ogni (2006)
brought 71 mm of rainfall in just 2 days in the southern areas of NE and some areas of SI, respectively. ARABIAN SEA BASIN The TCs originate from AS generally show lower rainfall in
comparison to that of BoB. For instance, the highest (57.15 mm) rainfall was brought by Phyan (2019), a Category 1 TC, during post-monsoon in some areas of NW and CI in 3 days (Fig. 1a and
Table S2). The pre-monsoon TC that brought the highest amount of rain (45.45 mm) was in 2004, named 2004 AS1. Among the monsoon TCs, Nisarga (2020), a Category 2 TC, brought the highest
(45.41 mm) rain in some areas of CI. The higher intensity TCs such as Phet (2010, Category 3) and Maha (2019, Category 4) rained less (17 mm and 31 mm) as they had very small landfalling
areas in NW. The TCs such as Phyan, Nisarga, Phet and Vayu rained heavily in the NW region, and some TCs (e.g. Phyan and Nisarga) also brought rain in CI and SI (Fig. S2). Twelve landfalling
TCs originated from the AS basin in the past two decades (2000–2020). Landfalling TCs are rare during pre-monsoon (17.7%, 2 out of 12) from AS. In contrast, both monsoon and post-monsoon
have relatively higher frequency (41.7%, 5 out of 12) of landfalling TCs (Fig. 2a). On a regional scale, only NW, CI and SI regions host much of the landfalling TCs. A very large share of
these TCs rains in NW (83.3%), followed by CI (66.7%) and SI (41.7%) (Fig. 2b). RESPONSE OF TERRESTRIAL VEGETATION TO TROPICAL CYCLONES A total of 52 landfalling TCs originated in NIO during
2000–2020, where the regions SI (34) and CI (25) were heavily impacted by most TCs (Fig. 1b). These TCs rained in the arid regions too (shown in dots in Fig. 1c), which might be a limiting
factor for vegetation health and growth there. Henceforth, we further analyse the response of terrestrial photosynthetic activity and productivity to the rain brought by TCs. BAY OF BENGAL
BASIN Out of 40 TCs, 12 (30%) exhibited greening (i.e. enhanced photosynthesis) and 28 (70%) showed browning (declined photosynthesis) response. In terms of the response based on intensity
or Category of TCs (Fig. 2c), the majority of the high-intensity TCs (Category 3 and 4) show browning; contrarily, low-intensity TCs (Category 1 and 2) exhibit greening response. Among the
landfalling TCs, a higher greening response is observed for Category 2 (50%) and Category 1 (37.5%). Among the greening TCs, Category 1 (50%) and Category 2 (25%) account for the majority,
followed by Category 4 (16.67%) and Category 3 (8.34%). In contrast, predominant browning response is found for Category 3 (85.71%) and Category 4 (77.77%) TCs. On a seasonal scale (Fig.
2d), during pre-monsoon, all 9 TCs resulted in greening, i.e. 100% response. During monsoon, 33.3% of TCs exhibit greening and the rest browning response. In post-monsoon, most TCs (92.85%)
show browning. Amongst the homogeneous regions, SI hosted most TCs (72.4%) and they mostly resulted in browning. CI also hosted more TCs (52.94%), which resulted in browning than greening.
In IGP, TCs produce greening and browning responses equally (50%). In NE, most TCs (54.54%) led to greening rather than browning response (45.45%). In terms of seasonal variability in
different regions, during pre-monsoon, all TCs (100%) exhibited greening response in all homogeneous regions. CI experienced most (7) TCs, followed by NE (6) that showed greening response
during pre-monsoon. IGP and SI hosted 5 TCs each and those led to greening. During monsoon, more TCs resulted in browning than greening. In SI and CI, about 67% of TCs led to browning and
33% exhibited greening. In IGP, TCs equally (50%) produced greening and browning during monsoon. In post-monsoon, almost all TCs resulted in browning (90%), whereas the regions SI (19), CI
(7), and NE and IGP (5) exhibited a 100% browning response (Fig. 3). ARABIAN SEA BASIN In AS, out of 12 TCs, half produced greening and the rest made browning responses. In terms of response
based on the intensity of TCs (Fig. 2c), the higher greening response is observed for Category 2 and 3 (16.67%), but browning for Category 1 (16.67%) and 4 (77.77%). Among the greening TCs,
Category 2 and 3 (33.34%) account for the majority. In terms of seasonal variability (Fig. 2d), all TCs originated in pre-monsoon (100%) resulted in greening. During monsoon, most TCs (80%)
led to greening. However, all TCs (100%) resulted in browning during post-monsoon. Among the homogeneous regions, there is a mixed response to both greening and browning. In NW, more TCs
(60%) resulted in greening, but much of CI (62.5%) and SI (60%) TCs resulted in browning response. In terms of seasonal variability, all TCs (100%) resulted in greening in all regions during
pre-monsoon. Interestingly, among the regions, NW, CI and SI experienced 2 TCs each. Likewise, in monsoon, most TCs (80%) led to greening with a 100% greening response in NW (3) that had
more TCs than in CI, but none in SI. In post-monsoon, except for some TCs (25%) in NW that led to greening, most TCs resulted in browning, in which all TCs in CI (5) and SI (3) made browning
responses (Fig. 3). INTERANNUAL VARIABILITY AND RELATION WITH CLIMATIC OSCILLATIONS The response of terrestrial ecosystems in terms of changes in photosynthetic activity to the landfalling
TCs is also analysed in terms of their interannual variability (Fig. 4). BAY OF BENGAL BASIN The years with the most (4) landfalling TCs in BoB are 2000, 2013 and 2016. The years such as
2005, 2009, 2010 and 2020 exhibit the second most (3) landfalling TCs in BoB. The La Niña years (42.5%) have higher landfalling TCs than El Niño (30%) and neutral (27.5%) years in BoB. In
BoB, the highest greening response (100%) is observed in the years 2001, 2004, 2015 and 2017, where 1 TC results in greening response. This is followed by 66.66% (2 in 3) TCs results in
greening response in 2009 and 2020. About 50% greening response is observed in 2007 and 2019, but the rest exhibit browning response. There are years such as 2013 (4), 2005 (3), 2018 (2),
and 2002, 2003, 2006, 2008, 2012 and 2014 (1) TC exhibit 100% browning response (number of TCs in respective brackets). The years 2000 and 2016 (75%) and 2010 (66.66%) also show high
browning response and are La Niña years. The years with more than 1 TC that exhibits browning response are generally La Niña or neutral years, except for 2018, being an El Niño year.
However, the years with 1 or more TCs that result in greening response are both El Niño/ La Niña and neutral years. In general, the TCs almost equally resulted in greening response during El
Niño (41.66%) and La Niña (41.18%) years in BoB. Likewise, the browning response of TCs is also similar during El Niño (58.32%) and La Niña (58.82%) years in BoB. Interestingly, all
BoB-originated TCs (100%) during neutral years resulted in a browning response (Fig. 4a, c). ARABIAN SEA BASIN In AS, the years with the most landfalling TCs are 2019 (3) and 2001 (2). The
years 2004, 2006, 2007, 2009, 2010, 2017, and 2020 exhibit 1 landfalling TC each in AS. The El Niño (50%) years have higher landfalling TCs than La Niña (33.33%) and neutral (16.66%) in AS.
In AS, the highest greening response (100%) is observed in the years 2004, 2007, 2010 and 2020, where 1 TC results in greening response. This is followed by 50% (1 in 2) in the year 2001 and
33.33% (1 in 3) in the year 2020, that exhibit greening response in AS. The years such as 2006, 2009 and 2017 show 100% browning response, where 1 TC results in browning. The years 2019
(66.66%, 2 in 3) and 2001 (50%, 1 in 2) also exhibit high browning response. Overall, greening response to TCs is higher during La Niña (75%) than El Niño (33.33%) years. In contrast, the
browning response is higher during El Niño (66.66%) years than La Niña (25%) years. The greening and browning response for AS-originated TCs are almost equal (50%) for neutral years (Fig.
4b, d). CROPLAND AND FOREST RESPONSE TO TROPICAL CYCLONES Furthermore, to get detailed insights on the response of natural vegetation (forests) and croplands to the rain driven by
landfalling TCs, we investigate it across the TC intensities and seasons (Fig. 5). BAY OF BENGAL BASIN Among the 40 landfalling TCs in BoB, 27% exhibit cropland greening, and 73% result in
cropland browning response. The greening response was relatively higher in forests (40%), as illustrated in Fig. 5a. Also, cropland greening is more frequent for lower intensity, i.e.
Category 2 (50%) and Category 1 (30.76%), than for higher intensity, i.e. Category 4 (25%) and Category 3 (12.5%) TCs. Likewise, forests exhibit predominant greening (100%) for low intensity
(Category 1 and 2) than higher intensity TCs (16.67%) such as Category 3 and 4 (Fig. 5b). In terms of seasonal variations, during pre-monsoon all TCs (100%) resulted in cropland and forest
greening response. During monsoon, one-third (33.34%) of TCs led to cropland greening, but all TCs (100%) resulted in forest greening response. This might be so, as the monsoon rains and
irrigated water would saturate the soil with water in croplands, but forests might still need more moisture for growth. However, in post-monsoon very few TCs led to greening of croplands and
forests (8%), as most (> 90%) exhibit browning response (Fig. 5c). ARABIAN SEA BASIN One in two (50%) of the landfalling TCs exhibit greening of both croplands and forests (Fig. 5a). The
cropland greening response is more common (67%) for medium intensity, i.e. Category 2 and 3 than for others, i.e. Category 1 and 4 (33%) TCs. Forests exhibit greening responses for
moderate-intensity TCs such as Category 2 (100%) and 3 (50%). Category 1 and 4 TCs did not lead to a greening response. Higher intensity TCs (Category 4) lead to browning of forests (100%),
as illustrated in (Fig. 5d). In terms of seasons, croplands largely exhibit greening in pre-monsoon (100%) and monsoon (80%). Forests exhibit greening for TCs during monsoon (100%) and
browning response (100%) for TCs in post-monsoon (Fig. 5e). RAIN USE EFFICIENCY FOR GREENING TROPICAL CYCLONES Rain use efficiency (RUE) for Indian vegetated land is estimated and presented
in Fig. 6a. RUE is a measure of the potential or the ability of vegetation to effectively utilise the available moisture provided through the rain for the photosynthetic activity. The RUE
for Indian vegetated land ranges from less than 0.2 to more than 3.2. The highest (3.2) RUE is observed in arid areas such as the Punjab and Haryana regions of IGP. Some areas in the
northern, central and southeastern SI also exhibit high (1.6) RUE. Similar RUE is also estimated for some areas in Eastern Himalaya, NE and NW. These are the regions in need of moisture for
the vegetation and any amount of rain is utilised by the plants. In contrast, low (<0.4) RUE is observed for the majority of CI, eastern IGP and some areas in HR. The rest of the areas
exhibit moderate RUE (0.4–1.6). We have also estimated RUE for the TCs that resulted in greening (Fig. 6c). BAY OF BENGAL BASIN In BoB, Bijli (2009) in pre-monsoon, exhibited the highest RUE
(132.4) and it brought marginal rain (5.79 mm) during 4 days in the eastern CI, IGP and southern NE. However, it did lead to a substantial enhancement in SiF (40.18%). Pre-monsoon TCs, such
as Akash (19.4), Laila (15.53), Aila (14.41) and Ronau (12.42) exhibit large RUE as they rained optimally in a span of few days that resulted in greening response (Table S3). The smallest
RUE (0.49) is observed for Burevi in post-monsoon of 2020. It brought the highest amount of rain (121.9 mm) in 6 days in southern SI. However, this rainfall did not translate well into the
photosynthetic activity. Another recent TC, Amphan (2020), exhibits a relatively low RUE (2.5). It was a pre-monsoon TC that brought 68.28 mm of rainfall in 6 days in eastern CI, IGP and
southern NE. This rain did trigger photosynthetic activity and thus, showed a very small increase in SiF, about 2.5% (Figs. 3 and 6c). ARABIAN SEA BASIN Among the AS TCs, Yemyin (98.29)
exhibits a very high RUE as it rained marginally (11.97 mm) in 2 days in a very small region in the westernmost NW during the monsoon of 2007. However, this resulted in a substantial
(59.81%) rise in photosynthetic activity. Vayu (34.93) also showed a very high RUE as it brought moderate (50.2 mm) rain in the areas of westernmost NW and CI during monsoon of 2019 that led
to a high increase (66.65%) in SiF. Another monsoon TC Nisarga (2020) exhibited a high RUE (26.4) as it rained moderately (45.41 mm) during 4 days in the western half of CI that
substantially enhanced (62%) SiF (Figs. 3 and 6c). In summary, the TCs that brought rain to a very small area in pre-monsoon or monsoon resulted in high RUE and increased SiF (greening
response). TROPICAL CYCLONE-DRIVEN CHANGES IN SOIL MOISTURE AND ITS UTILISATION FOR GREENING The link between TC-driven P and enhanced photosynthetic activity (greening) is soil moisture
(SM). Therefore, we also analyse the changes in SM owing to the TC-induced P and its role in greening response (Fig. 7a). BAY OF BENGAL BASIN In the BoB basin, Aila (2009) exhibited the
highest rise (80%) in SM (Table S3). It was a pre-monsoon TC that rained in the eastern CI, IGP and southern NE. Despite the substantial increase in SM (29.75%), Aila did not result in
enhancement of photosynthetic activity. In fact, Aila exhibited one of the smallest soil moisture use efficiency (SMUE, 0.37). SMUE is a measure of the potential or the ability of vegetation
to effectively utilise the plant available soil water for the photosynthetic process. Likewise, recently, the pre-monsoon TC Amphan (2020) resulted in an increased (34.21%) SM that did not
translate well into (6.45%) photosynthetic activity and also produced a low SMUE (0.19). In contrast, Akash in pre-monsoon of 2007 showed a high SMUE (1.6) as it exhibited a 29% rise in SM
and a corresponding increase in SiF, about 46.47%. Similarly, the pre-monsoon TCs Laila (0.64) and Ronau (0.77) made moderate SMUE and led to a substantial enhancement of SM (79%, 49.66%)
and SiF (51.18%, 38.17%). The lowest SMUE (0.09) is observed for a post-monsoon TC Burevi (2020) with a 20% enhancement in SM. However, this rise in SM resulted in a marginal increase of SiF
(1.89%). In contrast, the highest SMUE (2.64) is estimated for a post-monsoon TC in 2000 (BOB3) that resulted in a 21.85% rise of SM and led to a substantial (57.85%) enhancement in SiF
(Figs. 3, 7a and Table S3). ARABIAN SEA BASIN Phet (2010), a monsoon TC, brought moisture in the westernmost areas of NW resulted in a massive increase in SM (114.8%) and SiF (60.17%) (Table
S4), but a moderate SMUE (0.52). Another monsoon TC, Nisarga (2020), brought moisture to the western parts of CI and made a very high increase in SM (97.62%) and SiF (62%) with a moderate
SMUE (0.63). Another pre-monsoon TC in 2004 (AS4) that brought moisture in NW and SI produced a huge rise in SM, about 88.24%. However, this improvement in SM was not effectively utilised by
vegetation as the increase in SiF (27.88%) is the smallest among the greening TCs of AS as evident from the low SMUE (0.31). In contrast, Yemyin in the monsoon of 2007 moistened the
westernmost NW, and exhibited a very high SMUE (6.75) as it led to a marginal (8.86%) increase in SM, but a substantial rise in SiF (59.81%). Another monsoon TC, Vayu (2019) exhibited high
(2.92) SMUE in the western NW and CI, and produced a very high increase (66.65%) in SiF because of improved SM (22.82%) (Figs. 3 and 7a; Table S4). DECLINE IN MOISTURE STRESS AND GREENING
RESPONSE DUE TO TROPICAL CYCLONES As shown in Fig. 6b, the moisture-stressed regions are identified using aridity metric of climatic water deficit (CWD). In NW and some areas of SI, CWD is
highest (>90 mm). A significant level of water deficit (>75 mm) is present in most of western NW, CI and SI. Much of IGP, eastern CI, western coastal areas and eastern southern SI show
moderate (45–60 mm) moisture stress. A lower (30–60 mm) water deficit is present in upper IGP, eastern CI and northeastern SI. Here, we explore the moisture stress based on CWD for the
greening TCs (Fig. 7b). Except for Aila from BoB, the greening TCs exhibit a decline in CWD after its occurrence. Among the TCs from BoB, Amphan (99.94%), Lila (96.37%), Burevi (91.46%) and
Mora (90.17%) exhibit a substantial reduction in CWD, followed by the TC occurrences. Other TCs like Ronau (74.84%), Fani (65.26%), Komen (60.63%) and Bijli (56.27%) also show a large
decline in CWD after the TC events. TCs from AS generally exhibit a substantial reduction in CWD after their occurrences, such as in the case of Vayu (99.93%), Yemyin (99.14%), Nisarga
(96.89%) and Phet (81.24%). We also estimated the ratio of the percentage change in CWD to the percentage change in SM for these greening TCs. This ratio gives a sense of the moisture stress
that prevails in the region. Among TCs, Yemyin from the AS basin exhibits the highest ratio of 11.19. It means that for every 1% increase in SM after a TC, CWD is reduced by 11.19%. Among
the TCs from BoB, Mora (5.69%) and Burevi (4.57), and Vayu (4.37) from AS show high ratios. In contrast, the smallest ratio is estimated for Phet (0.7) from AS, followed by Bijli (0.9) from
BoB and Nisarga (0.99) from AS. Other TCs such as Laila (1.21), Fani (1.48), Ronau (1.5), Komen (2.66) and Amphan (2.92) from BoB show moderate ratios of decline in CWD owing to the increase
in SM after a TC. Furthermore, to understand the direct effect of change in CWD on terrestrial photosynthesis post-TC, we estimate the ratio of the increase in SiF to the decline in CWD for
the greening TCs. The largest ratio is estimated for Phet (0.74) from AS and Bijli (0.71) from BoB. It means that for every 1% decline in CWD, SiF rises by 0.74% (Phet) and 0.71% (Bijli).
In contrast, the BoB TCs such as Burevi (0.02), Amphan (0.06), Mora (0.137) show very small ratios. It implies that the TCs that brought moisture to a small area in a dry season or region
are effectively utilised by vegetation for photosynthetic activity, which leads to greening response. DISCUSSION TCs are typically viewed as a natural disaster that has detrimental effects
on terrestrial ecosystems, similar to other extreme events21,22. It disrupts the forests by defoliating them and causes flooding of croplands23,24,25. Both basins of NIO (BoB and AS)
regularly experience TCs, where BoB is more vulnerable to TCs than AS because of its distinct physical oceanographic conditions, such as high stratification. However, in the climate change
context, TCs have also increased in frequency in AS recently30. In recent times, TCs have been closely linked with alterations in terrestrial landscapes in India, such as causing moist-heat
stress14, flooding15, and wind and extreme precipitation16. Another study explored the SM and P feedback for landfalling TCs in BoB17. In the current climate change context, water
availability is critical to the functioning of terrestrial ecosystems in India28,29. Since TCs alter terrestrial moisture availability, understanding their impact on the natural environment,
particularly terrestrial vegetation, is crucial in this context. We postulate that a dry spell might have been the growth constraint prior to the occurrence of TCs, whereas the rain brought
by a cyclone might have improved plant photosynthesis by reducing soil dryness. The co-occurrence of a moisture stress or a dry spell with a TC is well reported31. When TCs make landfall in
the mid-latitudes during dry summers, the seasonal drought is usually (43–90%) terminated32. Furthermore, the peak TC hourly runoff usually occurs before the peak TC hourly rainfall.
However, a significant seasonal pattern can be observed across the basins, particularly in the total daily runoff. Pre-monsoon TC events had relatively low total runoff, whereas summer
monsoon TC events had relatively high total runoff15. In contrast to most studies that explored the post-TC impacts in terms of damages, an unbiased assessment of the effect of TCs on
terrestrial photosynthesis in India is presented here. We find that more than one-third (34.6%) of the landfalling TCs result in enhanced photosynthesis (greening response). It also depends
highly on the season of occurrence of TCs. As pre-monsoon (100%) and monsoon (62.5%) TCs result in greening, but most post-monsoon TCs (94%) result in browning response (decline in
photosynthesis). In terms of comparison among the two basins of NIO, AS-originated TCs exhibit higher greening response (50%) in comparison to that of BoB (30%). Fewer TCs originate in AS
than BoB, and the regions where landfall occurs in the western regions are generally drier than the eastern regions of India. On a regional scale, NW and NE exhibit a substantial (55–60%)
greening and relatively lower (40–45%) browning in response to TCs. In contrast, SI (70.6%) and CI (56%) exhibit higher browning response. This might be so as both NW and NE are generally
away from the origin of TCs in AS and BoB, respectively, and get optimum moisture that facilitates a greening response in a dry period. Conversely, CI and SI are in the proximity of TC
origins and get extensive rains, which do not support greening in saturated SM conditions. The greening response of forests is higher than that of croplands for the TCs from BoB, but it is
equal for the TCs of AS. Also, greening was more common for low-intensity TCs in croplands and moderate-intensity TCs in forests during pre-monsoon and monsoon seasons. The higher intensity
TCs largely result in the browning of both croplands and forests in post-monsoon. This is mainly due to the oversaturation of soil with moisture, which leads to water logging that declines
photosynthesis. Additionally, the TC-induced rain and water logging alters the salinity and nutrient conditions of soil, which decreases photosynthesis. Additionally, the higher intensity
TCs are associated with very strong wind gusts that defoliate and uproot the plants, and lead to tree mortality and browning response. However, sometimes the TC-driven winds defoliate plants
and dry leaves, to trigger regeneration of leaves and drive greening response. In brief, the TCs that make landfall during the period of moisture stress, bring optimum moisture, lead to
greening response. Furthermore, the TCs that make landfall when there is an excess of moisture for plants, result in browning response33. Similarly, we find that TCs-induced rain that
improved SM and reduced moisture deficit (CWD) in a dry region or season, triggered enhancement in photosynthetic activity and productivity (Fig. 8). We utilised Granger Causality to examine
this further and found that there is a maximum temporal lag of 40 days in the occurrence of a TC and the greening response. TCs that rained optimally over a course of time in a small region
led to efficient utilisation of moisture (higher RUE, SMUE), and a greening response. On average, greening TCs in NIO brought 53 mm of rainfall that resulted in a 47% increase in readily
plant available water (SM) and an 84% reduction in moisture stress (CWD), which led to a 38% increase in terrestrial photosynthesis (SiF). The efficient utilisation of rain (RUE, 32.31) and
SM (SMUE, 1.27) results in greening response. Also, for every 1% increase in SM, CWD declined by 3.18%, and for every 1% decline in CWD, SiF increased by 0.44%. The AS-originated TCs that
resulted in greening response brought smaller (29.1 mm) rain than that of BoB (64.9 mm), but it led to more SM (60.6%) than that of BoB (41.2%). Also, the decline in CWD is higher (94.3 mm),
and thus, the higher greening response is exhibited in the AS TCs (55.27%) than in those with BoB. AS also exhibits higher RUE (53.67) and SMUE (2.15) than BoB (21.6, 0.84), as shown in
Fig. 9. For every 1% increase in SM, CWD declined by 2.6% and for every 1% decline in CWD, SiF increased by 0.34% for BoB TCs, that results in a greening response. For AS-originated TCs that
resulted in greening response, for every 1% increase in SM, CWD declined by 4.31% and for every 1% decline in CWD, SiF increased by 0.66%. The positive response of vegetation to TCs sheds
new light on the benefits of TCs to terrestrial ecosystems and mankind. We find TCs bring rain, which increases SM, decreases moisture deficit (CWD) in a dry season or region, and thus leads
to enhanced photosynthesis (i.e. greening response). The study highlights the significance of short-term (daily) precipitation on photosynthesis regardless of its long-term
(seasonal/annual)34 effect. It brings new insights into the Atmosphere-Land-Ocean (ALO) Interactions on a regional scale and can have wider implications on a global scale. The positive
impacts of TCs are mostly unknown and are of paramount significance in this context, as India is an extensively agrarian economy that depends largely on its croplands and forest resources.
Therefore, TC-driven greening can help to enhance the production of food grains and increase carbon uptake in efficient carbon sinks, particularly after a moisture stress event. Apart from
these, TC-induced greening may also help to recycle moisture and maintain the hydrological and energy balance between the ocean, land, and atmosphere. It would also lead to regional cooling
and may help to mitigate the global warming impacts. Furthermore, comprehending TC-induced greening responses will enhance regional climate forecasts and aid in the refinement of future
climate models. Integrating insights from TC greening responses into regional climate models might improve their prediction and can assist policy decisions for climate adaptation. Indian
ecosystems are greening in recent decades due to both climate change and human interventions26,27,35. In fact, India is the second largest contributor to global greening, largely due to land
management and improved irrigation36,37. Moisture-induced greening is mainly observed in NW, but warming-induced moisture stress drives browning in eastern IGP and southern SI in recent
decades27,28,29. Concurrently, NIO is rapidly warming, with intense warming in the Indian Ocean Warm Pool (IOWP), and the West Pacific Warm Pool is getting stronger and moving westward38,39.
These suggest a potential westward shift of the Indian Summer Monsoon (ISM)40. These are long-term changes in the atmosphere-land-ocean (ALO) interactions. However, the short-term or
event-based changes in ALO interactions are not adequately explored for the Indian region. These long-term changes may also have some impacts on these short-term or event-based changes.
These event-based changes are largely independent of the long-term changes, though we did not find a conclusive relation between the Indian ecosystem response to TC-induced rain and climatic
oscillations. The greening response of TCs is mostly similar for both the El Niño and La Niña years. The specific events (e.g. COVID-19 lockdown) can have substantial short-term impacts and
are largely independent of long-term impacts of regional meteorology. These short-term events can have direct or indirect influence on sensitive terrestrial ecosystems41,42. Note that the
climatic oscillations and long-term changes will have an impact on the TC occurrences. However, the response of vegetation in terms of changes in the photosynthetic activity and productivity
primarily depends upon the regional short-term meteorology, particularly the moisture availability before and after the occurrence of TCs. Additionally, the local meteorology before a TC
event, such as temperature and radiation, is very short-lived to have a substantial impact on photosynthesis. Furthermore, it is difficult to physically separate these meteorological
conditions from TC-induced rain and the corresponding response of vegetation to it. The findings are centred around satellite measurements and reanalyse data with inheriting limitations.
In-situ data would certainly help our findings, but making observations during a violent storm like a cyclone is always challenging and restricted. The statistical methods employed are
generally robust and simple, but uncertainties in the data might add some limitations to the estimated values. However, some analyses are largely data-driven and are subject to certain
constraints. METHODS TROPICAL CYCLONE AND MOISTURE DATA We use a wide variety of datasets for this study, as mentioned in Table 1. The cyclone track and other information such as dates, are
obtained from Indian Meteorological Department (IMD) best-tracks (http://www.rsmcnewdelhi.imd.gov.in). To track the amount of moisture brought by TCs we utilise satellite measurements of P
and SM. The daily P data at 0.1° × 0.1° are based on Global Precipitation Measurement (GPM), which is a global satellite network43. We have also considered the 0.25° × 0.25°, 8-day remote
sensing-based SM data. The Climate Change Initiative (CCI) of the European Space Agency (ESA) produced the global SM data. The ESA CCI SM44, is a collection of single-sensor active (derived
from scatterometers) and passive microwave (derived from radiometers) data. The ESA CCI SM dataset (v07.1) is used in our study36. ARIDITY METRIC To delineate the areas that are experiencing
moisture stress, aridity metrics are used. We utilise, Climatic Water Deficit (CWD) from the TERRA Climate database at 4 km and 8-day. Potential evapotranspiration (PET) is the ideal
moisture supply for healthy crops to be evaporated, and actual evapotranspiration (AET) is the moisture supply to plants as it is affected by the weather, availability of water and crop
health45,46. The deficit between PET and AET is calculated as CWD as follows: CWD = PET-AET. CWD is frequently used as an indicator of water stress because it indicates the amount of water
that would have evaporated from the soil or transpired from plants if were readily available to them28,46. PHOTOSYNTHETIC PROXY To examine the response of terrestrial vegetation to the
TC-induced P, we have used the Moderate Resolution Imaging Spectroradiometer (MODIS) land cover data at 500 m for the year 2019 to delineate the vegetated land consisting of croplands and
forests. Any land cover type other than croplands or forests is masked out. Furthermore, solar-induced fluorescence (SiF) GOSIF v2 dataset, at 0.05° × 0.05° and 8-day is used to understand
the changes in photosynthetic activity and productivity. SiF acts as a physiological proxy for vegetation greenness and gross primary productivity (GPP)47,48,49. SiF is a better indicator of
actual plant photosynthesis than the conventional vegetation indices50,51. This is because SiF has a more direct relation with the internal photosynthetic mechanism, as it is the radiation
flux emitted as light energy. This radiation flux is a small fraction of the absorbed photosynthetically active radiation (PAR), with peaks at 685 nm and 740 nm. It is re-emitted by plants
from Chlorophyll (Chl-a) molecules excited during photosynthesis in the red and far-red bands (650–850 nm)52. CLIMATIC OSCILLATIONS To investigate the impacts of large-scale circulations of
the El Niño Southern Oscillation (ENSO) on TC activity, we employ the Oceanic Niño Index (ONI) from the National Oceanic and Atmospheric Administration (NOAA)
(https://origin.cpc.ncep.noaa.gov/). TRACKING LANDFALLING TROPICAL CYCLONES We consider the IMD best-track data to understand the track of TCs, and then we select the landfalling TCs. To
determine the duration of each TC event, we use the cyclone tracks. We also choose the area along the TC path over land. The landfalling TCs are segregated into two broad categories based on
their genesis, i.e. BoB or AS. Next, landfalling TCs are classified in terms of the season of their occurrence, i.e. pre-monsoon (March, April and May: MAM), monsoon (June, July, August and
September: JJAS) and post-monsoon (October, November and December: OND)30,53. To track the moisture brought by TCs to the vegetated land, track, cyclone area, P and the MODIS land cover
data are utilised. CHANGES IN MOISTURE AVAILABILITY AND PHOTOSYNTHESIS ON LAND DUE TO TROPICAL CYCLONES The net moisture (Pn) brought by TCs is estimated as the product of mean precipitation
intensity (Pi) and duration of the landfall in terms of number of days (D), as per the Eq. 1: $${\rm{Pn}}={\rm{Pi}}\times {\rm{D}}$$ (1) To understand the changes in soil moisture because
of TC rain, we estimate the changes in SM (∆SM%), before and after TC as per the Eq. 2: $$\Delta {\rm{SM}} \%
=\frac{{{SM}}_{({\rm{A}}-{\rm{TC}})}-\,{{SM}}_{({\rm{B}}-{\rm{TC}})}}{{{SM}}_{({\rm{B}}-{\rm{TC}})}}\times 100$$ (2) Here, ∆SM% is the change in soil moisture due to moisture brought by TCs.
_SM_(A–TC) and _SM_(B–TC) are SM after and before the occurrence of TCs, respectively. To understand the change in the terrestrial photosynthetic activity and productivity by TC rain, we
estimate the change in SiF (∆SiF%) before and after TC events as per the Eq. 3: $$\Delta {\rm{SiF}} \%
=\frac{{{SiF}}_{({\rm{A}}-{\rm{TC}})}-\,{{SiF}}_{({\rm{B}}-{\rm{TC}})}}{{{SiF}}_{({\rm{B}}-{\rm{TC}})}}\times 100$$ (3) Here, ∆SiF% is the change in SiF due to moisture brought by a TC.
_SiF_(A–TC) and _SiF_(B–TC) are SM after and before the occurrence of a TC, respectively. The increase in SiF refers to the enhancement in photosynthetic activity and terrestrial
productivity, i.e. greening. In contrast, a decrease in SiF refers to the decline in photosynthetic activity and terrestrial productivity, i.e. browning. To examine the change in moisture
stress as a result of the TC rain, we find the change in CWD (∆CWD%), before and after the TC occurrence, as per the Eq. 4: $$\Delta {\rm{CWD}} \%
=\frac{{{CWD}}_{({\rm{A}}-{\rm{TC}})}-\,{{CWD}}_{({\rm{B}}-{\rm{TC}})}}{{{CWD}}_{({\rm{B}}-{\rm{TC}})}}\times 100$$ (4) Here, ∆CWD% is the change in CWD due to moisture brought by a TC.
_CWD_(A–TC) and _CWD_(B–TC) are CWD after and before the occurrence of a TC, respectively. The decrease in CWD refers to a decline in moisture stress, and an increase in CWD indicates an
enhancement in moisture stress. Since the SiF, CWD, and SM data are in the 8-day intervals, we keep the dates before a TC occurrence and after within the same season to avoid the overlap
with other TCs, i.e. 8 days prior and after the actual dates. ESTIMATION OF UTILISATION OF MOISTURE We estimate the Rainfall Use Efficiency (RUE) of the moisture brought by TCs. Ecosystem
RUE is a measure of the potential of terrestrial ecosystems to utilise the rainfall for the photosynthetic activity. It effectively represents plant hydraulic control54,55, serving as an
efficient metric for detecting sudden changes in terrestrial ecosystems, particularly under moisture stress conditions56,57. Here, we estimate RUE as the ratio of increase in SiF (∆_SiF_) to
Pn added by a TC, as per the Eq. 5: $${\rm{RUE}}=\frac{\Delta {SiF}}{{\rm{Pn}}}$$ (5) The sustainability of vegetation growth and photosynthetic activity based on the utilisation of
available SM is called soil moisture use efficiency (SMUE). It is conventionally estimated as the ratio of carbon gained (Net Primary Productivity, NPP) to the SM utilised58,59. Furthermore,
to have a vivid understanding of the utilisation of change in SM by the terrestrial green cover, we also estimate the SM conversion rate or SM use efficiency (SMUE) as the ratio of change
in SiF (∆_SiF_%) to change in SM (∆_SM_%) due to the moisture brought by a TC, as per the Eq. 6: $${\rm{SMUE}}=\frac{\Delta {SiF}}{\Delta {SM}}$$ (6) We attempt to understand the change in
moisture stress through the estimation of change in CWD (∆_CWD_%) to the change in SM (∆_SM_%) due to moisture brought by a TC, and call it moisture stress index (MSI) as per the Eq. 7:
$${\rm{MSI}}=\frac{\Delta {CWD}}{\Delta {SM}}$$ (7) We also examine the direct impact of change in moisture stress on photosynthetic activity. Therefore, we estimate the ratio of change in
SiF (∆_SiF_%) to the change in CWD (∆_CWD_%) due to moisture brought by a TC and call it photosynthetic moisture index (PMI) as per the Eq. 8: $${\rm{PMI}}=\frac{\Delta {SiF}}{\Delta
{CWD}}$$ (8) GRANGER CAUSALITY To imply the causation of changes in moisture-driven impacts on terrestrial photosynthetic activity and productivity, we consider the Granger causality test.
Additionally, there is a temporal lag between the increase in SM and its utilisation by plants, and therefore, we use the Granger Causality test to examine this. Granger causality occurs
when all relevant information except the current value of \(x(t)\) improves capacity to predict possible \(y(t)\), when variable\(\,x(t)\) is stated to Granger causing \(y(t)\). A “feedback”
relationship between a cause and its effect is established when both are capable of Granger causation60. To be more exact, the test is specified in terms of the linear relationships that
exist between x(t) and the lagged time series _x_(_t_−_τ_) and _y_(_t_−_τ_) with lags that range from 1 to the maximum value (_τ_max) Here, the maximum lag was selected here is selected as
11 octads (88 days) to keep the dates of pre and post-TC occurrence detection within the same season. Granger proposed a bivariate model consisting of two stationary time series for making
the causal analysis (\(x(t)\) and \(y(t)\)) as per the Eqs. 9 and 10. $$y(t)=\mathop{\sum }\limits_{\tau =1}^{{\tau }_{\max }}{\alpha }_{\tau }{\rm{y}}({\rm{t}}-{\rm{\tau }})+\mathop{\sum
}\limits_{\tau =1}^{{\tau }_{\max }}{\beta }_{\tau }{\rm{x}}({\rm{t}}-{\rm{\tau }})+{\varepsilon }_{t}$$ (9) $$x(t)=\mathop{\sum }\limits_{\tau =1}^{{\tau }_{\max }}{\alpha }_{\tau
}{\rm{x}}({\rm{t}}-{\rm{\tau }})+\mathop{\sum }\limits_{\tau =1}^{{\tau }_{\max }}{\beta }_{\tau }{\rm{y}}({\rm{t}}-{\rm{\tau }})+{{\rm{\delta }}}_{t}$$ (10) where, \(x(t)\), \(y(t)\) stands
for stationary time series; \({\varepsilon }_{t}\), \({{\rm{\delta }}}_{t}\) represents white noise; coefficients \({\alpha }_{\tau }\) and \({\beta }_{\tau }\); \({\beta }_{\tau }\) ≠ 0,
for \(x(t)\) is stated to Granger causing \(y(t)\). DATA AVAILABILITY All data are publicly available as listed in Table 1. CODE AVAILABILITY Data processing is performed in R Studio
(version 4.2.1) and ArcGIS (version 10.4). The plots and charts are created in and ArcGIS (version 10.4) and OriginPro (version 9). The R codes for GC can be obtained from
https://github.com/RahulKashyap1803. REFERENCES * Emanuel, K. Increasing destructiveness of tropical cyclones over the past 30 years. _Nature_ 436, 686–688 (2005). Article CAS Google
Scholar * Knutson, T. R. et al. Tropical cyclones and climate change. _Nat. Geosci._ 3, 157–163 (2010). Article CAS Google Scholar * Patricola, C. M. & Wehner, M. F. Anthropogenic
influences on major tropical cyclone events. _Nature_ 563, 339–346 (2018). Article CAS Google Scholar * Sobel, A. H. et al. Human influence on tropical cyclone intensity. _Science_ 353,
242–246 (2016). Article CAS Google Scholar * Secretariat, I. P. C. C. World Meteorological Organization/United Nations Environment Programme. _Climate Change_ (IPCC Secretariat, 2007). *
Walsh, K. J. et al. Tropical cyclones and climate change. _Trop. Cyclone Res. Rev._ 8, 240–250 (2019). Article Google Scholar * Seneviratne, S. Weather and climate extreme events in a
changing climate. In: _IPCC Sixth Assessment Report_ (IPCC, 2022). * Titley, H. A. et al. Key factors influencing the severity of fluvial flood hazard from tropical cyclones. _J.
Hydrometeorol._ 22, 1801–1817 (2021). Google Scholar * Krishnaja, P. B., Akhila, R. S., Kuttippurath, J. & Sunanda, N. Tropical Cyclone-driven rainfall in the northeast Indian Ocean and
adjoining land regions during the period 2000–2020. _J. Hydrol._ 629, 130610 (2023). Article Google Scholar * Lavender, S. L. & McBride, J. L. Global climatology of rainfall rates and
lifetime accumulated rainfall in tropical cyclones: influence of cyclone basin, cyclone intensity and cyclone size. _Int. J. Climatol._ 41, E1217–E1235 (2021). Article Google Scholar *
Dare, R. A., Davidson, N. E. & McBride, J. L. Tropical cyclone contribution to rainfall over Australia. _Monthly Weather Rev._ 140, 3606–3619 (2012). Article Google Scholar * Larson,
J., Zhou, Y. & Higgins, R. W. Characteristics of landfalling tropical cyclones in the United States and Mexico: climatology and interannual variability. _J. Clim._ 18, 1247–1262 (2005).
Article Google Scholar * Singh, K., Panda, J. & Kant, S. A study on variability in rainfall over India contributed by cyclonic disturbances in warming climate scenario. _Int. J.
Climatol._ 40, 3208–3221 (2020). Article Google Scholar * Rajeev, A. & Mishra, V. Observational evidence of increasing compound tropical cyclone‐moist heat extremes in India. _Earth’s.
Future_ 10, e2022EF002992 (2022). Article Google Scholar * Rajeev, A. & Mishra, V. On the causes of tropical cyclone driven floods in India. _Weather Clim. Extremes_ 36, 100432
(2022). Article Google Scholar * Rajeev, A. & Mishra, V. Increasing risk of compound wind and precipitation extremes due to tropical cyclones in India. _Environ. Res. Clim._ 2, 021004
(2023). Article Google Scholar * Navale, A. & Karthikeyan, L. Soil moisture-precipitation feedbacks in pre‐and post‐monsoon landfalling tropical cyclones in Bay of Bengal. _Q. J. R.
Meteorol. Soc._ 149, 2433–2453 (2023). Article Google Scholar * Emanuel, K. A. Downscaling CMIP5 climate models shows increased tropical cyclone activity over the 21st century. _Proc. Natl
Acad. Sci. USA_ 110, 12219–12224 (2013). Article CAS Google Scholar * Monerie, P. A., Biasutti, M. & Roucou, P. On the projected increase of Sahel rainfall during the late rainy
season. _Int. J. Climatol._ 36, 4373–4383 (2016). Article Google Scholar * Pausata, F. S. et al. Tropical cyclone activity enhanced by Sahara greening and reduced dust emissions during the
African Humid Period. _Proc. Natl Acad. Sci. USA_ 114, 6221–6226 (2017). Article CAS Google Scholar * Honkavaara, E., Litkey, P. & Nurminen, K. Automatic storm damage detection in
forests using high-altitude photogrammetric imagery. _Remote Sens._ 5, 1405–1424 (2013). Article Google Scholar * Forzieri, G. et al. A spatially explicit database of wind disturbances in
European forests over the period 2000–2018. _Earth Syst. Sci. Data_ 12, 257–276 (2020). Article Google Scholar * Chambers, J. Q. et al. Hurricane Katrina’s carbon footprint on US Gulf
Coast forests. _Science_ 318, 1107–1107 (2007). Article CAS Google Scholar * Wang, B., Xiang, B. & Lee, J. Y. Subtropical high predictability establishes a promising way for monsoon
and tropical storm predictions. _Proc. Natl Acad. Sci. USA_ 110, 2718–2722 (2013). Article CAS Google Scholar * Uriarte, M., Thompson, J. & Zimmerman, J. K. Hurricane María tripled
stem breaks and doubled tree mortality relative to other major storms. _Nat. Commun._ 10, 1362 (2019). Article Google Scholar * Kashyap, R., Pandey, A. C. & Kuttippurath, J.
Photosynthetic trends in India derived from remote sensing measurements during 2000–2019: vegetation dynamics and key climate drivers. _Geocarto Int._ 37, 11813–11829 (2022). Article Google
Scholar * Kashyap, R., Kuttippurath, J. & Kumar, P. Browning of vegetation in efficient carbon sink regions of India during the past two decades is driven by climate change and
anthropogenic intrusions. _J. Environ. Manag._ 336, 117655 (2023). Article Google Scholar * Kashyap, R. & Kuttippurath, J. Unraveling the sensitivity and response of ecosystems to
rising moisture stress in India. _Ecosyst. Health Sustain._ 10, 0180 (2024). Article Google Scholar * Kashyap, R. & Kuttippurath, J. Warming-induced soil moisture stress threatens food
security in India. _Environ. Sci. Pollut. Res._ 31, 59202–59218 (2024). Article Google Scholar * Kuttippurath, J., Sunanda, N., Martin, M. V. & Chakraborty, K. Tropical storms trigger
phytoplankton blooms in the deserts of north Indian Ocean. _NPJ Clim. Atmos. Sci._ 4, 11 (2021). Article CAS Google Scholar * Kubota, H., Kosaka, Y. & Xie, S. P. A 117‐year long
index of the Pacific‐Japan pattern with application to interdecadal variability. _Int. J. Climatol._ 36, 1575–1589 (2016). Article Google Scholar * Yoo, J., Kwon, H. H., So, B. J.,
Rajagopalan, B. & Kim, T. W. Identifying the role of typhoons as drought busters in South Korea based on hidden Markov chain models. _Geophys. Res. Lett._ 42, 2797–2804 (2015). Article
Google Scholar * Chen, Y. Y. & Luyssaert, S. Tropical cyclones facilitate recovery of forest leaf area from dry spells in East Asia. _Biogeosciences_ 20, 349–363 (2023). Article Google
Scholar * Feldman, A. F. et al. Large global-scale vegetation sensitivity to daily rainfall variability. _Nature_ 636, 380–384 (2024). 35. Article CAS Google Scholar * Parida, B. R.,
Pandey, A. C. & Patel, N. R. Greening and browning trends of vegetation in India and their responses to climatic and non–climatic drivers. _Climate_ 8, 92 (2020). Article Google Scholar
* Chen, C. et al. China and India lead in greening of the world through land–use management. _Nat. Sustain._ 2, 122–129 (2019). Article Google Scholar * Kuttippurath, J. & Kashyap,
R. Greening of India: forests or croplands? _Appl. Geogr._ 161, 103115 (2023). Article Google Scholar * Roxy, M. K. et al. Drying of Indian subcontinent by rapid Indian Ocean warming and a
weakening land–sea thermal gradient. _Nat. Commun._ 6, 1–10 (2015). Article Google Scholar * Peter, R., Kuttippurath, J., Chakraborty, K. & Sunanda, N. A high concentration CO2 pool
over the Indo–Pacific Warm Pool. _Sci. Rep._ 13, 4314 (2023). Article CAS Google Scholar * Rajesh, P. V. & Goswami, B. N. Climate change and potential demise of the Indian deserts.
_Earth’s. Future_ 11, p.e2022EF003459 (2023). Article Google Scholar * Kashyap, R., Kuttippurath, J. & Patel, V. K. Improved air quality leads to enhanced vegetation growth during the
COVID–19 lockdown in India. _Appl. Geogr._ 151, 102869 (2023). Article Google Scholar * Patel, V. K., Kuttippurath, J. & Kashyap, R. Increased global cropland greening as a response to
the unusual reduction in atmospheric PM2. 5 concentrations during the COVID–19 lockdown period. _Chemosphere_ 358, 142147 (2024). Article CAS Google Scholar * Skofronick‐Jackson, G. et
al. The Global Precipitation Measurement (GPM) mission’s scientific achievements and societal contributions: reviewing four years of advanced rain and snow observations. _Q. J. R. Meteorol.
Soc._ 144, 27–48 (2018). Article Google Scholar * Liu, Y. Y. et al. Developing an improved soil moisture dataset by blending passive and active microwave satellite-based retrievals.
_Hydrol. Earth Syst. Sci._ 15, 425–436 (2011). Article Google Scholar * Grillakis, M. G., Koutroulis, A. G., Alexakis, D. D., Polykretis, C. & Daliakopoulos, I. N. Regionalizing
root‐zone soil moisture estimates from ESA CCI soil water index using machine learning and information on soil, vegetation, and climate. _Water Resour. Res._ 57, e2020WR029249 (2021).
Article Google Scholar * Otkin, J. A. et al. Examining rapid onset moisture stress development using the thermal infrared–based evaporative stress index. _J. Hydrometeorol._ 14, 1057–1074
(2013). Article Google Scholar * Young, D. J. et al. Long‐term climate and competition explain forest mortality patterns under extreme drought. _Ecol. Lett._ 20, 78–86 (2017). Article
Google Scholar * Magney, T. S. et al. Mechanistic evidence for tracking the seasonality of photosynthesis with solar-induced fluorescence. _Proc. Natl Acad. Sci. USA_ 116, 11640–11645
(2019). Article CAS Google Scholar * Shekhar, A., Buchmann, N. & Gharun, M. How well do recently reconstructed solar–induced fluorescence datasets model gross primary productivity?
_Remote Sens. Environ._ 283, 113282 (2022). Article Google Scholar * Li, X. et al. Solar‐induced chlorophyll fluorescence is strongly correlated with terrestrial photosynthesis for a wide
variety of biomes: first global analysis based on OCO‐2 and flux tower observations. _Glob. Change Biol._ 24, 3990–4008 (2018). Article Google Scholar * Xiao, J. et al. Solar‐induced
chlorophyll fluorescence exhibits a universal relationship with gross primary productivity across a wide variety of biomes. _Glob. Change Biol._ 25, e4–e6 (2019). Article Google Scholar *
Rascher, U. et al. Sun‐induced fluorescence–a new probe of photosynthesis: First maps from the imaging spectrometer HyPlant. _Glob. Change Biol._ 21, 4673–4684 (2015). Article CAS Google
Scholar * Kuttippurath, J. et al. Tropical cyclone-induced cold wakes in the northeast Indian Ocean. _Environ. Sci. Atmos._ 2, 404–415 (2022). Article Google Scholar * Le Houérou, H. N.
Rain use efficiency: a unifying concept in arid-land ecology. _J. Arid Environ._ 7, 213–247 (1984). Article Google Scholar * Huxman, T. E. et al. Convergence across biomes to a common
rain-use efficiency. _Nature_ 429, 651–654 (2004). Article CAS Google Scholar * Yang, Y., Fang, J., Fay, P. A., Bell, J. E. & Ji, C. Rain use efficiency across a precipitation
gradient on the Tibetan Plateau. _Geophys. Res. Lett_ 37, L15702 (2010). Article Google Scholar * Fensholt, R. & Rasmussen, K. Analysis of trends in the Sahelian ‘rain-use efficiency’
using GIMMS NDVI, RFE and GPCP rainfall data. _Remote Sens. Environ._ 115, 438–451 (2011). Article Google Scholar * He, B., Wang, H., Huang, L., Liu, J. & Chen, Z. A new indicator of
ecosystem water use efficiency based on surface soil moisture retrieved from remote sensing. _Ecol. Indic._ 75, 10–16 (2017). Article Google Scholar * Hao, H. et al. Recent variations in
soil moisture use efficiency (SMUE) and its influence factors in Asian drylands. _J. Clean. Prod._ 373, 133860 (2022). Article CAS Google Scholar * Granger, C. W. Investigating causal
relations by econometric models and cross-spectral methods. _Econometrica_ 37, 424–438 (1969). Article Google Scholar Download references ACKNOWLEDGEMENTS We thank the Director of the
Indian Institute of Technology Kharagpur (IIT Kgp), the Chairman of CORAL IIT Kgp and the Ministry of Education (MoE) for facilitating the study. RK acknowledges the support from the Prime
Minister’s Research Fellowship (PMRF), MoE. We sincerely thank Sunanda Narayanan and Akhila R.S for providing the precipitation data for all TCs. We thank the IMD for providing TC tracks and
NASA’s LPDAAC team for providing the MODIS land cover product; Giovanni’s online data system was developed and maintained by the NASA GES DISC for providing the GPM level-3 precipitation
data; ESA CCI for providing soil moisture data; CWD datasets from TERRA Climate. Special thanks to Jingfeng Xiao for making the GOSIF SiF dataset publicly accessible. The authors also thank
the RESPOND project: KCSTC 004/2017, STC 0248 for facilitating the study. AUTHOR INFORMATION AUTHORS AND AFFILIATIONS * CORAL, Indian Institute of Technology Kharagpur, Kharagpur, 721302,
India Rahul Kashyap & Jayanarayanan Kuttippurath Authors * Rahul Kashyap View author publications You can also search for this author inPubMed Google Scholar * Jayanarayanan Kuttippurath
View author publications You can also search for this author inPubMed Google Scholar CONTRIBUTIONS R.K. and J.K. conceptualised, designed methodology, and prepared the figures. RK analysed
and validated the data, and prepared the draft. J.K. supervised the research, and reviewed and edited the original draft. CORRESPONDING AUTHOR Correspondence to Jayanarayanan Kuttippurath.
ETHICS DECLARATIONS COMPETING INTERESTS The authors declare no competing interests. ADDITIONAL INFORMATION PUBLISHER’S NOTE Springer Nature remains neutral with regard to jurisdictional
claims in published maps and institutional affiliations. SUPPLEMENTARY INFORMATION SUPPLEMENTARY INFORMATION RIGHTS AND PERMISSIONS OPEN ACCESS This article is licensed under a Creative
Commons Attribution-NonCommercial-NoDerivatives 4.0 International License, which permits any non-commercial use, sharing, distribution and reproduction in any medium or format, as long as
you give appropriate credit to the original author(s) and the source, provide a link to the Creative Commons licence, and indicate if you modified the licensed material. You do not have
permission under this licence to share adapted material derived from this article or parts of it. The images or other third party material in this article are included in the article’s
Creative Commons licence, unless indicated otherwise in a credit line to the material. If material is not included in the article’s Creative Commons licence and your intended use is not
permitted by statutory regulation or exceeds the permitted use, you will need to obtain permission directly from the copyright holder. To view a copy of this licence, visit
http://creativecommons.org/licenses/by-nc-nd/4.0/. Reprints and permissions ABOUT THIS ARTICLE CITE THIS ARTICLE Kashyap, R., Kuttippurath, J. Tropical cyclones enhance photosynthesis in
moisture-stressed regions of India. _npj Clim Atmos Sci_ 8, 115 (2025). https://doi.org/10.1038/s41612-025-00988-z Download citation * Received: 25 December 2024 * Accepted: 28 February 2025
* Published: 21 March 2025 * DOI: https://doi.org/10.1038/s41612-025-00988-z SHARE THIS ARTICLE Anyone you share the following link with will be able to read this content: Get shareable
link Sorry, a shareable link is not currently available for this article. Copy to clipboard Provided by the Springer Nature SharedIt content-sharing initiative